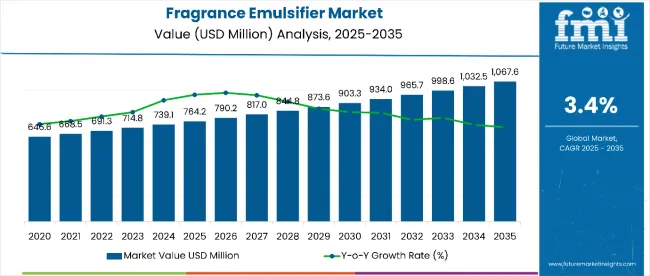
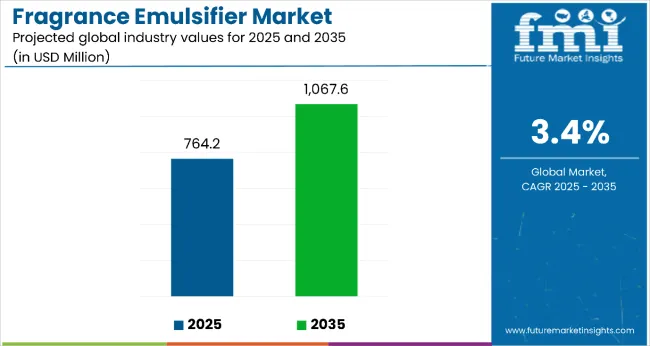
The global fragrance emulsifier market is valued at USD 764.2 million in 2025 and is poised to reach USD 1067.6 million by 2035, registering a CAGR of 3.4%. This growth reflects rising consumer interest in sensorial experiences across personal care, home care, and lifestyle products. Key drivers include increased demand for functional fragrances, wellness-focused formulations, and natural scent ingredients. The market is expected to add an absolute value of USD 303.4 million over the forecast period. The integration of fragrances into everyday products is expanding the industry’s relevance, especially in emerging markets where urbanization and income growth are fueling lifestyle upgrades.


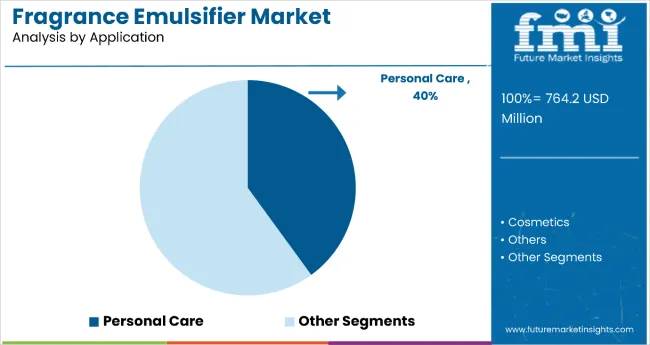
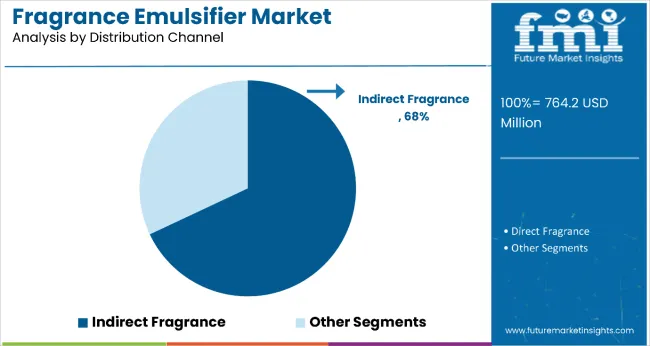
Personal care is set to dominate the market with a 40% share in 2025, supported by rising grooming and hygiene awareness. Indirect fragrance applications, which account for 68% of the total market, are gaining momentum through their incorporation in cleaning agents, air fresheners, and textiles. Regionally, the USA leads with a robust CAGR of 5.8%, followed by Germany (5.3%) and Japan (3.8%). While the UK and France trail with CAGRs of 2.8% and 2.7% respectively, their mature consumer bases remain valuable. Regional growth is further driven by evolving lifestyle habits and increasing demand for premium scented products.
Innovation and sustainability are shaping the competitive landscape of the market. Companies such as Givaudan, Firmenich, and Symrise are investing in sustainable sourcing, AI-assisted fragrance design, and regional scent preferences. Product innovation across clean-label, plant-based, and allergen-free formulations is attracting health-conscious consumers. Retail channels are also evolving, with digital platforms and specialty stores offering customized fragrance experiences.
The market holds approximately 38% of the overall fragrance ingredients market, driven by its critical role in stabilizing oil-in-water blends across personal care, home care, and fine fragrance formulations. It accounts for nearly 42% of the functional ingredient category in personal care, enabling the creation of consistent, long-lasting scent delivery in creams, lotions, and sprays. The market contributes around 33% to the natural cosmetics segment, as demand surges for plant-based, non-irritating emulsifiers aligned with clean beauty trends. Within the sustainable formulation category, it commands nearly 26% share, reflecting industry-wide moves toward biodegradable and eco-certified emulsifying systems.
The market is experiencing structural shifts due to increasing demand for transparent labeling, sustainable sourcing, and multi-functional formulation aids. Advanced emulsifier technologies such as PEG-free, bio-based, and non-ionic emulsifiers are gaining traction, enhancing both skin compatibility and product performance. Manufacturers are introducing customized emulsifier systems for waterless formats, solid fragrance products, and luxury skincare, meeting diverse brand needs.
Rising consumer demand for well-formulated, stable fragrance products has positioned emulsifiers as essential ingredients in personal care, home care, and fine fragrance sectors, fueling steady market growth. Increasing preference for natural and clean-label formulations is driving adoption of bio-based and sustainable emulsifiers that enhance product performance while meeting regulatory and environmental standards.
The market also benefits from expanding applications across diverse product categories, including lotions, creams, air fresheners, and household cleaners, where emulsifiers improve scent dispersion and longevity. Advances in emulsifier technology, such as PEG-free and multifunctional systems, are broadening formulation possibilities and appealing to health- and eco-conscious consumers.
As brands seek to differentiate through innovative scent delivery and sustainable ingredients, fragrance emulsifiers are positioned to capture growing demand. Increasing investments in R&D, coupled with strategic collaborations across fragrance houses and raw material suppliers, are further strengthening market prospects in both mature and emerging regions.
The market is segmented by notes, application, distribution channel, and region. By notes, the market is divided into oriental notes (sweet spices, amber, resins), woody notes (vetiver, amber, dry wood), fresh notes (aromatic herbs, citrus oils, aquatic notes, green notes, fruity notes), floral notes, and others (musk, gourmand, aldehydes). Based on application, the market is classified into personal care, cosmetics, pharmaceuticals, and others (household products, air fresheners). In terms of distribution channel, the market is bifurcated into direct fragrance and indirect fragrance such as hypermarkets/supermarkets, convenience stores, specialty stores, online retail, and others (wholesale distributors, salons). Regionally, the market is categorized into North America, Latin America, Western Europe, Eastern Europe, South Asia and Pacific, East Asia, and Middle East and Africa.

The personal care segment leads the market with a 40% share in 2025, driven by rising demand for fragranced products such as lotions, deodorants, shampoos, and body washes. Growing consumer focus on self-care, wellness, and grooming, particularly among millennials and Gen Z, continues to fuel this segment’s expansion. The adoption of natural and sustainable fragrances in personal care formulations further strengthens market growth. Compared to cosmetics, pharmaceuticals, and other categories, personal care benefits from higher product usage frequency and broader consumer reach, resulting in greater fragrance volumes.
Innovations in clean-label and hypoallergenic fragrance emulsifiers designed for sensitive skin are enhancing appeal and driving premiumization trends. Additionally, the segment is capitalizing on the growing male grooming market, ensuring sustained revenue momentum. In contrast, pharmaceuticals and niche categories hold smaller shares due to stricter regulations and limited fragrance incorporation.

The indirect fragrance distribution channel dominates with a 68% share in 2025, encompassing sales through hypermarkets, supermarkets, convenience stores, specialty stores, online platforms, and outlets such as wholesale distributors and salons. Hypermarkets and supermarkets lead within this segment, benefiting from high consumer footfall and the convenience of one-stop shopping in urban and suburban areas. The accessibility of indirect channels encourages faster product discovery and trial, which is particularly important for fragrance purchases.
Strategic marketing initiatives, in-store promotions, and sampling programs enhance brand visibility and consumer engagement. As shopping behaviors evolve, indirect distribution is increasingly integrating omnichannel strategies to provide a seamless purchasing experience. These advantages position the segment as a critical growth driver for fragrance sales worldwide.
From 2025 to 2035, growing consumer preference for sustainable, natural, and clean-label personal care and home fragrance products has significantly influenced the fragrance emulsifier market. This shift has positioned manufacturers emphasizing eco-friendly ingredients and multifunctional emulsifiers as key beneficiaries of expanding demand for transparent and health-conscious formulations.
Rising Demand for Sustainable and Clean-Label Products Drives Market Growth
Increasing awareness of environmental impact and ingredient safety has been the primary growth catalyst in the market. By 2024, regulatory pressure on synthetic emulsifiers and growing consumer scrutiny prompted brands to reformulate with bio-based and PEG-free emulsifiers. By 2025, demand for natural and hypoallergenic products accelerated adoption of emulsifiers that improve stability while meeting strict clean beauty standards. This trend demonstrates that ingredient sustainability and product safety, rather than cost alone, are becoming critical purchasing drivers.
Innovation in Multifunctional and Customized Emulsifier Systems Expands Market Opportunities
In 2024, manufacturers introduced advanced emulsifier blends designed for diverse applications from personal care to fine fragrances offering enhanced stability, skin compatibility, and sensory appeal. By 2025, tailored emulsifier solutions for waterless and solid fragrance formats gained traction, reflecting innovation aligned with emerging consumer preferences and regulatory frameworks.
These developments underscore that innovation beyond basic emulsification can command premium pricing and drive brand differentiation. Companies offering multifunctional, sustainable, and customized emulsifier systems are well-positioned to capture growing market share amid rising competition and evolving consumer expectations.
| Country | CAGR |
|---|---|
| USA | 5.8% |
| Germany | 5.3% |
| Japan | 3.8% |
| UK | 2.8% |
| France | 2.7% |
The USA leads with the highest CAGR of 5.8%, driven by strong investments in bio-based emulsifiers, regulatory shifts favoring natural products, and expanding e-commerce channels. Germany follows closely with a 5.3% CAGR, supported by stringent environmental regulations and a well-established cosmetics industry focused on green chemistry and sustainable production. Japan’s market grows moderately at 3.8%, emphasizing hypoallergenic and multifunctional emulsifiers tailored for an aging population and premium personal care products. The UK and France show more conservative growth rates of 2.8% and 2.7% respectively, influenced by rising demand for indie and sustainable brands in the UK and luxury, high-performance emulsifiers in France’s mature fragrance sector.
The report covers an in-depth analysis of 40+ countries; five top-performing OECD countries are highlighted below.
The USA fragrance emulsifier market is forecasted to grow at a CAGR of 5.8%, driven by substantial investments in production capacity to meet rising consumer demand for natural and clean-label products. Increasing regulatory pressure against synthetic emulsifiers has accelerated the shift toward bio-based alternatives, driving capacity expansions. Major manufacturers are upgrading facilities to enhance sustainable production methods, focusing on multifunctional emulsifiers that improve product stability and sensory appeal. Growth in e-commerce channels has also boosted demand, necessitating larger output to cater to diverse retail formats. Consumer preference for organic and hypoallergenic personal care products further fuels production growth. The USA market benefits from significant R&D efforts, enabling rapid innovation and quicker product commercialization.
Sales of fragrance emulsifiers in Germany are forecasted to grow at a CAGR of 5.3%, supported by stringent environmental and cosmetic regulations favoring sustainable ingredient use. Germany is witnessing steady output expansion in the fragrance emulsifier market, driven by stringent environmental and cosmetic regulations that favor sustainable ingredient use. The country’s well-established cosmetics industry continuously invests in green chemistry innovations to develop bio-based and biodegradable emulsifiers. Germany’s strong export focus to the wider European market necessitates scalable, eco-friendly production capabilities. Consumer preferences lean heavily towards organic and natural personal care products, encouraging manufacturers to expand output of certified emulsifiers. Additionally, Germany’s industrial expertise supports advanced formulation technologies enhancing product performance.
Sales of fragrance emulsifiers in Japan are projected to grow at a CAGR of 3.8%, showing gradual but consistent adoption of innovative emulsifier technologies in its fragrance market. Japan demonstrates gradual but consistent structural adoption of innovative emulsifier technologies in its fragrance market. The mature personal care industry is shifting towards formulations that prioritize skin sensitivity and hypoallergenic properties, supporting demand for specialized emulsifiers. Manufacturers are adopting multifunctional emulsifier blends that improve fragrance stability and texture, addressing evolving consumer expectations. Japan’s aging population is a significant factor, driving premiumization and demand for high-quality personal care products with gentle formulations. Advanced R&D capabilities allow rapid prototyping and refinement of emulsifier systems, while stringent quality standards ensure product safety. The country also places emphasis on eco-friendly ingredients, aligning with global clean beauty trends.
The UKfragrance emulsifier demand is forecasted to grow at a CAGR of 2.8%, with increasing market penetration fueled by the rise of indie brands and sustainable beauty products. The United Kingdom’s fragrance emulsifier market is characterized by increasing market penetration through the rise of indie brands and sustainable beauty products. Consumer preference for cruelty-free, vegan, and ethically sourced personal care products fuels demand for natural and biodegradable emulsifiers. Online retail growth expands accessibility to niche and artisanal fragrances, supporting diversified product offerings. Regulatory alignment with European standards maintains strict ingredient safety oversight. The UK market benefits from digital marketing and influencer campaigns that raise consumer awareness around clean beauty.
Fragrance emulsifier revenues in France are forecasted to grow at a CAGR of 2.7%, driven by premiumization and innovation within luxury personal care and fine fragrance segments. France remains a global fragrance capital, with the emulsifier market driven by premiumization and innovation within luxury personal care and fine fragrance segments. The country’s heritage in perfumery fuels demand for high-performance emulsifiers that preserve fragrance integrity and enhance product aesthetics. Clean beauty trends have pushed French manufacturers to develop natural and organic emulsifiers that align with consumer expectations for transparency and sustainability. Investment in R&D supports the integration of multifunctional emulsifiers that provide improved texture, stability, and skin compatibility. Luxury brands emphasize product differentiation through unique sensory experiences, increasing demand for advanced emulsifier technologies.
The fragrance emulsifier market is moderately consolidated, featuring a combination of global fragrance and flavor houses, specialty ingredient manufacturers, and regional suppliers with varying expertise in emulsification technology, product innovation, and application-specific solutions. Givaudan SA, Firmenich, IFF, and Symrise lead the market through vertically integrated operations, extensive fragrance formulation capabilities, and global distribution networks. Their strength lies in developing bio-based, sustainable emulsifiers and multifunctional ingredients tailored for personal care, cosmetics, and pharmaceutical applications.
Takasago, Mane SA, Frutarom, and Robertet SA differentiate through specialized emulsifier formulations, including natural, synthetic, and hybrid variants that meet diverse formulation requirements. These companies emphasize clean-label positioning, eco-friendly processing, and regulatory compliance to address the rising demand for natural fragrances and safer ingredient profiles.
Sensient Technologies Corporation and Royal Aroma focus on flexible formulation customization, rapid innovation cycles, and sustainable sourcing practices, enabling them to compete in premium and specialty fragrance segments.
Entry barriers remain high, driven by complex emulsification technology requirements, stringent regulatory frameworks, and the need for global supply chain integration to ensure ingredient safety and performance across multiple applications. Competitiveness increasingly depends on formulation versatility, sustainability credentials, and the ability to deliver high-performance fragrance emulsifiers for evolving personal care and cosmetic product landscapes.
Key Developments in Fragrance Emulsifier Market
In February 2025, LBB Specialties partnered with Kerry Group to distribute a new line of emollients, emulsifiers, and fermentation-derived actives in the USA and Canada, targeting skin care, personal care, and cosmetics markets.
| Item | Value |
|---|---|
| Quantitative Units | USD 764.2 Million |
| Notes | Oriental Notes (Sweet Spices, Amber, Resins), Woody Notes ( Vetiver, Amber, Dry Wood), Fresh Notes (Aromatic Herbs, Citrus Oils, Aquatic Notes, Green Notes, Fruity Notes), Floral Notes, and Others ( Musk, Powdery, Gourmand, a nd Metallic Notes ) |
| Application | Personal Care, Cosmetics, Pharmaceuticals, Others (Household, Industrial) |
| Distribution Channel | Direct Fragrance, Indirect Fragrance (Hypermarkets/Supermarkets, Convenience Stores, Specialty Stores, Online Retail, Others - Wholesale Distributors, Salons) |
| Regions Covered | North America, Latin America, Western Europe, Eastern Europe, South Asia and Pacific, East Asia, and Middle East and Africa |
| Countries Covered | United States, Canada, United Kingdom, Germany, France, China, Japan, South Korea, Brazil, Australia 40+ countries |
| Key Companies Profiled | Givaudan SA, Firmenich, IFF, Symrise, Takasago, Mane SA, Frutarom, Robertet SA, Sensient Technologies Corporation, and Royal Aroma. |
| Additional Attributes | Growing demand for clean-label formulations, rising preference for natural and sustainable ingredients, regulatory focus on ingredient safety, expanding personal care and cosmetics markets |
The global fragrance emulsifier market is estimated to be valued at USD 0.8 billion in 2025.
The market size for the fragrance emulsifier market is projected to reach USD 1.1 billion by 2035.
The fragrance emulsifier market is expected to grow at a 3.2% CAGR between 2025 and 2035.
The key product types in fragrance emulsifier market are oriental notes, _sweet spices, _amber, _resins, woody notes, _vetiver, _dry wood, fresh notes, _aromatic herbs, _citrus oils, _aquatic notes, _green notes, fruity notes, floral notes, others, _musk, _powdery, _gourmand, _metallic and _aldehydes.
In terms of application, personal care segment to command 41.8% share in the fragrance emulsifier market in 2025.


Our Research Products

The "Full Research Suite" delivers actionable market intel, deep dives on markets or technologies, so clients act faster, cut risk, and unlock growth.

The Leaderboard benchmarks and ranks top vendors, classifying them as Established Leaders, Leading Challengers, or Disruptors & Challengers.

Locates where complements amplify value and substitutes erode it, forecasting net impact by horizon

We deliver granular, decision-grade intel: market sizing, 5-year forecasts, pricing, adoption, usage, revenue, and operational KPIs—plus competitor tracking, regulation, and value chains—across 60 countries broadly.

Spot the shifts before they hit your P&L. We track inflection points, adoption curves, pricing moves, and ecosystem plays to show where demand is heading, why it is changing, and what to do next across high-growth markets and disruptive tech

Real-time reads of user behavior. We track shifting priorities, perceptions of today’s and next-gen services, and provider experience, then pace how fast tech moves from trial to adoption, blending buyer, consumer, and channel inputs with social signals (#WhySwitch, #UX).

Partner with our analyst team to build a custom report designed around your business priorities. From analysing market trends to assessing competitors or crafting bespoke datasets, we tailor insights to your needs.
Supplier Intelligence
Discovery & Profiling
Capacity & Footprint
Performance & Risk
Compliance & Governance
Commercial Readiness
Who Supplies Whom
Scorecards & Shortlists
Playbooks & Docs
Category Intelligence
Definition & Scope
Demand & Use Cases
Cost Drivers
Market Structure
Supply Chain Map
Trade & Policy
Operating Norms
Deliverables
Buyer Intelligence
Account Basics
Spend & Scope
Procurement Model
Vendor Requirements
Terms & Policies
Entry Strategy
Pain Points & Triggers
Outputs
Pricing Analysis
Benchmarks
Trends
Should-Cost
Indexation
Landed Cost
Commercial Terms
Deliverables
Brand Analysis
Positioning & Value Prop
Share & Presence
Customer Evidence
Go-to-Market
Digital & Reputation
Compliance & Trust
KPIs & Gaps
Outputs
Full Research Suite comprises of:
Market outlook & trends analysis
Interviews & case studies
Strategic recommendations
Vendor profiles & capabilities analysis
5-year forecasts
8 regions and 60+ country-level data splits
Market segment data splits
12 months of continuous data updates
DELIVERED AS:
PDF EXCEL ONLINE
Fragrance Control Module Assembly Market Size and Share Forecast Outlook 2025 to 2035
Fragrance Diffuser Market Size and Share Forecast Outlook 2025 to 2035
Fragrance Product Market Size and Share Forecast Outlook 2025 to 2035
Fragranced Personal Care Products Market Analysis - Size and Share Forecast Outlook 2025 to 2035
Emulsifiers Market Size and Share Forecast Outlook 2025 to 2035
Emulsifier Blends / Self-Emulsifying Bases Market Analysis - Size and Share Forecast Outlook 2025 to 2035
Emulsifiers in Personal Care Market Analysis - Size, Share, and Forecast Outlook 2025 to 2035
Fragrance Fixatives Market Size and Share Forecast Outlook 2025 to 2035
Emulsifiers, Stabilizers, and Thickeners Market Size and Share Forecast Outlook 2025 to 2035
Fragrance Jewellery Pods Market Analysis Size and Share Forecast Outlook 2025 to 2035
Fragrance Concentrates Market Size and Share Forecast Outlook 2025 to 2035
Emulsifier-Free Skincare Market Growth – Size, Trends & Forecast 2024-2034
Fragrance-free Serum Market Report – Growth & Trends 2024-2034
Fragrance Oil Market
Demulsifier Market
Co-Emulsifiers Market Size and Share Forecast Outlook 2025 to 2035
Lab Emulsifier Market Size and Share Forecast Outlook 2025 to 2035
Egg Emulsifier Market Analysis - Size, Share, & Forecast Outlook 2025 to 2035
AKD Emulsifier Market Growth - Trends & Forecast 2025 to 2035
Evaluating Egg Emulsifier Market Share & Provider Insights

Thank you!
You will receive an email from our Business Development Manager. Please be sure to check your SPAM/JUNK folder too.
Chat With
MaRIA