

- Market Size (2026)
- USD 720.7 Mn
- Forecast (2036)
- USD 1644.6 Mn
- CAGR (2026 to 2036)
- 8.6%
How big is the hall sensor boards market size?
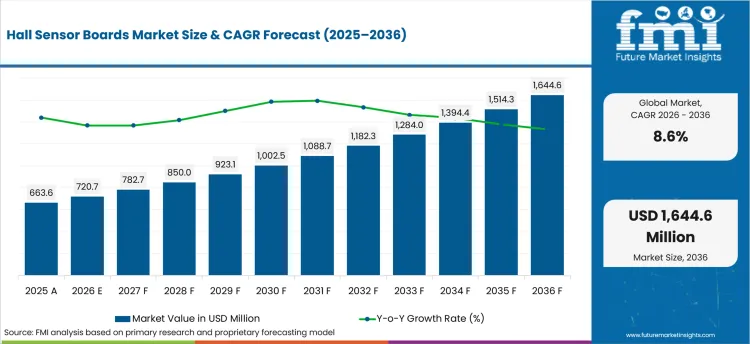
USD 720.7 million in 2026 and USD 1,644.6 million by 2036 at an 8.6% CAGR.
Sales in hall sensor boards market are projected to grow at 8.6% CAGR through 2036, driving valuation to USD 1,644.6 million by 2036 from USD 720.7 million in 2026. Automation OEMs and motion-control buyers are expected to need board assemblies supporting current feedback and fault detection across recurring equipment programs. International Federation of Robotics recorded 542,000 industrial robot installations in 2024 in its September 25, 2025 release to support hall sensor board qualification across automated lines.
India and China buyers are anticipated to favor local board access and application support for motor-control programs. Taiwan and South Korea accounts are forecast to review electronics supply depth and rapid engineering response before approved supplier changes. United States and Germany buyers are expected to compare documentation depth and reliability evidence during vendor qualification. Japan accounts are likely to emphasize compact design proof and long-cycle approval control.
| Metric | Value |
|---|---|
| 2025 Market Size | USD 663.6 million |
| 2026 Market Size | USD 720.7 million |
| 2036 Market Size | USD 1,644.6 million |
| Forecast CAGR (2026-2036) | 8.6% |
| Leading Application | BLDC Motor Commutation |
| BLDC Motor Commutation Share (2026) | 36.0% |
| Leading Board Type | Three-phase Motor Hall Boards |
| Three-phase Motor Hall Boards Share (2026) | 32.0% |
| Leading Sensor Output | Linear Hall |
| Linear Hall Share (2026) | 31.0% |
Summary of the Hall Sensor Boards Market
| Market Signal | Commercial Impact |
|---|---|
| Demand and Growth Drivers | Demand for hall sensor boards is expected to rise as automation buyers connect board-level sensing with motor accuracy and validated equipment response. Account decisions are likely to reflect controller compatibility and support speed across repeat orders.
|
| Product and Segment View | Segment demand is led by magnetic-sensing formats supporting motor-control and position-feedback applications. Specification work is projected to concentrate on approved board programs designed to reduce rework and support predictable equipment commissioning.
|
| Geography and Growth Outlook | Country demand is anticipated to be guided by factory automation depth and service-led qualification. Supplier gains are expected to reflect local technical support and proof-led account review.
|
| Competitive Landscape | Competition is anticipated to focus on sensor IC portfolios and application support. Account gains are expected to favor suppliers with credible product roadmaps and dependable replenishment.
|
| Analyst Perspective | Hall sensor boards are developing into a specification-led electronic component segment linked to compact equipment design and service assurance. Supplier progress is projected to improve through evidence quality and application support aligned with automation and precision equipment needs.
|
Source: Future Market Insights analysis, 2026.
How is the hall sensor boards market segmented?
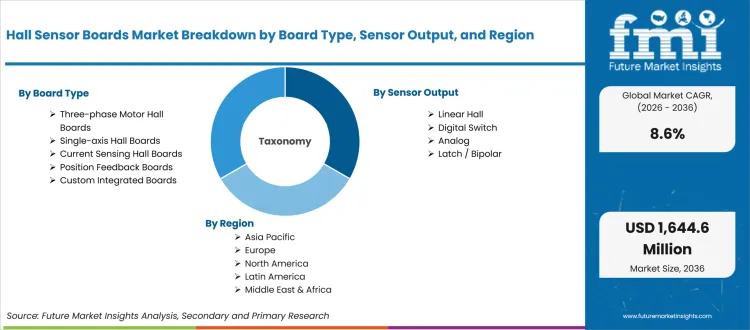
The hall sensor boards market is segmented by board type, sensor output, application, end use, sales model, and region.
The hall sensor boards industry coverage includes board type, sensor output, application, end use, sales model and region. Board type coverage includes Single-axis Hall Boards, Three-phase Motor Hall Boards, Current Sensing Hall Boards, Position Feedback Boards and Custom Integrated Boards. Sensor output coverage includes Analog, Digital Switch, Linear Hall and Latch / Bipolar. Application coverage includes BLDC Motor Commutation, Position Sensing, Current Sensing, Speed Detection and Limit / Proximity Sensing. End use coverage includes Industrial Motors, Automotive Electronics, Consumer Appliances, Robotics and Medical Devices. Sales model coverage includes Standard Board Supply, Custom PCB Assembly and Sensor Module Bundled. Regional coverage includes North America, Latin America, Europe, East Asia, South Asia, Oceania and Middle East and Africa.
What supports demand for three-phase motor hall boards within board type?
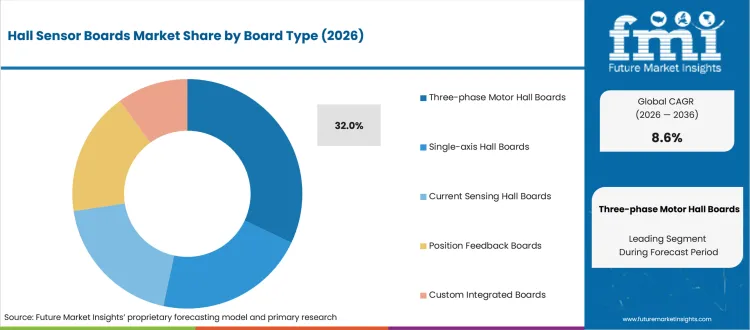
Three-phase motor hall boards are expected to support demand as equipment builders need rotor-position feedback aligned with motor-control electronics and commissioning checks. Automation programs are likely to prefer boards with clear pinout files and proven controller compatibility. International Federation of Robotics recorded annual robot installations above 500,000 units for the fourth straight year in 2024 in its September 25, 2025 release to reinforce board assembly demand across automated motion systems.
- Three-phase motor hall boards are estimated to hold 32.0% share in 2026, aided by motor-control familiarity and service replacement needs. Buyers prefer selected boards once electrical files and installation proof shorten approval cycles.
- Single-axis and current sensing boards remain useful for simpler equipment programs. Three-phase Motor Hall Boards gain account attention once motor commutation accuracy and service access guide replacement planning.
How is linear hall positioned within sensor output?
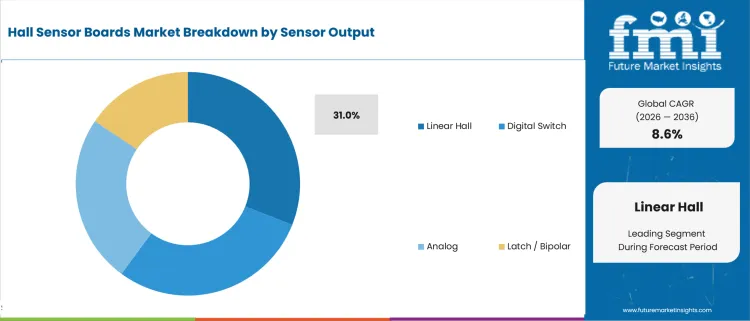
Linear Hall is forecast to support proportional sensing requirements across stroke measurement and compact control interfaces. Design teams are expected to compare temperature range and package availability before assigning boards to recurring equipment platforms. Melexis stated in its December 11, 2025 release its MLX90296 draws less than 5 µA at 100 Hz to support battery-powered sensing designs needing lower power use.
- Linear hall is projected to account for 31.0% share in 2026, reflected by proportional feedback and compact sensing needs. Equipment teams prefer linear output once calibration stability and board layout proof are documented.
- Analog and latch / bipolar formats support different switching requirements. Linear Hall gains preference once proportional sensing improves control response across equipment designs.
What drives BLDC motor commutation demand within application?
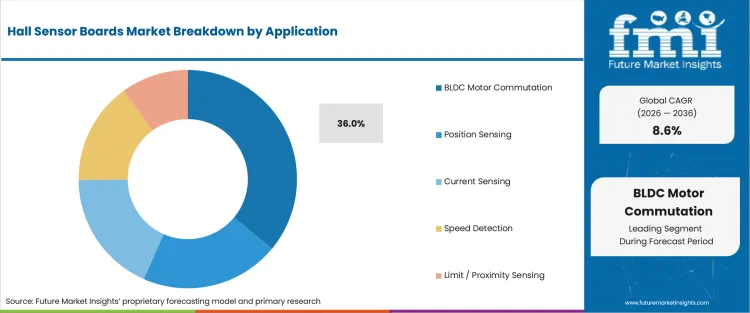
BLDC motor commutation is anticipated to lead application demand as motor-control systems need dependable rotor-position feedback and noise-resistant signal handling. Board suppliers are likely to face tighter review around timing accuracy and controller interface quality. Allegro MicroSystems stated in its January 8, 2025 release its ACS37220MZ features 150 kHz bandwidth and a fault pin to support faster current feedback in compact sensing systems.
- BLDC motor commutation is forecast to capture 36.0% share in 2026, led by motor-control use across automation and compact drive systems. Suppliers gain approval once signal timing and controller compatibility meet equipment acceptance checks.
- Position sensing and current sensing applications require different board characteristics. BLDC motor commutation retains review priority once machine builders connect motor accuracy with reduced field adjustment.
How do automotive electronics influence end use demand?
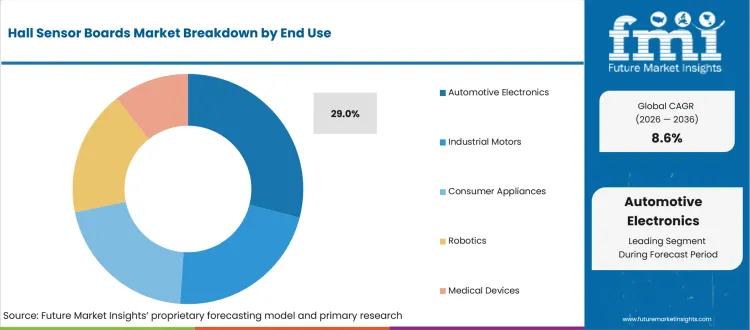
Automotive electronics are expected to support demand as vehicle manufacturers increasingly integrate hall sensor boards into electric power steering systems and safety-related electronic systems. Growing electrification trends and expanding electronic content per vehicle continue to reinforce demand for precision sensing and motor-control components.
- Automotive electronics are estimated to hold 29.0% share in 2026, helped by recurring replacement needs and increasing motor-control integration. OEMs prefer board designs that support reliable performance and straightforward service throughout the vehicle lifecycle.
- Automotive electronics add specialized demand requirements, particularly in electric propulsion and auxiliary motor systems. Hall sensor boards gain selection strength when durability and replacement availability influence supplier evaluations and platform approval decisions.
How does custom PCB assembly support sales model demand?
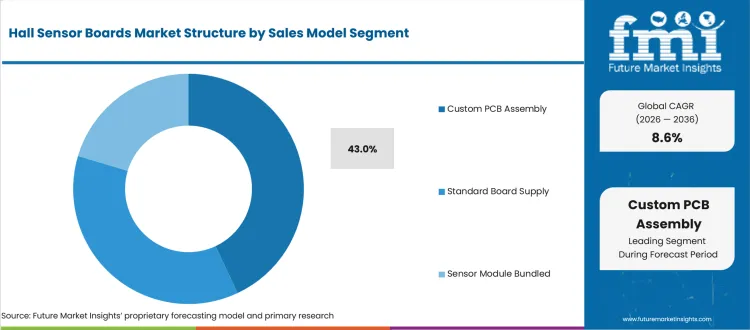
Custom PCB assembly is projected to guide purchase decisions as buyers need repeatable part availability and stable electrical specifications across routine equipment programs. Texas Instruments stated in its September 9, 2025 release its TMAG5134 consumes just 0.6 µA on average to support lower-power board options in compact sensing applications.
- Custom PCB assembly is anticipated to account for 43.0% share in 2026, driven by recurring orders and controlled product documentation. Buyers prefer standard boards once service teams need faster replacement and known electrical behavior.
- Custom PCB assembly and sensor module bundled models support project-specific requirements. Standard Board Supply gains preference once qualification evidence and replenishment discipline outweigh customization needs.
What are the drivers restraints and opportunities in the hall sensor boards market?
Near-term purchases are shaped by product availability and service-led adoption routes outlined below.
- Driver Machine builders are replacing less-documented sensing assemblies with validated hall sensor boards designed to improve motor feedback and installation repeatability.
- Restraint Adoption slows if board dimensions or acceptance files fail equipment review.
- Opportunity Suppliers offering sensing IC knowledge and local technical response improve approval chances across automation accounts.
Demand is expected to rise as factory automation programs require sensing assemblies with proven feedback performance and repeatable board design. International Federation of Robotics recorded 267 robots per 10,000 manufacturing employees across Western Europe in 2024 in its April 8, 2026 release to support precise board-level sensing demand across automated production.
Restraints are likely to center on qualification gaps between sensor specifications and board-level equipment behavior. International Federation of Robotics recorded 30,650 EU automotive robot installations in 2024 in its September 25, 2025 release after a 5% year-on-year decline to reflect delayed automation spending affecting new board qualifications.
Opportunities are projected to expand as suppliers improve current sensing and position sensing around compact power electronics. Melexis stated in its March 27, 2025 release MLX91218-LF targets applications below 100 A to support smaller industrial distribution units and EV charging cables needing compact Hall-current sensing.
What country CAGRs are profiled in the hall sensor boards market?
.webp "Top Country Growth Comparison Hall Sensor Boards Market Cagr (2026 2036)")
| Country | CAGR |
|---|---|
| India | 10.8% |
| China | 9.9% |
| Taiwan | 8.4% |
| South Korea | 8.1% |
| United States | 7.4% |
| Germany | 6.9% |
| Japan | 6.5% |
Source: Future Market Insights analysis, 2026.
How do country-level CAGRs compare in the hall sensor boards market?
Country demand in hall sensor boards is expected to be guided by electronics production depth and design-support availability. India and China are likely to connect demand with robot adoption and local motion-control supply. Taiwan and South Korea are anticipated to connect adoption with electronics manufacturing and high-density equipment programs. United States, Germany and Japan are projected to connect demand with documentation depth and longer approval cycles.
- India hall sensor boards demand is likely to be shaped by factory automation expansion and motor-control localization. Demand in India is projected to grow at 10.8% CAGR through 2036, reflected by board requirements across automation equipment and service replacement. International Federation of Robotics recorded 9,120 industrial robot installations in India during 2024 in its September 25, 2025 release to support sensor-board qualification across local equipment programs.
- China hall sensor boards demand is projected to be influenced by industrial robot scale and domestic electronics supply. International Federation of Robotics recorded China operational robot stock above 2 million units in 2024 in its September 25, 2025 release to support position sensing and motor-control board demand across automated plants. China is forecast to expand at 9.9% CAGR from 2026 to 2036, backed by automation depth and local sourcing strength.
- Taiwan buyers are expected to favor suppliers supporting electronics production and compact sensing formats. Ministry of Economic Affairs recorded a 12.68% increase in Taiwan manufacturing production index for May 2026 in its June 24, 2026 release to support board demand linked to electronic component output. Sector in Taiwan is projected to post 8.4% CAGR during the forecast period as compact equipment makers need stable hall sensor boards for precision feedback.
- South Korea demand is predicted to grow at 8.1% CAGR by 2036, reinforced by automation intensity and compact manufacturing networks. International Federation of Robotics recorded 1,220 robots per 10,000 manufacturing employees in Republic of Korea during 2024 in its April 8, 2026 release to keep sensor-board review close to automated production lines. Korean buyers are expected to compare suppliers on documentation speed and response quality.
- United States hall sensor boards purchasing is anticipated to be guided by automation replacement needs and integrator-led equipment support. Demand in United States is expected to advance at 7.4% CAGR during the assessment period, guided by industrial robot use and safety-focused supplier review. International Federation of Robotics recorded 34,200 United States robot installations in 2024 in its September 25, 2025 release to support magnetic sensing board requirements across factory automation programs.
- Industry in Germany is estimated to expand at 6.9% CAGR between 2026 and 2036, reinforced by engineering review discipline and automation system validation. German buyers are expected to review board reliability, safety documentation and supplier traceability before replacing approved sensing assemblies. International Federation of Robotics recorded 449 robots per 10,000 manufacturing employees in Germany during 2024 in its April 8, 2026 release to support technical scrutiny for feedback boards used in automated equipment.
- Japan keeps hall sensor boards demand close to compact equipment design and long-cycle approval. International Federation of Robotics recorded 446 robots per 10,000 manufacturing employees in Japan during 2024 in its April 8, 2026 release to sustain demand for reliable feedback boards used across factory equipment. Sector in Japan is forecast to register 6.5% CAGR through 2036, shaped by precision requirements and qualification depth.
Who are the notable companies in the hall sensor boards market?
Infineon, Allegro MicroSystems, Texas Instruments, Melexis, TDK Micronas, Honeywell, Diodes Incorporated, Monolithic Power Systems, Sensitec and NXP Semiconductors are expected to shape hall sensor boards supply.
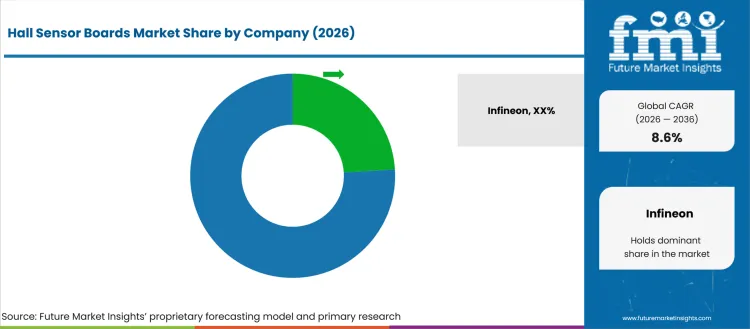
Competition in hall sensor boards is anticipated to center on board compatibility and application support. Account teams are likely to compare suppliers based on documentation quality and ability to support recurring board approvals after initial qualification. Infineon, Allegro MicroSystems, Texas Instruments, Melexis, TDK Micronas and Honeywell remain valid active participants through magnetic sensing and adjacent electronics portfolios. Diodes Incorporated, Monolithic Power Systems, Sensitec and NXP Semiconductors remain credible adjacent suppliers led by sensing technologies and industrial electronics coverage.
- Infineon, Allegro MicroSystems and Texas Instruments are expected to gain account attention based on magnetic sensing depth and documentation strength. Sensor IC experience is likely to promote board programs needing qualification support and stable electrical files.
- Melexis, TDK Micronas and Honeywell are anticipated to compete led by position sensing and current sensing knowledge. Competitive role is projected to improve as automation and automotive electronics buyers review board-level sensing evidence.
- Diodes Incorporated and Monolithic Power Systems are forecast to support demand depending on component portfolio depth and distribution access. Electronics breadth is expected to help accounts compare alternative sourcing options.
- Sensitec and NXP Semiconductors are estimated to gain review strength through magnetic sensing and embedded electronics support. Supplier access is likely to improve as equipment makers need validated sensing assemblies and stable channels.
Competitive Benchmarking Hall Sensor Boards Market
| Company | Portfolio Alignment | Segment Match | Documentation Depth | Service Reach |
|---|---|---|---|---|
| Infineon | High | High | High | Global |
| Allegro MicroSystems | High | High | High | Global |
| Texas Instruments | High | High | High | Global |
| Melexis | High | High | High | Global |
| TDK Micronas | Medium | High | High | Global |
| Honeywell | Medium | High | High | Global |
| Diodes Incorporated | Medium | Medium | High | Regional |
| Monolithic Power Systems | Medium | Medium | Medium | Regional |
| Sensitec | Medium | Medium | Medium | Regional |
| NXP Semiconductors | Medium | Medium | Medium | Regional |
Source: Future Market Insights competitive analysis, 2026.
Key Developments in the Hall Sensor Boards Market
- In April 2025, TDK Corporation introduced the Micronas HAL/HAR 35xy Hall-effect 2D position sensor family for automotive and industrial applications. TDK Micronas stated in its April 8, 2025 release HAL 3550 and HAR 3550 include single-die and dual-die versions to support board programs requiring redundancy and safety-ready position sensing.
- In July 2025, Infineon launched the third generation of its XENSIV 3D magnetic Hall-effect sensor family. Infineon stated in its July 10, 2025 release TLE493D-X3XX supports 3.3 V and 5 V supply voltage with ±50 mT, ±100 mT and ±160 mT magnetic field ranges to improve design options for position-sensing boards.
- In August 2025, Melexis introduced a variant of MLX92211 for compact motor latch sensing. Melexis stated in its August 28, 2025 release MLX92211 IMC supports 2.7 V to 24 V operation and 30 mA current limit to help board designers address compact automotive motor modules.
Key Players in the Hall Sensor Boards Market
Motion component and magnetic sensing suppliers
- Infineon
- Allegro MicroSystems
- Texas Instruments
- Melexis
Precision sensing and industrial component suppliers
- TDK Micronas
- Honeywell
- Diodes Incorporated
Distribution and application support partners
- Monolithic Power Systems
- Sensitec
- NXP Semiconductors
Hall Sensor Boards Market Report Scope
| Coverage field | Report scope |
|---|---|
| Market breakdown | Hall Sensor Boards Market breakdown by board type, sensor output, application, end use, sales model and region |
| Market Definition | Hall sensor boards are printed circuit board assemblies using Hall-effect sensing components to support position feedback, motor commutation, current sensing, speed detection, proximity sensing and equipment-control functions. |
| Regions Covered | North America, Latin America, Europe, East Asia, South Asia, Oceania and Middle East and Africa |
| Countries Covered | United States, China, Germany, Japan, India, South Korea, Taiwan, Canada, Brazil, Mexico, France, Italy, Spain, Thailand, Indonesia, Australia, New Zealand, GCC countries, South Africa and Turkey |
| Key Companies Profiled | Infineon, Allegro MicroSystems, Texas Instruments, Melexis, TDK Micronas, Honeywell, Diodes Incorporated, Monolithic Power Systems, Sensitec and NXP Semiconductors |
| Forecast Period | 2026 to 2036 |
| Approach | Hybrid bottom-up and top-down methodology using segment share, country CAGR, automation component demand, motor-control adoption, sensing IC portfolios, PCB assembly routes, distributor coverage and industrial equipment indicators |
Source: Future Market Insights analysis, 2026.
Hall Sensor Boards Market Research Methodology
| Method | Approach |
|---|---|
| Primary Research | Primary interviews covered machine builders, automation OEMs, maintenance teams, component distributors, precision equipment manufacturers, electronics assemblers and system integrators. Discussions focused on sensing accuracy, board alignment, controller compatibility, acceptance barriers, service ownership, replacement behavior and supplier switching limits. |
| Desk Research | Desk research reviewed official automation statistics, robotics association references, company product releases, sensor IC portfolios, standards-body context and industry statistics. Product review considered automation uptime, machine accuracy, retrofit compatibility, drive protection and shorter equipment commissioning cycles. |
| Market Sizing and Forecasting | Market sizing used a hybrid model across segment mix, country CAGR, automation demand, motor-control board adoption, channel coverage and supplier participation across hall sensor boards. |
| Data Validation | Data validation compared segment shares, country CAGRs, company alignment, source dates and official automation signals to avoid unsupported claims and unrelated component leakage. Company profiles were reviewed to avoid counting adjacent businesses without clear product alignment. |
Source: Future Market Insights analysis, 2026.
Hall Sensor Boards Market by Segments
Hall Sensor Boards Market segmented by Board Type
- Single-axis Hall Boards
- Three-phase Motor Hall Boards
- Current Sensing Hall Boards
- Position Feedback Boards
- Custom Integrated Boards
Hall Sensor Boards Market segmented by Sensor Output
- Analog
- Digital Switch
- Linear Hall
- Latch / Bipolar
Hall Sensor Boards Market segmented by Application
- BLDC Motor Commutation
- Position Sensing
- Current Sensing
- Speed Detection
- Limit / Proximity Sensing
Hall Sensor Boards Market segmented by End Use
- Industrial Motors
- Automotive Electronics
- Consumer Appliances
- Robotics
- Medical Devices
Hall Sensor Boards Market segmented by Sales Model
- Standard Board Supply
- Custom PCB Assembly
- Sensor Module Bundled
Hall Sensor Boards Market by Region
- North America
- United States
- Canada
- Latin America
- Brazil
- Mexico
- Argentina
- Europe
- Germany
- United Kingdom
- France
- Italy
- Spain
- East Asia
- China
- Japan
- South Korea
- South Asia
- India
- Thailand
- Indonesia
- Oceania
- Australia
- New Zealand
- Middle East and Africa
- GCC countries
- South Africa
- Turkey
Research Sources and Bibliography
- Allegro MicroSystems. (2025, January 8). Allegro MicroSystems redefines sensing with launch of new current sensor ICs in compact packages.
- Infineon Technologies AG. (2025, July 10). XENSIV magnetic 3D sensor enables high-precision angle and linear position sensing.
- International Federation of Robotics. (2025, September 25). World Robotics 2025 report global robot demand in factories doubles over 10 years.
- International Federation of Robotics. (2025, September 25). India rises to sixth in global factory robot installations.
- International Federation of Robotics. (2025, September 25). EU auto sector sees drop in robot adoption.
- International Federation of Robotics. (2026, April 8). Robot density surges in Europe, Asia and Americas.
- Melexis. (2025, March 27). Melexis expands its IMC-Hall current sensor ICs for smart power applications.
- Melexis. (2025, August 28). Melexis latch slims down motor applications.
- Melexis. (2025, December 11). Melexis brings micropower to linear Hall devices in gaming, IoT and industrial.
- Ministry of Economic Affairs. (2026, June 24). Industrial Production Index in May 2026.
- TDK Micronas. (2025, April 8). TDK unveils new high-performance, cost-effective Hall-effect 2D position sensor family for automotive applications.
- Texas Instruments. (2025, September 9). TI unveils the industrys most sensitive in-plane Hall-effect switch, enabling lower design costs.
This bibliography is provided for reader reference and is not exhaustive. The full report contains the complete reference list and detailed citations.
This Report Answers
- What segments shape demand across board type, sensor output, application, end use and sales model?
- How do automation equipment buyers evaluate hall sensor boards before supplier approval?
- How do country CAGRs differ across profiled accounts?
- What companies compete through magnetic sensing depth and board-level support?
- How does FMI validate forecasts using a hybrid bottom-up and top-down approach?
- What factors should account teams address before larger account expansion?
- How do documentation files and controller compatibility affect supplier selection?
- What limits return on investment for account teams adding hall sensor boards to equipment programs?
- How do test records and field-support response influence account approval?
- What supplier capabilities improve long-term account confidence?
Frequently Asked Questions
What is supporting demand in the hall sensor boards market?
Demand is likely to be supported by automation OEMs needing board assemblies for motor feedback and position sensing. Accounts are expected to prefer suppliers combining stable specifications and practical support.
Who are the key players in the hall sensor boards market?
Key companies are anticipated to include Infineon, Allegro MicroSystems, Texas Instruments, Melexis, TDK Micronas, Honeywell, Diodes Incorporated, Monolithic Power Systems, Sensitec and NXP Semiconductors. Competition is likely to be based on sensing portfolio depth and regional service coverage.
What is a restraint in the hall sensor boards market?
Qualification burden creates a restraint as equipment buyers often delay supplier changes until board alignment, controller compatibility and acceptance files are complete. Accounts slow adoption if product evidence fails to support service responsibility and repeat-order confidence.
Why should executives track the hall sensor boards market?
Executives are expected to track the market as board selection affects equipment reliability and supplier accountability. Factors such as service response and repeat-order confidence shape buyer reviews.
What business problem does the hall sensor boards market address?
Hall sensor boards address a practical control problem for equipment builders needing reliable feedback and replacement planning across automated systems. Buyers use selected boards to reduce uncertainty in motion-control performance and service workflows.
What should account teams evaluate before selecting suppliers?
Account teams are likely to evaluate board documentation and repeat-order reliability before supplier approval. Controller compatibility and field troubleshooting support are expected to guide final supplier review.
What limits return on investment for purchasing teams?
Return on investment weakens if product acceptance or field performance is not proven before launch. Rework and replacement delays reduce expected operating gains.
How do suppliers build long-term account confidence?
Suppliers build account confidence by providing consistent board quality and product evidence specific to hall sensor boards. Test records and responsive engineering support are expected to influence repeat-order trust.
Preview the report firsthand - request a free sample
Get SampleGet the brochure for pricing and purchase details.
Get PDFTable of Content
- Key Takeaways
- Market Size and CAGR
- Top Growth Driver
- Fastest Growing Segment
- Leading Region
- Key Companies
- Emerging Opportunities
- Executive Summary
- Global Market Outlook
- Demand-side Trends
- Supply-side Trends
- Technology Roadmap Analysis
- Analysis and Recommendations
- Analyst Perspective (What is happening? Why now? What should investors know?)
- Key Questions Answered
- How large is the market?
- What is the CAGR?
- What are key trends?
- Which region dominates?
- Who are the leaders?
- Market Overview
- Market Coverage / Taxonomy
- Market Definition / Scope / Limitations
- Research Methodology
- Chapter Orientation
- Analytical Lens and Working Hypotheses
- Market Structure, Signals, and Trend Drivers
- Benchmarking and Cross-market Comparability
- Market Sizing, Forecasting, and Opportunity Mapping
- Research Design and Evidence Framework
- Desk Research Programme (Secondary Evidence)
- Expert Input and Fieldwork (Primary Evidence)
- Tooling, Models, and Reference Databases
- Data Engineering and Model Build
- Quality Assurance and Audit Trail
- Market Background
- Market Dynamics (Drivers, Restraints, Opportunity, Trends)
- Scenario Forecast (Optimistic, Likely, Conservative)
- Impact Analysis
- AI Impact
- Sustainability Impact
- Regulatory Impact
- Technology Impact
- Consumer / Buyer Analysis
- Purchase Drivers
- Adoption Barriers
- Buyer Journey
- Opportunity Map Analysis
- Product Life Cycle Analysis
- Supply Chain Analysis
- Investment Feasibility Matrix
- Value Chain Analysis
- PESTLE and Porter's Analysis
- Regulatory Landscape
- Regional Parent Market Outlook
- Production and Consumption Statistics
- Import and Export Statistics
- Global Market Analysis and Forecast, 2021 to 2036
- Historical Market Size Value (USD Million) & Volume (Unit) Analysis, 2021 to 2025
- Current and Future Market Size Value (USD Million) & Volume (Unit) Projections, 2026 to 2036
- Y-o-Y Growth Trend Analysis
- Absolute $ Opportunity Analysis
- Global Market Pricing Analysis, 2021 to 2036
- Global Market Analysis and Forecast, By Board Type, 2021 to 2036
- Introduction / Key Findings
- Historical Market Size Value (USD Million) & Volume (Unit) Analysis By Board Type, 2021 to 2025
- Current and Future Market Size Value (USD Million) & Volume (Unit) Analysis and Forecast By Board Type, 2026 to 2036
- Three-phase Motor Hall Boards
- Single-axis Hall Boards
- Current Sensing Hall Boards
- Position Feedback Boards
- Custom Integrated Boards
- Three-phase Motor Hall Boards
- Y-o-Y Growth Trend Analysis By Board Type, 2021 to 2025
- Absolute $ Opportunity Analysis By Board Type, 2026 to 2036
- Global Market Analysis and Forecast, By Sensor Output, 2021 to 2036
- Introduction / Key Findings
- Historical Market Size Value (USD Million) & Volume (Unit) Analysis By Sensor Output, 2021 to 2025
- Current and Future Market Size Value (USD Million) & Volume (Unit) Analysis and Forecast By Sensor Output, 2026 to 2036
- Linear Hall
- Digital Switch
- Analog
- Latch / Bipolar
- Linear Hall
- Y-o-Y Growth Trend Analysis By Sensor Output, 2021 to 2025
- Absolute $ Opportunity Analysis By Sensor Output, 2026 to 2036
- Global Market Analysis and Forecast, By Application, 2021 to 2036
- Introduction / Key Findings
- Historical Market Size Value (USD Million) & Volume (Unit) Analysis By Application, 2021 to 2025
- Current and Future Market Size Value (USD Million) & Volume (Unit) Analysis and Forecast By Application, 2026 to 2036
- BLDC Motor Commutation
- Position Sensing
- Current Sensing
- Speed Detection
- Limit / Proximity Sensing
- BLDC Motor Commutation
- Y-o-Y Growth Trend Analysis By Application, 2021 to 2025
- Absolute $ Opportunity Analysis By Application, 2026 to 2036
- Global Market Analysis and Forecast, By End Use, 2021 to 2036
- Introduction / Key Findings
- Historical Market Size Value (USD Million) & Volume (Unit) Analysis By End Use, 2021 to 2025
- Current and Future Market Size Value (USD Million) & Volume (Unit) Analysis and Forecast By End Use, 2026 to 2036
- Automotive Electronics
- Industrial Motors
- Consumer Appliances
- Robotics
- Medical Devices
- Automotive Electronics
- Y-o-Y Growth Trend Analysis By End Use, 2021 to 2025
- Absolute $ Opportunity Analysis By End Use, 2026 to 2036
- Global Market Analysis and Forecast, By Sales Model, 2021 to 2036
- Introduction / Key Findings
- Historical Market Size Value (USD Million) & Volume (Unit) Analysis By Sales Model, 2021 to 2025
- Current and Future Market Size Value (USD Million) & Volume (Unit) Analysis and Forecast By Sales Model, 2026 to 2036
- Custom PCB Assembly
- Standard Board Supply
- Sensor Module Bundled
- Custom PCB Assembly
- Y-o-Y Growth Trend Analysis By Sales Model, 2021 to 2025
- Absolute $ Opportunity Analysis By Sales Model, 2026 to 2036
- Global Market Analysis and Forecast, By Region, 2021 to 2036
- Introduction
- Historical Market Size Value (USD Million) & Volume (Unit) Analysis By Region, 2021 to 2025
- Current Market Size Value (USD Million) & Volume (Unit) Analysis and Forecast By Region, 2026 to 2036
- North America
- Latin America
- Western Europe
- Eastern Europe
- East Asia
- South Asia and Pacific
- Middle East & Africa
- Market Attractiveness Analysis By Region
- North America Market Analysis and Forecast, By Country, 2021 to 2036
- Historical Market Size Value (USD Million) & Volume (Unit) Trend Analysis By Market Taxonomy, 2021 to 2025
- Market Size Value (USD Million) & Volume (Unit) Forecast By Market Taxonomy, 2026 to 2036
- By Country
- USA
- Canada
- By Board Type
- By Sensor Output
- By Application
- By End Use
- By Sales Model
- By Country
- Market Attractiveness Analysis
- By Country
- By Board Type
- By Sensor Output
- By Application
- By End Use
- By Sales Model
- Key Takeaways
- Latin America Market Analysis and Forecast, By Country
- Historical Market Size Value (USD Million) & Volume (Unit) Trend Analysis By Market Taxonomy, 2021 to 2025
- Market Size Value (USD Million) & Volume (Unit) Forecast By Market Taxonomy, 2026 to 2036
- By Country
- Brazil
- Mexico
- Chile
- Rest of Latin America
- By Board Type
- By Sensor Output
- By Application
- By End Use
- By Sales Model
- By Country
- Market Attractiveness Analysis
- By Country
- By Board Type
- By Sensor Output
- By Application
- By End Use
- By Sales Model
- Key Takeaways
- Western Europe Market Analysis and Forecast, By Country
- Historical Market Size Value (USD Million) & Volume (Unit) Trend Analysis By Market Taxonomy, 2021 to 2025
- Market Size Value (USD Million) & Volume (Unit) Forecast By Market Taxonomy, 2026 to 2036
- By Country
- Germany
- UK
- Italy
- Spain
- France
- Nordic
- BENELUX
- Rest of Western Europe
- By Board Type
- By Sensor Output
- By Application
- By End Use
- By Sales Model
- By Country
- Market Attractiveness Analysis
- By Country
- By Board Type
- By Sensor Output
- By Application
- By End Use
- By Sales Model
- Key Takeaways
- Eastern Europe Market Analysis and Forecast, By Country
- Historical Market Size Value (USD Million) & Volume (Unit) Trend Analysis By Market Taxonomy, 2021 to 2025
- Market Size Value (USD Million) & Volume (Unit) Forecast By Market Taxonomy, 2026 to 2036
- By Country
- Russia
- Poland
- Hungary
- Balkan & Baltic
- Rest of Eastern Europe
- By Board Type
- By Sensor Output
- By Application
- By End Use
- By Sales Model
- By Country
- Market Attractiveness Analysis
- By Country
- By Board Type
- By Sensor Output
- By Application
- By End Use
- By Sales Model
- Key Takeaways
- East Asia Market Analysis and Forecast, By Country
- Historical Market Size Value (USD Million) & Volume (Unit) Trend Analysis By Market Taxonomy, 2021 to 2025
- Market Size Value (USD Million) & Volume (Unit) Forecast By Market Taxonomy, 2026 to 2036
- By Country
- China
- Japan
- South Korea
- By Board Type
- By Sensor Output
- By Application
- By End Use
- By Sales Model
- By Country
- Market Attractiveness Analysis
- By Country
- By Board Type
- By Sensor Output
- By Application
- By End Use
- By Sales Model
- Key Takeaways
- South Asia and Pacific Market Analysis and Forecast, By Country
- Historical Market Size Value (USD Million) & Volume (Unit) Trend Analysis By Market Taxonomy, 2021 to 2025
- Market Size Value (USD Million) & Volume (Unit) Forecast By Market Taxonomy, 2026 to 2036
- By Country
- India
- ASEAN
- Australia & New Zealand
- Rest of South Asia and Pacific
- By Board Type
- By Sensor Output
- By Application
- By End Use
- By Sales Model
- By Country
- Market Attractiveness Analysis
- By Country
- By Board Type
- By Sensor Output
- By Application
- By End Use
- By Sales Model
- Key Takeaways
- Middle East & Africa Market Analysis and Forecast, By Country
- Historical Market Size Value (USD Million) & Volume (Unit) Trend Analysis By Market Taxonomy, 2021 to 2025
- Market Size Value (USD Million) & Volume (Unit) Forecast By Market Taxonomy, 2026 to 2036
- By Country
- Kingdom of Saudi Arabia
- Other GCC Countries
- Türkiye
- South Africa
- Other African Union
- Rest of Middle East & Africa
- By Board Type
- By Sensor Output
- By Application
- By End Use
- By Sales Model
- By Country
- Market Attractiveness Analysis
- By Country
- By Board Type
- By Sensor Output
- By Application
- By End Use
- By Sales Model
- Key Takeaways
- Key Countries Market Analysis
- USA
- Pricing Analysis
- Market Share Analysis, 2025
- By Board Type
- By Sensor Output
- By Application
- By End Use
- By Sales Model
- Canada
- Pricing Analysis
- Market Share Analysis, 2025
- By Board Type
- By Sensor Output
- By Application
- By End Use
- By Sales Model
- Mexico
- Pricing Analysis
- Market Share Analysis, 2025
- By Board Type
- By Sensor Output
- By Application
- By End Use
- By Sales Model
- Brazil
- Pricing Analysis
- Market Share Analysis, 2025
- By Board Type
- By Sensor Output
- By Application
- By End Use
- By Sales Model
- Chile
- Pricing Analysis
- Market Share Analysis, 2025
- By Board Type
- By Sensor Output
- By Application
- By End Use
- By Sales Model
- Germany
- Pricing Analysis
- Market Share Analysis, 2025
- By Board Type
- By Sensor Output
- By Application
- By End Use
- By Sales Model
- UK
- Pricing Analysis
- Market Share Analysis, 2025
- By Board Type
- By Sensor Output
- By Application
- By End Use
- By Sales Model
- Italy
- Pricing Analysis
- Market Share Analysis, 2025
- By Board Type
- By Sensor Output
- By Application
- By End Use
- By Sales Model
- Spain
- Pricing Analysis
- Market Share Analysis, 2025
- By Board Type
- By Sensor Output
- By Application
- By End Use
- By Sales Model
- France
- Pricing Analysis
- Market Share Analysis, 2025
- By Board Type
- By Sensor Output
- By Application
- By End Use
- By Sales Model
- India
- Pricing Analysis
- Market Share Analysis, 2025
- By Board Type
- By Sensor Output
- By Application
- By End Use
- By Sales Model
- ASEAN
- Pricing Analysis
- Market Share Analysis, 2025
- By Board Type
- By Sensor Output
- By Application
- By End Use
- By Sales Model
- Australia & New Zealand
- Pricing Analysis
- Market Share Analysis, 2025
- By Board Type
- By Sensor Output
- By Application
- By End Use
- By Sales Model
- China
- Pricing Analysis
- Market Share Analysis, 2025
- By Board Type
- By Sensor Output
- By Application
- By End Use
- By Sales Model
- Japan
- Pricing Analysis
- Market Share Analysis, 2025
- By Board Type
- By Sensor Output
- By Application
- By End Use
- By Sales Model
- South Korea
- Pricing Analysis
- Market Share Analysis, 2025
- By Board Type
- By Sensor Output
- By Application
- By End Use
- By Sales Model
- Russia
- Pricing Analysis
- Market Share Analysis, 2025
- By Board Type
- By Sensor Output
- By Application
- By End Use
- By Sales Model
- Poland
- Pricing Analysis
- Market Share Analysis, 2025
- By Board Type
- By Sensor Output
- By Application
- By End Use
- By Sales Model
- Hungary
- Pricing Analysis
- Market Share Analysis, 2025
- By Board Type
- By Sensor Output
- By Application
- By End Use
- By Sales Model
- Kingdom of Saudi Arabia
- Pricing Analysis
- Market Share Analysis, 2025
- By Board Type
- By Sensor Output
- By Application
- By End Use
- By Sales Model
- Türkiye
- Pricing Analysis
- Market Share Analysis, 2025
- By Board Type
- By Sensor Output
- By Application
- By End Use
- By Sales Model
- South Africa
- Pricing Analysis
- Market Share Analysis, 2025
- By Board Type
- By Sensor Output
- By Application
- By End Use
- By Sales Model
- USA
- Market Structure Analysis
- Competition Dashboard
- Competition Benchmarking
- Market Share Analysis of Top Players
- By Regional
- By Board Type
- By Sensor Output
- By Application
- By End Use
- By Sales Model
- Emerging Startups
- Innovation Benchmarking
- Competition Analysis
- Competition Deep Dive
- Infineon
- Overview
- Product Portfolio
- Profitability by Market Segments (Product/Region/Sales Channel)
- Sales Footprint
- Strategy Overview
- Marketing Strategy
- Product Strategy
- Channel Strategy
- Allegro MicroSystems
- Texas Instruments
- Melexis
- TDK Micronas
- Honeywell
- Diodes Incorporated
- Monolithic Power Systems
- Sensitec
- NXP Semiconductors
- Infineon
- Case Studies
- Success Stories
- Recent Developments
- Competition Deep Dive
- Assumptions & Acronyms Used


