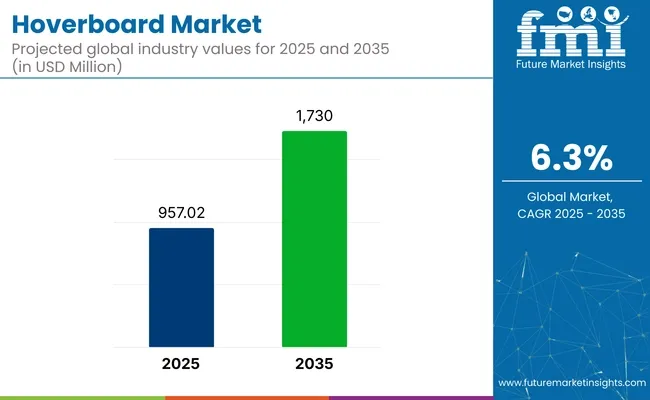
The global hoverboard market is anticipated to witness steady growth, progressing from USD 957.02 million in 2025 to USD 1.73 billion by 2035, registering a CAGR of 6.3%. This surge is driven by increasing urbanization, a growing preference for eco-friendly short-distance commuting solutions, and the popularity of recreational personal mobility devices among youth and adults alike. The compact design, ease of use, and affordability make hoverboards a favored choice for last-mile connectivity in urban centers.
| Attribute | Detail |
|---|---|
| Industry Size (2025E) | USD 957.02 million |
| Industry Size (2035F) | USD 1.73 billion |
| CAGR (2025 to 2035) | 6.3% |
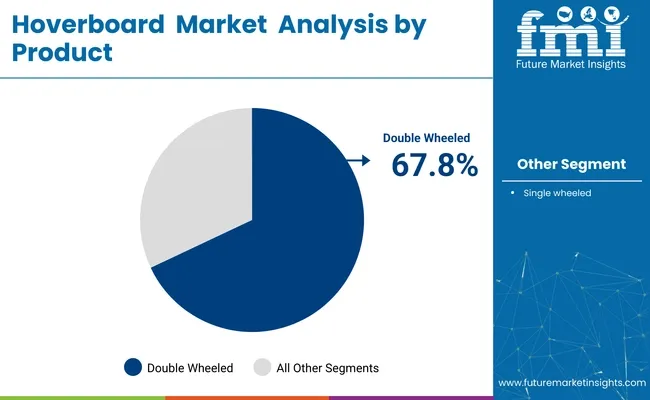
Among product types,double wheeled hoverboards are forecasted to dominate the market, securing a 67.8% share in 2025. These hoverboards offer superior stability, control, and balance, making them ideal for beginners and casual users. They are widely preferred in personal and commercial applications, especially for tourism and entertainment sectors where ease of operation is essential.
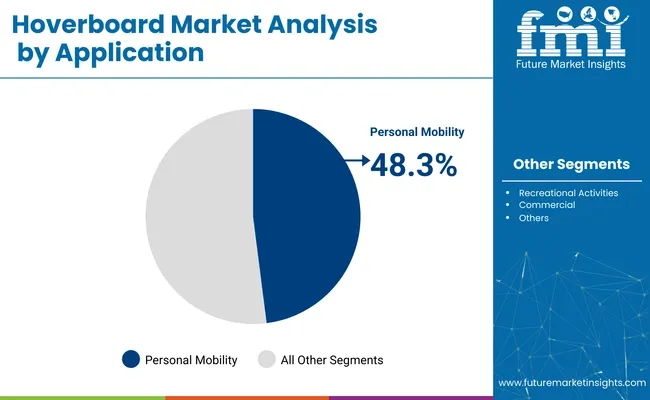
On the basis of application, Personal Mobility is set to hold a leading market share of 48.3% in 2025. Increasing consumer inclination towards fun, fitness, and eco-friendly commuting options is fueling the demand for hoverboards for individual use, especially in metro cities and tech-savvy regions.
A significant industry development took place in February 2025, when the New South Wales (NSW) Government mandated new safety certification requirements for hoverboards, e-scooters, and e-skateboards to ensure enhanced consumer protection against fire hazards and battery failures.
SGS, an accredited testing and certification body under AS/NZS ISO/IEC 17065, was officially authorized to conduct testing services in accordance with standards like UL 2272 and AS/NZS 60335.2.114.
All hoverboards sold in NSW must now carry the SGS approval mark to comply with these rigorous safety norms. This regulatory update was validated through official announcements by SGS and NSW government regulatory bodies, signaling a pivotal shift towards stricter safety standards in the hoverboard market.
Regionally, North America and Europe continue to remain significant markets due to rising demand for sustainable transport alternatives and higher purchasing power. However, Asia Pacific is anticipated to exhibit the fastest growth, driven by expanding urban populations, increased awareness of green commuting, and government incentives for eco-friendly transportation.
Leading market players such as Swagtron, Razor USA LLC, Segway Inc., Halo Board, and Hover-1are focusing on enhancing product features, battery life, and safety standards to attract a broader consumer base and solidify their market presence.
In 2025, the double wheeled hoverboard segment is anticipated to dominate with a 67.8% market share, as it offers better stability and ease of use for consumers. In terms of application, Personal Mobility is expected to lead, capturing a 48.3% share in 2025, due to its growing popularity among urban commuters and tech-savvy users.
The double wheeled segment is forecast to hold a commanding 67.8% share of the global market in 2025, reflecting strong consumer preference for products that offer better balance, ease of operation, and enhanced safety. Double-wheeled models remain the top choice for beginners and casual riders, as they reduce the learning curve and ensure a smoother riding experience compared to single-wheeled designs.
Growing use in personal transport and recreational activities, combined with innovations like built-in speakers, LED lighting, and smartphone app connectivity, further drives demand. Manufacturers focus on durability, battery life, and intelligent self-balancing features to meet rising customer expectations.
The personal mobility segment is expected to lead the market with a 48.3% share in 2025, fueled by the surge in demand for eco-friendly and cost-effective last-mile transportation solutions. Hoverboards are increasingly adopted by students, office goers, and city commuters as an alternative to traditional modes of travel in congested urban spaces.
Compact size, portability, and ease of parking make hoverboards suitable for short-distance travel. The growing trend of smart cities and the integration of IoT features into personal mobility devices further boosts this segment's growth potential. Brands are introducing customizable designs and safety certifications to attract wider consumer adoption.
The compact size segment is expected to capture a 30% share of the hoverboard market in 2025. These models are favored for their portability, making them highly attractive for urban commuters who need a lightweight, easy-to-carry device for short-distance travel. The growing trend towards sustainable transportation solutions in urban environments has led to an increased preference for compact hoverboards.
Additionally, their ability to easily fit into small spaces, such as office corners or public transportation, enhances their appeal. With continuous innovation in battery technology and foldable designs, compact-size hoverboards are becoming the go-to choice for tech-savvy commuters seeking a hassle-free mode of transport.
The hoverboard market is evolving rapidly due to the growing focus on personal mobility, environmental concerns, and technological innovations. Manufacturers are emphasizing safety features and smart connectivity to meet changing consumer expectations.
Rising Adoption of Hoverboards for Personal Urban Mobility
A strong preference for eco-friendly and compact personal transport solutions has been witnessed in urban regions. Younger consumers are opting for hoverboards to address last-mile connectivity needs. Brands like Swagtron and Segway-Ninebot have introduced models with Bluetooth and app-based controls to enhance user experience.
Hoverboards are replacing short-distance commuting options like bicycles and scooters in many cities. Consumer awareness regarding sustainable mobility is increasing. Urban congestion problems are being addressed through the adoption of hoverboards. Fashion-conscious youth and technology enthusiasts are driving the market forward. Companies are expanding product ranges to include lightweight and foldable designs suited for daily commutes.
Technological Advancements Enhancing Hoverboard Safety and Performance
Technological integration in hoverboards is improving safety and ride efficiency. Leading brands are using gyroscopic stabilizers and smart sensors to ensure balance and control. Battery safety has become a focus area after past fire incidents reported globally. Certification standards such as UL 2272 are being mandated for product reliability.
Brands like Razor and Xiaomi are investing in enhanced battery management systems. Features like GPS tracking and mobile diagnostics are being added to premium models. These innovations are reducing maintenance needs and increasing user trust. Manufacturers are also developing water-resistant and all-terrain variants to cater to outdoor enthusiasts and adventure seekers.
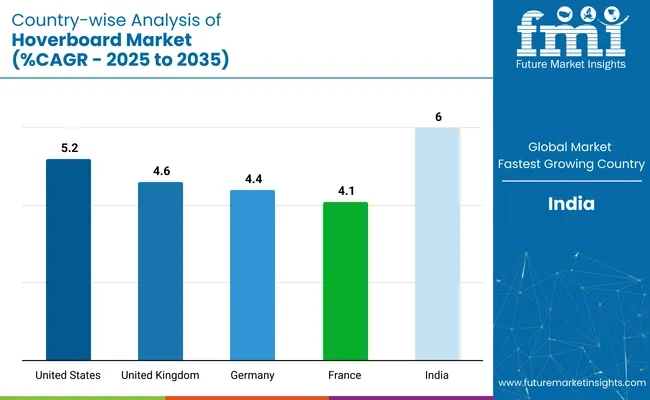
The global hoverboard market reveals major regional trends, with the United States leading in revenue and India showing fastest growth potential. The table below presents projected CAGRs for the top five countries.
| Countries | CAGR (2025 to 2035) |
|---|---|
| United States | 5.2% |
| United Kingdom | 4.6% |
| Germany | 4.4% |
| France | 4.1% |
| India | 6.0% |
The United States leads the global hoverboard market with a projected CAGR of 5.2% during 2025 to 2035. This growth is driven by the rising popularity of personal mobility devices among urban commuters and technology enthusiasts. Advanced safety features, such as gyroscopic stabilization, fire-resistant batteries, and app connectivity, are increasingly integrated into products.
Major manufacturers like Razor USA, Segway-Ninebot, and Swagtron dominate the market by offering differentiated models targeting various consumer segments, including children, teenagers, and young adults. The market also benefits from e-commerce platforms that offer a vast product range with competitive pricing and warranty services.
The United Kingdom hoverboard market is poised for steady growth at a CAGR of 4.6%.Factors contributing to this rise include the UK's growing interest in sustainable transportation solutions and the popularity of recreational outdoor gadgets.
Regulatory relaxations concerning electric personal transport devices in certain cities have encouraged trial adoption among youth and working professionals. British brands and retailers such as Hoverzon and Hover-1 have introduced models with enhanced safety certifications, waterproof designs, and energy-efficient batteries, catering to the eco-aware urban population seeking smart commuting options.
Hoverboard market in germany is projected to expand at a CAGR of 4.4%. Manufacturing reputation of the country for precision engineering has fostered demand for hoverboards with advanced control systems and durability features. Stringent EU regulations regarding battery safety and product certification ensure consumer confidence in product quality.
German companies are emphasizing research into self-balancing technologies and AI-assisted navigation systems to appeal to tech-savvy consumers. The preference for locally manufactured and certified devices enhances market growth in metropolitan regions such as Berlin and Munich.
Hoverboard sales in France are growing at a CAGR of 4.1%, driven by the product's rising adoption among the youth for leisure and short-distance commuting. French consumers display a strong inclination toward trendy designs and lightweight models suitable for urban environments. Brands are leveraging this preference by offering customizable hoverboards in varied color schemes and patterns.
The integration of Bluetooth speakers and mobile app connectivity appeals to the tech-oriented younger demographic. Government urban mobility initiatives encouraging electric transport adoption further support market expansion.
India stands out as the fastest-growing hoverboard market, registering a projected CAGR of 6.0%. Expanding middle-class population in the country and growing awareness of alternative urban transport solutions are fueling demand. Local manufacturers and importers offer affordable hoverboards tailored to the needs of price-conscious consumers.
The rise of smart cities and government efforts to promote electric mobility have created opportunities for both domestic and international brands to introduce entry-level and mid-range products. High adoption rates among teenagers and college students in metropolitan cities such as Mumbai, Bangalore, and Delhi contribute to the market's rapid expansion.
The global hoverboard market is considered fragmented, marked by the presence of numerous international and regional manufacturers offering varied product lines. Tier 1 companies like Ninebot, Inc. and Segway, Inc. dominate with advanced technological integration, strong brand equity, and adherence to international safety standards.
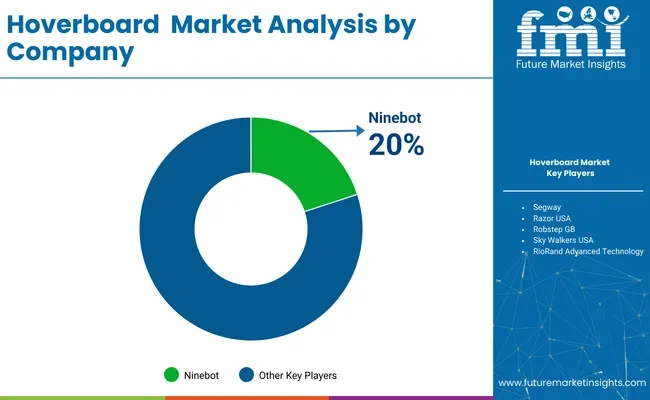
Meanwhile, Tier 2 and Tier 3 players such as Razor USA, Hangzhou Chic Intelligent Technology Co. Ltd., and IPS Electric Unicycle Co. cater to cost-sensitive markets with affordable and customized solutions. The industry’s fragmented nature encourages innovation in app connectivity, portability, and off-road performance as companies seek to capture niche segments and diversify their consumer base.
Recent Hoverboard Industry News
| Report Attributes | Details |
|---|---|
| Market Size (2025E) | USD 957.02 million |
| Projected Market Size (2035F) | USD 1.73 billion |
| CAGR (2025 to 2035) | 6.3% |
| Base Year for Estimation | 2024 |
| Historical Period | 2020 to 2024 |
| Projection Period | 2025 to 2035 |
| Quantitative Units | USD million/billion for value & thousand units for volume |
| By Product (Segment 1) | Double Wheeled, Single Wheeled |
| By Size (Segment 2) | Compact Size, Mid-Size, Full-Size |
| By Application (Segment 3) | Personal Mobility, Recreational Activities, Commercial, Others |
| Regions Covered | North America, Latin America, Europe, Asia-Pacific, Middle East & Africa |
| Countries Covered | United States, Canada, Germany, UK, France, China, India, Japan, South Korea, ASEAN Countries, Brazil, Mexico, GCC Countries, South Africa |
| Key Players Influencing the Market | Ninebot, Inc., Segway, Inc., Razor USA, Hangzhou Chic Intelligent Technology Co. Ltd., RioRand Advanced Technology, Evoy Technologies, Sky Walkers USA, Robstep GB, IPS Electric Unicycle Co., Shenzhen Lezway Technology |
| Additional Attributes | Dollar sales, share, battery capacity trends, compact size preference in urban areas, innovations in self-balancing technology, rising demand for recreational applications |
Thehoverboard market is segmented by product into double wheeled and single wheeled.
By size, the market includes compact size, mid-size, and full-size hoverboards.
By application, the market covers personal mobility, recreational activities, commercial, and others.
By geography, the market is categorized into North America, Latin America, Europe, Asia Pacific, and Middle and East Africa.
The Hoverboard Market is projected to reach USD 1.73 billion by 2035.
The market is expected to expand at a CAGR of 6.3% during the forecast period.
Growing urbanization, increasing inclination towards recreational mobility devices, and rising demand for eco-friendly personal transport are the key factors driving market growth.
Leading companies include Ninebot, Inc., Segway, Inc., Razor USA, Hangzhou Chic Intelligent Technology Co. Ltd., RioRand Advanced Technology, Evoy Technologies, Sky Walkers USA, Robstep GB, IPS Electric Unicycle Co., and Shenzhen Lezway Technology.
North America is projected to dominate due to higher disposable income, adoption of smart mobility solutions, and supportive infrastructure for personal transport devices.


Our Research Products

The "Full Research Suite" delivers actionable market intel, deep dives on markets or technologies, so clients act faster, cut risk, and unlock growth.

The Leaderboard benchmarks and ranks top vendors, classifying them as Established Leaders, Leading Challengers, or Disruptors & Challengers.

Locates where complements amplify value and substitutes erode it, forecasting net impact by horizon

We deliver granular, decision-grade intel: market sizing, 5-year forecasts, pricing, adoption, usage, revenue, and operational KPIs—plus competitor tracking, regulation, and value chains—across 60 countries broadly.

Spot the shifts before they hit your P&L. We track inflection points, adoption curves, pricing moves, and ecosystem plays to show where demand is heading, why it is changing, and what to do next across high-growth markets and disruptive tech

Real-time reads of user behavior. We track shifting priorities, perceptions of today’s and next-gen services, and provider experience, then pace how fast tech moves from trial to adoption, blending buyer, consumer, and channel inputs with social signals (#WhySwitch, #UX).

Partner with our analyst team to build a custom report designed around your business priorities. From analysing market trends to assessing competitors or crafting bespoke datasets, we tailor insights to your needs.
Supplier Intelligence
Discovery & Profiling
Capacity & Footprint
Performance & Risk
Compliance & Governance
Commercial Readiness
Who Supplies Whom
Scorecards & Shortlists
Playbooks & Docs
Category Intelligence
Definition & Scope
Demand & Use Cases
Cost Drivers
Market Structure
Supply Chain Map
Trade & Policy
Operating Norms
Deliverables
Buyer Intelligence
Account Basics
Spend & Scope
Procurement Model
Vendor Requirements
Terms & Policies
Entry Strategy
Pain Points & Triggers
Outputs
Pricing Analysis
Benchmarks
Trends
Should-Cost
Indexation
Landed Cost
Commercial Terms
Deliverables
Brand Analysis
Positioning & Value Prop
Share & Presence
Customer Evidence
Go-to-Market
Digital & Reputation
Compliance & Trust
KPIs & Gaps
Outputs
Full Research Suite comprises of:
Market outlook & trends analysis
Interviews & case studies
Strategic recommendations
Vendor profiles & capabilities analysis
5-year forecasts
8 regions and 60+ country-level data splits
Market segment data splits
12 months of continuous data updates
DELIVERED AS:
PDF EXCEL ONLINE

Thank you!
You will receive an email from our Business Development Manager. Please be sure to check your SPAM/JUNK folder too.
Chat With
MaRIA