Global Mini Cranes Market
A Detailed Analysis of the Global Mini Cranes Market Based on Spider Cranes, Crawler Cranes, and Pick and Carry Cranes
The Rise of Mini Cranes- Why are Compact and Versatile Material Handling Solutions Gaining Wider Traction across the United States, Italy, France, Korea, Japan, the United Kingdom, and 30+ Countries! Find Out in FMI's Report!
Global Mini Cranes Market Outlook (2023 to 2033)
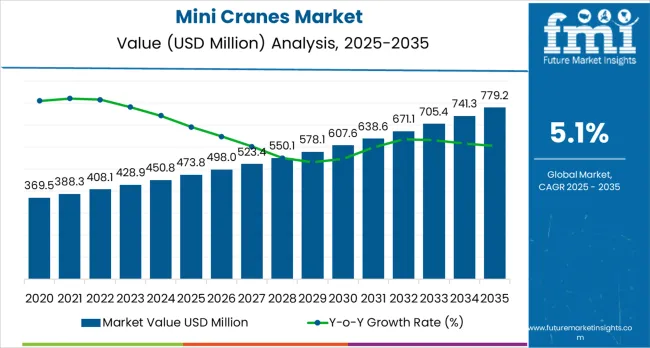
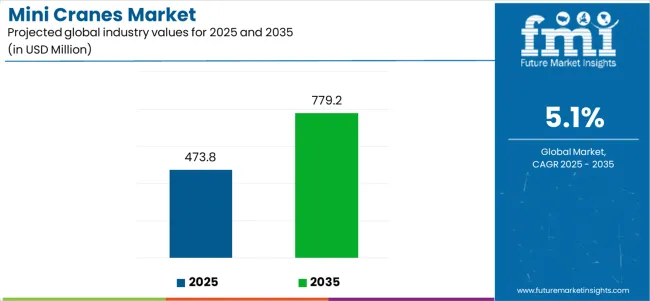
The global mini cranes market size is projected to be worth US$ 422.2 million in 2023. Over the next ten years (2023 to 2033), global mini crane sales are projected to soar at 6.0% CAGR. By 2033, the market is likely to surpass a valuation of US$ 761 million.
In 2022, the worldwide mini crane industry was valued at US$ 399.8 million. A positive growth trajectory has been predicted by Future Market Insights (FMI) for the target market. This is due to notable industrialization in emerging and established nations.
Mini cranes have emerged as the best solution for construction industry to lift lightweight as well as heavy materials. These versatile material handling solutions can easily lift and move objects or materials in hard-to-access areas.
Mini cranes are compact and feature a small footprint and minimal tail swing. They have the potential to perform various functions in the most demanding places. That’s why they are becoming the epitome of ‘less is more’ in the contemporary construction sector.
The ability of mini cranes to perform smoothing in challenging terrains and limited working spaces will fuel their demand globally during the assessment period.
Mini cranes can work in very different places and confined spaces such as slopes, stairs, and difficult-to-reach places. They have become suitable material handling solutions in remote locations where big cranes would not fit.
Growing usage of mini cranes for construction & renovation, infrastructure development work, and industrial maintenance will boost the global market.
Demand for mini cranes will be driven by increasing number of public infrastructure projects. Governments throughout the world are committed to developing and expanding public infrastructure. As a result, they are launching new projects, bills, and smart city initiatives. This is expected to uplift mini crane demand.
For instance, recently America President Joe Biden signed a US$ 1 trillion infrastructure bill to create new jobs, rebuild roads, airports, rails, and bridges, provide high-speed internet access, and address climate concerns.
Similarly, ‘Make in India’ scheme and numerous construction projects in sectors such as energy, roadways, and railways were launched by the Indian government. These new developments will continue to create a conducive environment for the expansion of the mini cranes industry.
Gradual shift towards electric-powered or battery-powered mini cranes will further boost the global market during the assessment period.
To expand their customer base and solidify their position in the market, companies are launching innovative material handling solutions with advanced features. For instance, in 2021 lithium-powered SPX1280 mini crane was introduced by Jekko.
The new SPX1280 model is ideal for material lifting and handling applications and features high-performance and low environmental impact.
In October 2022, Jekko launched SPX328 battery-powered, remote-controlled mini crane that offers a smooth user experience. The new mini crane requires minimum training and is more user-friendly.
Development of such innovative and advanced mini cranes is expected to boost the global market during the next ten years.
Attributes | Key Insights |
---|---|
Estimated Global Mini Cranes Market Size (2023) |
US$ 422.2 million |
Projected Global Mini Cranes Market Value (2033) |
US$ 761 million |
Value CAGR (2023 to 2033) |
6% |
Don't pay for what you don't need
Customize your report by selecting specific countries or regions and save 30%!
Other Drivers Propelling Demand for Global Mini Cranes and Boosting the Market
- Increasing demand for compact and versatile equipment in construction sector due to space and transit concerns are set to boost mini crane sales
- Integration of advanced technologies and focus on safety features will propel market expansion
- Growing demand for high-efficiency mini cranes due to their low maintenance cost, high collection efficiency, and low operating cost will bode well for the market
- Increasing popularity of spider cranes for glazing and cladding jobs to create lucrative opportunities for manufacturers
Challenges for Companies/Manufacturers in the Global Mini Cranes Industry
- Reduced stability of mini cranes due to their smaller size and footprint is limiting market expansion
- Mini cranes are more expensive to purchase or rent compared to larger cranes or alternative lifting equipment which is reducing their demand
- Limited reach and height during intense construction activities is likely to restrain the mini cranes industry.
Opportunities in the Global Mini Cranes Industry
The ongoing trend of urbanization and infrastructure development presents significant opportunities for mini cranes. As cities expand and undergo renovations, there is a growing need for lifting equipment that can efficiently operate within the constraints of urban environments.
The rental market for mini cranes is expanding as contractors and businesses seek cost-effective solutions for short-term projects or specific lifting needs which provides significant opportunities.
The adoption of digital technologies such as IoT, AI, and automation in mini cranes provides investment opportunities for companies to enhance their product offerings and improve operational efficiency.
The increasing focus on sustainable development and environmental protection presents investment opportunities for companies that provide eco-friendly mini cranes to their customers.
Latest Trends in the Global Mini Cranes Market
- Increasing usage of compact and versatile lifting solutions for urban and specific purposes is boosting the global market.
- Eco-friendly and sustainable designs of electric models to encourage adoption of mini cranes.
- Increasing popularity of rental mini cranes will support market expansion.
Get the data you need at a Fraction of the cost
Personalize your report by choosing insights you need
and save 40%!
2018 to 2022 Global Mini Cranes Sales Outlook Compared to Demand Forecast from 2023 to 2033
From 2018 to 2022, global sales of mini cranes grew at a CAGR of 4.8%, reaching a market size of US$ 422.2 million in 2023. Looking ahead, the global mini cranes industry is expected to rise at a CAGR of 6% from 2023 to 2033. Total market size is expected to reach US$ 761 million at the end of 2033.
Rising demand for mini cranes from sectors such as construction, logistics, industrial, etc. is a prominent factor driving the global market.
Mini cranes are gaining wider popularity due to their ability to work in compact spaces across various sectors. They perform a wide variety of applications ranging from lifting objects to moving them. Growing usage of mini cranes will continue to boost the global market through 2033.
Rising urbanization and industrialization will also continue to play a key role in uplifting mini crane demand globally.
The ongoing trend of urbanization and infrastructure development presents significant opportunities for mini cranes. As cities expand and undergo renovations, there is a growing need for lifting equipment that can efficiently operate within the constraints of urban environments.
The rental market for mini cranes is expanding as contractors and businesses seek cost-effective solutions for short-term projects or specific lifting needs which provides significant opportunities.
The adoption of digital technologies such as IoT, AI, and automation in mini cranes provides investment opportunities for companies to enhance their product offerings and improve operational efficiency.
The increasing focus on sustainable development and environmental protection presents investment opportunities for companies that provide eco-friendly mini cranes to their customers.
However, market growth may be hindered by the emergence of alternative technologies and the high installation and maintenance costs associated with advanced mini cranes.
Comparative View of Adjacent Markets
Crane Motors Market:
Attributes | Crane Motors Market |
---|---|
CAGR (2023 to 2033) |
7.2% |
Market Value (2023) |
US$ 30,000 million |
Growth Factor |
Increasing construction projects and industrial activities is expected to boost the global crane motors market. |
Key Trend |
Growing popularity of electric and hybrid cranes to elevate crane motor demand. |
Mobile Cranes Market:
Attributes | Mobile Cranes Market |
---|---|
CAGR (2023 to 2033) |
6.0% |
Market Value (2023) |
US$ 16,112 million |
Growth Factor |
Booming construction sector coupled with rising demand for novel construction equipment is expected to drive the mobile cranes market. |
Key Trend |
Development of novel mobile cranes integrated with advanced technologies such as GPS will boost the market. |
Country-wise Insights
What is Spurring Growth in the United States Mini Cranes Market?
Increasing Infrastructure Development Boosting the United States Mini Cranes Industry
Country | Market Size (US$ million) by End of Forecast Period (2033) |
---|---|
United States |
US$ 138.6 million |
Country | CAGR from 2023 to End of Forecast (2033) |
---|---|
United States |
6.5% |
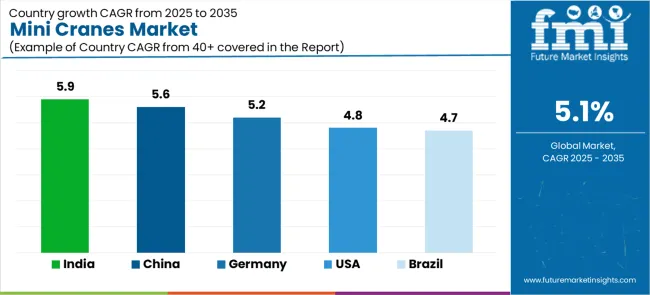
The United States mini cranes industry is expected to reach a valuation of US$ 138.6 million by 2033. Over the projection period (2023 to 2033), sales of mini cranes in the United States are likely to rise at 6.5% CAGR.
The industrial and manufacturing sectors in the United States are fueling demand for mini cranes. Manufacturing facilities, warehouses, and industrial plants often require mini cranes for various tasks. This includes equipment installation, maintenance, and material handling within confined spaces.
Other factors expected to drive demand for mini cranes in the country include:
- Rapid Infrastructural Development:
Infrastructure development and maintenance play a significant role in driving demand for mini cranes. The United States government has shown a commitment to investing in infrastructure projects, such as road and bridge construction, airport expansions, and energy sector developments.
The infrastructural projects often require the use of mini cranes for efficient and precise lifting and positioning of heavy materials and equipment. Hence, increasing infrastructural development in the United States will shoot up mini crane sales.
- Adoption of Advanced Technologies in Mini Cranes:
The United States is a hub for technological advancements, and the mini cranes industry is no exception. United States-based manufacturers and companies are continuously exploring and adopting new technologies to enhance the performance, safety, and efficiency of mini cranes.
For instance, they are incorporating innovations such as IoT integration, remote monitoring, automation, and advanced control systems. This will positively impact the market growth.
What is the Demand Outlook for China Mini Cranes Market?
Booming Manufacturing Sector to Elevate Mini Cranes Demand in China
Country | Market Size (US$ million) by End of Forecast Period (2033) |
---|---|
China |
US$ 32.4 million |
Country | CAGR from 2023 to End of Forecast (2033) |
---|---|
China |
5.6% |
China mini cranes industry is anticipated to exceed a valuation of US$ 32.4 million by 2033. Total demand for mini cranes in China market is likely to increase at 5.6% CAGR between 2023 and 2033.
Rapid growth of manufacturing sector and increasing demand for advanced material handling tools are key factors driving China market forward.
China's industrial sector is expanding rapidly, with manufacturing facilities, warehouses, and industrial plants requiring mini cranes for material handling and equipment installation.
Similarly, strong presence of leading mini crane manufacturers and availability of rented mini canes will boost China market.
What is Boosting Mini Crane Sales in Japan Market?
Increasing Adoption in Various Sectors Fueling Sales of Mini Cranes in Japan
Country | Market Size (US$ million) by End of Forecast Period (2033) |
---|---|
Japan |
US$ 37.6 million |
Country | CAGR from 2023 to End of Forecast (2033) |
---|---|
Japan |
6.1% |
According to Future Market Insights (FMI), Japan mini cranes market is forecast to thrive at a CAGR of 6.1% during the assessment period. By 2033, Japan market size is projected to reach US$ 37.6 million.
The market in Japan is predicted to expand because of the increasing adoption of mini cranes in various industries such as power generation, cement, and chemical manufacturing.
Japan has a well-developed construction sector that requires efficient lifting equipment for various tasks, including lifting heavy materials and machinery in confined spaces. Mini cranes provide the necessary lifting capabilities while being able to maneuver easily in tight areas.
Japan's aging infrastructure requires regular maintenance and repair work, which often involves lifting heavy loads in challenging locations. Mini cranes are particularly useful in these situations due to their compact size and ability to access narrow and difficult-to-reach areas.
Further, growing popularity of electric mini cranes is playing a key role in boosting sales in Japan market. Key manufacturers are therefore introducing new electric mini crane models to gain profits.
Category-wise Insights
Which is the Highly Sought-after Mini Crane Type in the Global Market?
Spider Crane to Remain the Highly Sought-after Type Globally
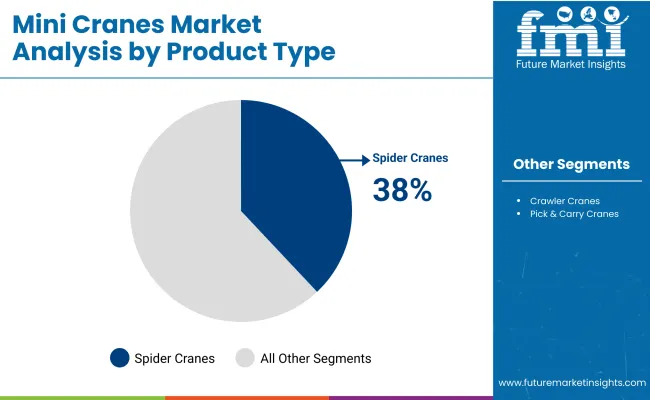
As per Future Market Insights (FMI), demand is expected to remain high for spider cranes globally. The target segment is expected to thrive at a CAGR of 6.3% from 2023 to 2033. This is due to various benefits of spider cranes including their cost-effectiveness, high efficiency, low maintenance requirements, and ability to work in extreme conditions.
The spider crane segment has been witnessing significant growth in recent years, driven by various factors. These include increased construction and infrastructure development activities, growing demand for compact lifting solutions, and a focus on safety and efficiency in lifting operations.
Spider cranes, also known as compact cranes or mini-crawler cranes, are specialized lifting machines designed for operation in confined spaces and on rough or uneven terrain. They derive their name from their spider-like appearance, with multiple legs or tracks that provide stability and maneuverability.
Spider cranes are especially beneficial in urban areas where space is limited and larger cranes may not be practical or feasible. They are more versatile and their outriggers are constructed in such a manner that they can stabilize the device when performing on uneven or rough grounds.
The ability of spider cranes to travel over challenging surfaces and perform in confined spaces & compact areas will fuel their demand. This in turn will help spider crane manufacturers to improve their revenues.
Which End-use Sector is Likely to Create Lucrative Opportunities for Mini Crane Manufacturers?
Construction Sector to Create Lucrative Growth Prospects for Mini Crane Manufacturers and Suppliers
The construction sector is expected to dominate the global mini cranes industry during the forecast period. It is forecast to exhibit a CAGR of 6.1% from 20223 to 2033, creating lucrative opportunities for mini crane manufacturers. This is due to rising usage of mini cranes in various construction applications.
Mini cranes are particularly useful in construction projects that involve working in confined spaces or at elevated heights. They have become ideal equipment for workers at construction sites to move and lift objects, improve human safety, and reduce need for workers.
Increasing construction activities globally coupled with growing popularity of smart cities is expected to elevate mini crane demand during the assessment period.
How Key Players Stay Competitive in the Global Mini Cranes Industry?
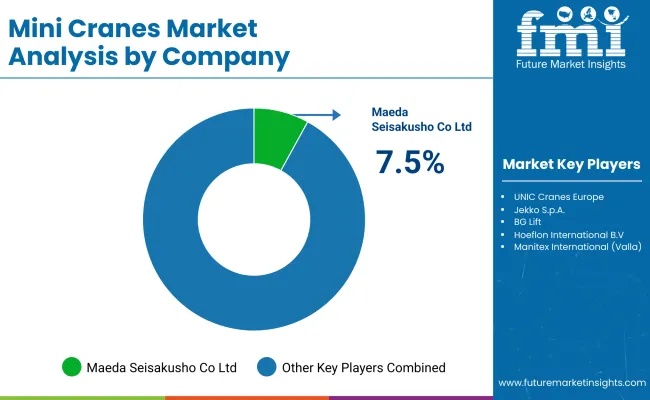
The global mini cranes industry is highly competitive, with numerous players concentrating on improving their market share. In such a scenario, key manufacturers of mini cranes must adopt effective strategies to stay ahead of the competition.
Key Strategies Adopted by the Players
- Product Innovation
Companies are heavily investing in research and development to design innovative products with improved features. Product innovation enables companies to differentiate themselves from their competitors and cater to the evolving needs of customers.
- Strategic Partnerships and Collaborations
Key mini crane manufacturing companies often form strategic partnerships and collaborations with other companies to leverage their strengths and expand their reach in the market. Such collaborations also allow companies to gain access to new technologies and markets.
- Expansion into Emerging Markets
The global mini cranes industry is witnessing significant growth in emerging markets such as China and India. Key players are expanding their presence in these markets by establishing local manufacturing facilities and strengthening their distribution networks.
- Mergers and Acquisitions
Key players often engage in mergers and acquisitions to strengthen their market position, expand their product portfolio, and gain access to new markets.
Key Players in the Global Mini Cranes Industry
- Jekko SRL
- MAEDA SEISAKUSHO CO., Ltd.
- UNIC-Furukawa Company Ltd.
- Manitex International, Inc. (Valla)
- Hoeflon International B.V.
- Linamar
- Microcranes, Inc.
- R&B Engineering
Key Developments:
- In November 2021, Maeda Seisakusho Ltd. launched the second edition of their earth-friendly mini crane, a fully electric spider crane powered by lithium-ion batteries. It is named the MC305CB-3.
- In November 2021, MAEDA in collaboration with DEUTZ AG unveiled a prototype of a fully-electric crawler crane CC1485. The new crane is powered by lithium-ion batteries.
- In May 2022, Maeda Seisakusho Co., Ltd. announced the establishment of North American subsidiary, MAEDA AMERICA Inc. in Texas, USA. This expansion will help the company strengthen its position in the regional as well as global markets.
- In April 2022, Jekko expanded in Denmark, signing a dealership agreement with Stiholt Hydraulic.
Global Mini Cranes Market Segmentation
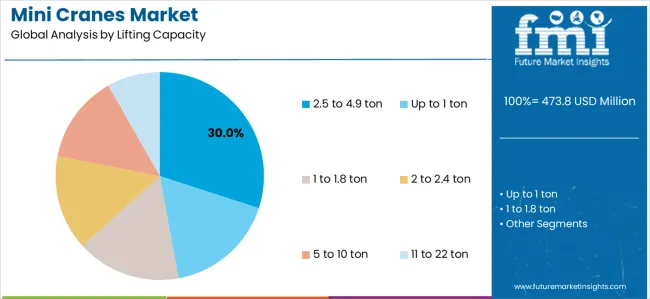
By Lifting Capacity:
- Up to 1 ton
- 1 to 1.8 ton
- 2 to 2.4 ton
- 2.5 to 4.9 ton
- 5 to 10 ton
- 11 to 22 ton
By Type:
- Spider Crane
- Crawler Crane
- Articulated
- Telescopic
- Pick and Carry Cranes
By Operation:
- Fuel Operated
- Battery Operated
By End Use Sector:
- Industrial
- Foundries
- Power Plants
- Others
- Railway Depots
- Construction
- Residential & Commercial
- Industrial
- Civic Infrastructure
- Facility Management
- Commercial
- Industrial
- Marine
- Timber and Lumber
- Material handling and logistics
By Ownership:
- Direct Owned
- OEM Sales
- Dealership Sales
- Rented
By Region:
- North America
- Latin America
- Europe
- East Asia
- South Asia
- Oceania
- The Middle East & Africa
Frequently Asked Questions
How big was the global market for mini cranes in 2022?
The global market for mini cranes was valued at US$ 399.8 million in 2022.
What is the current worth of the global mini cranes market?
The global mini cranes market value is expected to reach US$ 422.2 million by 2023.
At what CAGR is global demand for mini cranes expected to rise between 2023 and 2033?
Global mini cranes demand is set to increase at 6.0% CAGR during the assessment period.
What is the predicted valuation of the global mini cranes industry by 2033?
The worldwide mini cranes industry is predicted to exceed US$ 761 million by 2033.
Which end-use sector holds a notable share of the global mini cranes industry?
The construction sector is projected to hold a dominant share of the market.
Which is the highly profitable market for mini crane manufacturers?
The United States market is expected to create lucrative opportunities for mini crane companies.
What is the current size of the mini cranes industry in East Asia?
East Asia mini cranes industry is expected to hit a value of US$ 65.2 million by 2023.
Table of Content
1. Executive Summary 1.1. Global Market Outlook 1.2. Demand Side Trends 1.3. Supply Side Trends 1.4. Technology Roadmap 1.5. Analysis and Recommendations 2. Market Overview 2.1. Market Coverage / Taxonomy 2.2. Market Definition / Scope / Limitations 3. Key Market Trends 3.1. Key Trends Impacting the Market 3.2. Product Innovation / Development Trends 4. Key Success Factors 4.1. Product Adoption / Usage Analysis 4.2. Product USP’s / Features 4.3. Strategic Promotional Strategies 5. Global Market Demand Analysis 2018 to 2022 and Forecast, 2023 to 2033 5.1. Historical Market Volume (Tons) Analysis, 2018 to 2022 5.2. Current and Future Market Volume (Tons) Projections, 2023 to 2033 5.3. Y-o-Y Growth Trend Analysis 6. Global Market - Pricing Analysis 6.1. Regional Pricing Analysis By Lifting Capacity 6.2. Global Average Pricing Analysis Benchmark 7. Global Market Demand (in Value or Size in US$ Million) Analysis 2018 to 2022 and Forecast, 2023 to 2033 7.1. Historical Market Value (US$ Million) Analysis, 2018 to 2022 7.2. Current and Future Market Value (US$ Million) Projections, 2023 to 2033 7.2.1. Y-o-Y Growth Trend Analysis 7.2.2. Absolute $ Opportunity Analysis 8. Market Background 8.1. Macro-Economic Factors 8.1.1. Global GDP Growth Outlook 8.1.2. Global Chemical industry Overview 8.1.3. Manufacturing Value-Added 8.1.4. Industry Value Added 8.1.5. Parent Market Outlook 8.1.6. Other Macro-Economic Factors 8.2. Forecast Factors - Relevance & Impact 8.2.1. Top Companies Historical Growth 8.2.2. GDP Growth forecast 8.2.3. Manufacturing Industry forecast 8.2.4. Global Urbanization Growth Outlook 8.2.5. Business Climate 8.2.6. Covid-19 Impact Assessment 8.2.7. End-use Industry Growth Outlook 8.3. Value Chain 8.3.1. Product Manufacturers 8.3.2. End Users 8.3.3. Avg. Profitability Margins 8.4. COVID-19 Crisis – Impact Assessment 8.4.1. Current Statistics 8.4.2. Short-Mid-Long Term Outlook 8.4.3. Likely Rebound 8.5. Market Dynamics 8.5.1. Drivers 8.5.2. Restraints 8.5.3. Opportunity Analysis 8.6. Global Supply Demand Analysis 8.7. Key Regulations & Certifications 8.8. Production Process Overview 8.9. Trade Scenario 9. Global Market Analysis 2018 to 2022 and Forecast 2023 to 2033, By Lifting Capacity 9.1. Introduction / Key Findings 9.2. Historical Market Size (US$ Million) and Volume Analysis By Lifting Capacity, 2018 to 2022 9.3. Current and Future Market Size (US$ Million) and Volume Analysis and Forecast By Lifting Capacity, 2023 to 2033 9.3.1. Up to 1 ton 9.3.2. 1 to 1.8 ton 9.3.3. 2 to 2.4 ton 9.3.4. 2.5 to 4.9 ton 9.3.5. 5 to 10 ton 9.3.6. 11 to 22 ton 9.4. Market Attractiveness Analysis By Lifting Capacity 10. Global Market Analysis 2018 to 2022 and Forecast 2023 to 2033, By Type 10.1. Introduction / Key Findings 10.2. Historical Market Size (US$ Million) and Volume Analysis By Type, 2018 to 2022 10.3. Current and Future Market Size (US$ Million) and Volume Analysis and Forecast By Type, 2023 to 2033 10.3.1. Spider Crane 10.3.2. Crawler Crane 10.3.2.1. Articulated 10.3.2.2. Telescopic 10.3.3. Pick and Carry Cranes 10.4. Market Attractiveness Analysis By Type 11. Global Market Analysis 2018 to 2022 and Forecast 2023 to 2033, By Operation 11.1. Introduction / Key Findings 11.2. Historical Market Size (US$ Million) and Volume Analysis By Operation, 2018 to 2022 11.3. Current and Future Market Size (US$ Million) and Volume Analysis and Forecast By Operation, 2023 to 2033 11.3.1. Fuel Operated 11.3.2. Battery Operated 11.4. Market Attractiveness Analysis By Operation 12. Global Market Analysis 2018 to 2022 and Forecast 2023 to 2033, By End Use Sector 12.1. Introduction / Key Findings 12.2. Historical Market Size (US$ Million) and Volume Analysis By End Use Sector, 2018 to 2022 12.3. Current and Future Market Size (US$ Million) and Volume Analysis and Forecast By End Use Sector, 2023 to 2033 12.3.1. Industrial 12.3.1.1. Foundries 12.3.1.2. Power Plants 12.3.1.3. Others 12.3.2. Railway Depots 12.3.3. Construction 12.3.3.1. Residential and Commercial 12.3.3.2. Industrial 12.3.3.3. Civic Infrastructure 12.3.4. Facility Management 12.3.4.1. Commercial 12.3.4.2. Industrial 12.3.5. Marine 12.3.6. Timber and Lumber 12.3.7. Material Handling and Logistics 12.4. Market Attractiveness Analysis By End Use Sector 13. Global Market Analysis 2018 to 2022 and Forecast 2023 to 2033, By Ownership 13.1. Introduction / Key Findings 13.2. Historical Market Size (US$ Million) and Volume Analysis By Ownership, 2018 to 2022 13.3. Current and Future Market Size (US$ Million) and Volume Analysis and Forecast By Ownership, 2023 to 2033 13.3.1. Direct Owned 13.3.1.1. Direct 13.3.1.2. Dealers 13.3.2. Rented 13.4. Market Attractiveness Analysis By Ownership 14. Global Market Analysis 2018 to 2022 and Forecast 2023 to 2033, by Region 14.1. Introduction 14.2. Historical Market Size (US$ Million) and Volume Analysis By Region, 2018 to 2022 14.3. Current Market Size (US$ Million) and Volume Analysis and Forecast By Region, 2023 to 2033 14.3.1. North America 14.3.2. Latin America 14.3.3. Europe 14.3.4. Middle East and Africa 14.3.5. East Asia 14.3.6. South Asia and Pacific 14.4. Market Attractiveness Analysis By Region 15. North America Market Analysis 2018 to 2022 and Forecast 2023 to 2033 15.1. Introduction 15.2. Pricing Analysis 15.3. Historical Market Size (US$ Million) and Volume Trend Analysis By Market Taxonomy, 2018 to 2022 15.4. Market Size (US$ Million) and Volume Forecast By Market Taxonomy, 2023 to 2033 15.4.1. By Country 15.4.1.1. United States 15.4.1.2. Canada 15.4.2. By Lifting Capacity 15.4.3. By Type 15.4.4. By Operation 15.4.5. By End Use Sector 15.4.6. By Ownership 15.5. Market Attractiveness Analysis 15.5.1. By Country 15.5.2. By Lifting Capacity 15.5.3. By Type 15.5.4. By Operation 15.5.5. By End Use Sector 15.5.6. By Ownership 15.6. Market Trends 15.7. Key Market Participants - Intensity Mapping 15.8. Drivers and Restraints - Impact Analysis 16. Latin America Market Analysis 2018 to 2022 and Forecast 2023 to 2033 16.1. Introduction 16.2. Pricing Analysis 16.3. Historical Market Size (US$ Million) and Volume Trend Analysis By Market Taxonomy, 2018 to 2022 16.4. Market Size (US$ Million) and Volume Forecast By Market Taxonomy, 2023 to 2033 16.4.1. By Country 16.4.1.1. Brazil 16.4.1.2. Mexico 16.4.1.3. Rest of Latin America 16.4.2. By Lifting Capacity 16.4.3. By Type 16.4.4. By Operation 16.4.5. By End Use Sector 16.4.6. By Ownership 16.5. Market Attractiveness Analysis 16.5.1. By Country 16.5.2. By Lifting Capacity 16.5.3. By Type 16.5.4. By Operation 16.5.5. By End Use Sector 16.5.6. By Ownership 16.6. Market Trends 16.7. Key Market Participants - Intensity Mapping 16.8. Drivers and Restraints - Impact Analysis 17. Europe Market Analysis 2018 to 2022 and Forecast 2023 to 2033 17.1. Introduction 17.2. Pricing Analysis 17.3. Historical Market Size (US$ Million) and Volume Trend Analysis By Market Taxonomy, 2018 to 2022 17.4. Market Size (US$ Million) and Volume Forecast By Market Taxonomy, 2023 to 2033 17.4.1. By Country 17.4.1.1. Germany 17.4.1.2. Italy 17.4.1.3. France 17.4.1.4. United Kingdom 17.4.1.5. Spain 17.4.1.6. BENELUX 17.4.1.7. Russia 17.4.1.8. Rest of EU 17.4.2. By Lifting Capacity 17.4.3. By Type 17.4.4. By Operation 17.4.5. By End Use Sector 17.4.6. By Ownership 17.5. Market Attractiveness Analysis 17.5.1. By Country 17.5.2. By Lifting Capacity 17.5.3. By Type 17.5.4. By Operation 17.5.5. By End Use Sector 17.5.6. By Ownership 17.6. Market Trends 17.7. Key Market Participants - Intensity Mapping 17.8. Drivers and Restraints - Impact Analysis 18. South Asia and Pacific Market Analysis 2018 to 2022 and Forecast 2023 to 2033 18.1. Introduction 18.2. Pricing Analysis 18.3. Historical Market Size (US$ Million) and Volume Trend Analysis By Market Taxonomy, 2018 to 2022 18.4. Market Size (US$ Million) and Volume Forecast By Market Taxonomy, 2023 to 2033 18.4.1. By Country 18.4.1.1. India 18.4.1.2. ASEAN 18.4.1.3. ANZ 18.4.1.4. Rest of South Asia & Pacific 18.4.2. By Lifting Capacity 18.4.3. By Type 18.4.4. By Operation 18.4.5. By End Use Sector 18.4.6. By Ownership 18.5. Market Attractiveness Analysis 18.5.1. By Country 18.5.2. By Lifting Capacity 18.5.3. By Type 18.5.4. By Operation 18.5.5. By End Use Sector 18.5.6. By Ownership 18.6. Market Trends 18.7. Key Market Participants - Intensity Mapping 18.8. Drivers and Restraints - Impact Analysis 19. East Asia Market Analysis 2018 to 2022 and Forecast 2023 to 2033 19.1. Introduction 19.2. Pricing Analysis 19.3. Historical Market Size (US$ Million) and Volume Trend Analysis By Market Taxonomy, 2018 to 2022 19.4. Market Size (US$ Million) and Volume Forecast By Market Taxonomy, 2023 to 2033 19.4.1. By Country 19.4.1.1. China 19.4.1.2. Japan 19.4.1.3. South Korea 19.4.2. By Lifting Capacity 19.4.3. By Type 19.4.4. By Operation 19.4.5. By End Use Sector 19.4.6. By Ownership 19.5. Market Attractiveness Analysis 19.5.1. By Country 19.5.2. By Lifting Capacity 19.5.3. By Type 19.5.4. By Operation 19.5.5. By End Use Sector 19.5.6. By Ownership 19.6. Market Trends 19.7. Key Market Participants - Intensity Mapping 19.8. Drivers and Restraints - Impact Analysis 20. Middle East and Africa Market Analysis 2018 to 2022 and Forecast 2023 to 2033 20.1. Introduction 20.2. Pricing Analysis 20.3. Historical Market Size (US$ Million) and Volume Trend Analysis By Market Taxonomy, 2018 to 2022 20.4. Market Size (US$ Million) and Volume Forecast By Market Taxonomy, 2023 to 2033 20.4.1. By Country 20.4.1.1. GCC Countries 20.4.1.2. Türkiye 20.4.1.3. Northern Africa 20.4.1.4. South Africa 20.4.1.5. Rest of Middle East and Africa 20.4.2. By Lifting Capacity 20.4.3. By Type 20.4.4. By Operation 20.4.5. By End Use Sector 20.4.6. By Ownership 20.5. Market Attractiveness Analysis 20.5.1. By Country 20.5.2. By Lifting Capacity 20.5.3. By Type 20.5.4. By Operation 20.5.5. By End Use Sector 20.5.6. By Ownership 20.6. Market Trends 20.7. Key Market Participants - Intensity Mapping 20.8. Drivers and Restraints - Impact Analysis 21. Country-wise Market Analysis 21.1. Introduction 21.1.1. Market Value Proportion Analysis, By Key Countries 21.1.2. Global Vs. Country Growth Comparison 21.2. United States Market Analysis 21.2.1. By Lifting Capacity 21.2.2. By Type 21.2.3. By Operation 21.2.4. By End Use Sector 21.2.5. By Ownership 21.3. Canada Market Analysis 21.3.1. By Lifting Capacity 21.3.2. By Type 21.3.3. By Operation 21.3.4. By End Use Sector 21.3.5. By Ownership 21.4. Mexico Market Analysis 21.4.1. By Lifting Capacity 21.4.2. By Type 21.4.3. By Operation 21.4.4. By End Use Sector 21.4.5. By Ownership 21.5. Brazil Market Analysis 21.5.1. By Lifting Capacity 21.5.2. By Type 21.5.3. By Operation 21.5.4. By End Use Sector 21.5.5. By Ownership 21.6. Argentina Market Analysis 21.6.1. By Lifting Capacity 21.6.2. By Type 21.6.3. By Operation 21.6.4. By End Use Sector 21.6.5. By Ownership 21.7. Germany Market Analysis 21.7.1. By Lifting Capacity 21.7.2. By Type 21.7.3. By Operation 21.7.4. By End Use Sector 21.7.5. By Ownership 21.8. Italy Market Analysis 21.8.1. By Lifting Capacity 21.8.2. By Type 21.8.3. By Operation 21.8.4. By End Use Sector 21.8.5. By Ownership 21.9. France Market Analysis 21.9.1. By Lifting Capacity 21.9.2. By Type 21.9.3. By Operation 21.9.4. By End Use Sector 21.9.5. By Ownership 21.10. United Kingdom Market Analysis 21.10.1. By Lifting Capacity 21.10.2. By Type 21.10.3. By Operation 21.10.4. By End Use Sector 21.10.5. By Ownership 21.11. Spain Market Analysis 21.11.1. By Lifting Capacity 21.11.2. By Type 21.11.3. By Operation 21.11.4. By End Use Sector 21.11.5. By Ownership 21.12. NORDICS Market Analysis 21.12.1. By Lifting Capacity 21.12.2. By Type 21.12.3. By Operation 21.12.4. By End Use Sector 21.12.5. By Ownership 21.13. Poland Market Analysis 21.13.1. By Lifting Capacity 21.13.2. By Type 21.13.3. By Operation 21.13.4. By End Use Sector 21.13.5. By Ownership 21.14. Hungary Market Analysis 21.14.1. By Lifting Capacity 21.14.2. By Type 21.14.3. By Operation 21.14.4. By End Use Sector 21.14.5. By Ownership 21.15. Romania Market Analysis 21.15.1. By Lifting Capacity 21.15.2. By Type 21.15.3. By Operation 21.15.4. By End Use Sector 21.15.5. By Ownership 21.16. Czech Republic Market Analysis 21.16.1. By Lifting Capacity 21.16.2. By Type 21.16.3. By Operation 21.16.4. By End Use Sector 21.16.5. By Ownership 21.17. China Market Analysis 21.17.1. By Lifting Capacity 21.17.2. By Type 21.17.3. By Operation 21.17.4. By End Use Sector 21.17.5. By Ownership 21.18. Japan Market Analysis 21.18.1. By Lifting Capacity 21.18.2. By Type 21.18.3. By Operation 21.18.4. By End Use Sector 21.18.5. By Ownership 21.19. South Korea Market Analysis 21.19.1. By Lifting Capacity 21.19.2. By Type 21.19.3. By Operation 21.19.4. By End Use Sector 21.19.5. By Ownership 21.20. India Market Analysis 21.20.1. By Lifting Capacity 21.20.2. By Type 21.20.3. By Operation 21.20.4. By End Use Sector 21.20.5. By Ownership 21.21. ASEAN Market Analysis 21.21.1. By Lifting Capacity 21.21.2. By Type 21.21.3. By Operation 21.21.4. By End Use Sector 21.21.5. By Ownership 21.22. Australia and New Zealand Market Analysis 21.22.1. By Lifting Capacity 21.22.2. By Type 21.22.3. By Operation 21.22.4. By End Use Sector 21.22.5. By Ownership 21.23. KSA Market Analysis 21.23.1. By Lifting Capacity 21.23.2. By Type 21.23.3. By Operation 21.23.4. By End Use Sector 21.23.5. By Ownership 21.24. United Arab Emirates Market Analysis 21.24.1. By Lifting Capacity 21.24.2. By Type 21.24.3. By Operation 21.24.4. By End Use Sector 21.24.5. By Ownership 21.25. Northern Africa Market Analysis 21.25.1. By Lifting Capacity 21.25.2. By Type 21.25.3. By Operation 21.25.4. By End Use Sector 21.25.5. By Ownership 21.26. Turkiye Market Analysis 21.26.1. By Lifting Capacity 21.26.2. By Type 21.26.3. By Operation 21.26.4. By End Use Sector 21.26.5. By Ownership 21.27. South Africa Market Analysis 21.27.1. By Lifting Capacity 21.27.2. By Type 21.27.3. By Operation 21.27.4. By End Use Sector 21.27.5. By Ownership 21.28. Israel Market Analysis 21.28.1. By Lifting Capacity 21.28.2. By Type 21.28.3. By Operation 21.28.4. By End Use Sector 21.28.5. By Ownership 22. Market Structure Analysis 22.1. Market Analysis by Tier of Companies 22.2. Market Concentration 22.3. Market Share Analysis of Top Players 22.4. Production Capacity Analysis 22.5. Market Presence Analysis 22.5.1. By Operation Footprint of Players 22.5.2. By Regional Footprint of Players 22.5.3. By Channel Footprint of Players 23. Competition Analysis 23.1. Competition Dashboard 23.2. Competition Benchmarking 23.3. Competition Deep Dive 23.3.1. Jekko SRL 23.3.1.1. Overview 23.3.1.2. Product Portfolio 23.3.1.3. Profitability by Market Segments (Type/Lifting Capacity/Operation/End Use Sector/Ownership/Region) 23.3.1.4. Sales Footprint 23.3.1.5. Strategy Overview 23.3.2. MAEDA SEISHAKUSHO CO., Ltd. 23.3.2.1. Overview 23.3.2.2. Product Portfolio 23.3.2.3. Profitability by Market Segments (Type/Lifting Capacity/Operation/End Use Sector/Ownership/Region) 23.3.2.4. Sales Footprint 23.3.2.5. Strategy Overview 23.3.3. UNIC-Furukawa Company Ltd. 23.3.3.1. Overview 23.3.3.2. Product Portfolio 23.3.3.3. Profitability by Market Segments (Type/Lifting Capacity/Operation/End Use Sector/Ownership/Region) 23.3.3.4. Sales Footprint 23.3.3.5. Strategy Overview 23.3.4. Manitex International, Inc. (Valla) 23.3.4.1. Overview 23.3.4.2. Product Portfolio 23.3.4.3. Profitability by Market Segments (Type/Lifting Capacity/Operation/End Use Sector/Ownership/Region) 23.3.4.4. Sales Footprint 23.3.4.5. Strategy Overview 23.3.5. Hoeflon International B.V. 23.3.5.1. Overview 23.3.5.2. Product Portfolio 23.3.5.3. Profitability by Market Segments (Type/Lifting Capacity/Operation/End Use Sector/Ownership/Region) 23.3.5.4. Sales Footprint 23.3.5.5. Strategy Overview 23.3.6. Linamar 23.3.6.1. Overview 23.3.6.2. Product Portfolio 23.3.6.3. Profitability by Market Segments (Type/Lifting Capacity/Operation/End Use Sector/Ownership/Region) 23.3.6.4. Sales Footprint 23.3.6.5. Strategy Overview 23.3.7. Microcranes, Inc. 23.3.7.1. Overview 23.3.7.2. Product Portfolio 23.3.7.3. Profitability by Market Segments (Type/Lifting Capacity/Operation/End Use Sector/Ownership/Region) 23.3.7.4. Sales Footprint 23.3.7.5. Strategy Overview 23.3.8. R&B Engineering 23.3.8.1. Overview 23.3.8.2. Product Portfolio 23.3.8.3. Profitability by Market Segments (Type/Lifting Capacity/Operation/End Use Sector/Ownership/Region) 23.3.8.4. Sales Footprint 23.3.8.5. Strategy Overview 24. Primary Insights 25. Assumptions and Acronyms Used 26. Research Methodology
Don't pay for what you don't need
Customize your report by selecting specific countries or regions and save 30%!
List of Tables
Table 01: Global Market Value (US$ Million) and Volume (Units) Historical Data 2018 to 2022 and Forecast 2023 to 2033 by Lifting Capacity Table 02: Global Market Value (US$ Million) and Volume (Units) Historical Data 2018 to 2022 and Forecast 2023 to 2033 By Type Table 03: Global Market Value (US$ Million) and Volume (Units) Historical Data 2018 to 2022 and Forecast 2023 to 2033 by Operation Table 04: Global Market Value (US$ Million) and Volume (Units) Historical Data 2018 to 2022 and Forecast 2023 to 2033 By End Use Sector Table 05: Global Market Value (US$ Million) and Volume (Units) Historical Data 2018 to 2022 and Forecast 2023 to 2033 By End Use Sector Table 06: Global Market Value (US$ Million) and Volume (Units) Historical Data 2018 to 2022 and Forecast 2023 to 2033 By Ownership Table 07: Global Market Value (US$ Million) and Volume (Units) Historical Data 2018 to 2022 and Forecast 2023 to 2033 By Region Table 08: North America Market Value (US$ Million) and Volume (Units) Historical Data 2018 to 2022 and Forecast 2023 to 2033 By Country Table 09: North America Market Value (US$ Million) and Volume (Units) Historical Data 2018 to 2022 and Forecast 2023 to 2033 by Lifting Capacity Table 10: North America Market Value (US$ Million) and Volume (Units) Historical Data 2018 to 2022 and Forecast 2023 to 2033 By Type Table 11: North America Market Value (US$ Million) and Volume (Units) Historical Data 2018 to 2022 and Forecast 2023 to 2033 by Operation Table 12: North America Market Value (US$ Million) and Volume (Units) Historical Data 2018 to 2022 and Forecast 2023 to 2033 By End Use Sector Table 13: North America Market Value (US$ Million) and Volume (Units) Historical Data 2018 to 2022 and Forecast 2023 to 2033 By End Use Sector Table 14: North America Market Value (US$ Million) and Volume (Units) Historical Data 2018 to 2022 and Forecast 2023 to 2033 By Ownership Table 15: Latin America Market Volume (Units) and Value (US$ Million) Historical Data 2018 to 2022 and Forecast 2023 to 2033 By Country Table 16: Latin America Market Value (US$ Million) and Volume (Units) Historical Data 2018 to 2022 and Forecast 2023 to 2033 by Lifting Capacity Table 17: Latin America Market Value (US$ Million) and Volume (Units) Historical Data 2018 to 2022 and Forecast 2023 to 2033 By Type Table 18: Latin America Market Value (US$ Million) and Volume (Units) Historical Data 2018 to 2022 and Forecast 2023 to 2033 by Operation Table 19: Latin America Market Value (US$ Million) and Volume (Units) Historical Data 2018 to 2022 and Forecast 2023 to 2033 By End Use Sector Table 20: Latin America Market Value (US$ Million) and Volume (Units) Historical Data 2018 to 2022 and Forecast 2023 to 2033 By End Use Sector Table 21: Latin America Market Value (US$ Million) and Volume (Units) Historical Data 2018 to 2022 and Forecast 2023 to 2033 By Ownership Table 22: Europe Market Value (US$ Million) and Volume (Units) Historical Data 2018 to 2022 and Forecast 2023 to 2033 By Country Table 23: Europe Market Value (US$ Million) and Volume (Units) Historical Data 2018 to 2022 and Forecast 2023 to 2033 by Lifting Capacity Table 24: Europe Market Value (US$ Million) and Volume (Units) Historical Data 2018 to 2022 and Forecast 2023 to 2033 By Type Table 25: Europe Market Value (US$ Million) and Volume (Units) Historical Data 2018 to 2022 and Forecast 2023 to 2033 by Operation Table 26: Europe Market Value (US$ Million) and Volume (Units) Historical Data 2018 to 2022 and Forecast 2023 to 2033 By End Use Sector Table 27: Europe Market Value (US$ Million) and Volume (Units) Historical Data 2018 to 2022 and Forecast 2023 to 2033 By End Use Sector Table 28: Europe Market Value (US$ Million) and Volume (Units) Historical Data 2018 to 2022 and Forecast 2023 to 2033 By Ownership Table 29: East Asia Market Value (US$ Million) and Volume (Units) Historical Data 2018 to 2022 and Forecast 2023 to 2033 By Country Table 30: East Asia Market Value (US$ Million) and Volume (Units) Historical Data 2018 to 2022 and Forecast 2023 to 2033 by Lifting Capacity Table 31: East Asia Market Value (US$ Million) and Volume (Units) Historical Data 2018 to 2022 and Forecast 2023 to 2033 By Type Table 32: East Asia Market Value (US$ Million) and Volume (Units) Historical Data 2018 to 2022 and Forecast 2023 to 2033 by Operation Table 33: East Asia Market Value (US$ Million) and Volume (Units) Historical Data 2018 to 2022 and Forecast 2023 to 2033 By End Use Sector Table 34: East Asia Market Value (US$ Million) and Volume (Units) Historical Data 2018 to 2022 and Forecast 2023 to 2033 By End Use Sector Table 35: East Asia Market Value (US$ Million) and Volume (Units) Historical Data 2018 to 2022 and Forecast 2023 to 2033 By Ownership Table 36: South Asia & Pacific Market Value (US$ Million) and Volume (Units) Historical Data 2018 to 2022 and Forecast 2023 to 2033 By Country Table 37: South Asia & Pacific Market Value (US$ Million) and Volume (Units) Historical Data 2018 to 2022 and Forecast 2023 to 2033 by Lifting Capacity Table 38: South Asia & Pacific Market Value (US$ Million) and Volume (Units) Historical Data 2018 to 2022 and Forecast 2023 to 2033 By Type Table 39: South Asia & Pacific Market Value (US$ Million) and Volume (Units) Historical Data 2018 to 2022 and Forecast 2023 to 2033 by Operation Table 40: South Asia & Pacific Market Value (US$ Million) and Volume (Units) Historical Data 2018 to 2022 and Forecast 2023 to 2033 By End Use Sector Table 41: South Asia & Pacific Market Value (US$ Million) and Volume (Units) Historical Data 2018 to 2022 and Forecast 2023 to 2033 By End Use Sector Table 42: South Asia & Pacific Market Value (US$ Million) and Volume (Units) Historical Data 2018 to 2022 and Forecast 2023 to 2033 By Ownership Table 43: Middle East & Africa Market Value (US$ Million) and Volume (Units) Historical Data 2018 to 2022 and Forecast 2023 to 2033 By Country Table 44: Middle East & Africa Market Value (US$ Million) and Volume (Units) Historical Data 2018 to 2022 and Forecast 2023 to 2033 by Lifting Capacity Table 45: Middle East & Africa Market Value (US$ Million) and Volume (Units) Historical Data 2018 to 2022 and Forecast 2023 to 2033 By Type Table 46: Middle East & Africa Market Value (US$ Million) and Volume (Units) Historical Data 2018 to 2022 and Forecast 2023 to 2033 by Operation Table 47: Middle East & Africa Market Value (US$ Million) and Volume (Units) Historical Data 2018 to 2022 and Forecast 2023 to 2033 By End Use Sector Table 48: Middle East & Africa Market Value (US$ Million) and Volume (Units) Historical Data 2018 to 2022 and Forecast 2023 to 2033 By End Use Sector Table 49: Middle East & Africa Market Value (US$ Million) and Volume (Units) Historical Data 2018 to 2022 and Forecast 2023 to 2033 By Ownership
List of Charts
Figure 01: Global Market Historical Volume (Units), 2018 to 2022 Figure 02: Global Market Volume (Units) Forecast, 2023 to 2033 Figure 03: Global Market Historical Value (US$ Million), 2018 to 2022 Figure 04: Global Market Value (US$ Million) Forecast, 2023 to 2033 Figure 05: Global Market Absolute $ Opportunity, 2023 to 2033 Figure 06: Global Market Share and BPS Analysis by Lifting Capacity– 2023 & 2033 Figure 07: Global Market Y-o-Y Growth Projections by Lifting Capacity, 2022 to 2033 Figure 08: Global Market Attractiveness by Lifting Capacity, 2023 to 2033 Figure 09: Global Market Absolute $ Opportunity, 2022 to 2033, by Up to 1 ton Figure 10: Global Market Absolute $ Opportunity, 2022 to 2033, by 1 to 1.8 ton segment Figure 11: Global Market Absolute $ Opportunity, 2022 to 2033, by 2 to 2.4 ton segment Figure 12: Global Market Absolute $ Opportunity, 2022 to 2033, by 2.5 to 4.9 ton segment Figure 13: Global Market Absolute $ Opportunity, 2022 to 2033, by 5 to 10 ton segment Figure 14: Global Market Absolute $ Opportunity, 2022 to 2033, by 11 to 22 ton Figure 15: Global Market Share and BPS Analysis By Type – 2023 & 2033 Figure 16: Global Market Y-o-Y Growth Projections By Type, 2022 to 2033 Figure 17: Global Market Attractiveness By Type, 2023 to 2033 Figure 18: Global Market Absolute $ Opportunity, 2022 to 2033, by Spider Crane Figure 19: Global Market Absolute $ Opportunity, 2022 to 2033, by Crawler Crane Figure 20: Global Market Absolute $ Opportunity, 2022 to 2033, by Pick and Carry Cranes Figure 21: Global Market Share and BPS Analysis by Operation– 2023 & 2033 Figure 22: Global Market Y-o-Y Growth Projections by Operation, 2022 to 2033 Figure 23: Global Market Attractiveness by Operation, 2023 to 2033 Figure 24: Global Market Absolute $ Opportunity 2022 to 2033, by Fuel Operated Figure 25: Global Market Absolute $ Opportunity 2022 to 2033, by Battery Operated Figure 26: Global Market Share and BPS Analysis By End Use Sector– 2023 & 2033 Figure 27: Global Market Y-o-Y Growth Projections By End Use Sector, 2022 to 2033 Figure 28: Global Market Attractiveness By End Use Sector, 2023 to 2033 Figure 29: Global Market Absolute $ Opportunity 2022 to 2033, by Industrial Figure 30: Global Market Absolute $ Opportunity 2022 to 2033, by Railway Depots Figure 31: Global Market Absolute $ Opportunity 2022 to 2033, by Construction Figure 32: Global Market Absolute $ Opportunity 2022 to 2033, by Facility Management Figure 33: Global Market Absolute $ Opportunity 2022 to 2033, by Marine Figure 34: Global Market Absolute $ Opportunity 2022 to 2033, by Timber & Lumber Figure 35: Global Market Absolute $ Opportunity, 2022 to 2033, by Material Handling & Logistics Figure 36: Global Market Share and BPS Analysis By Ownership– 2023 & 2033 Figure 37: Global Market Y-o-Y Growth Projections By Ownership, 2022 to 2033 Figure 38: Global Market Attractiveness By Ownership, 2023 to 2033 Figure 39: Global Market Absolute $ Opportunity 2022 to 2033, by Direct Owned Figure 40: Global Market Absolute $ Opportunity 2022 to 2033, by Rented Figure 41: Global Market Share and BPS Analysis By Region– 2023 & 2033 Figure 42: Global Market Y-o-Y Growth Projections By Region, 2022 to 2033 Figure 43: Global Market Attractiveness By Region, 2023 to 2033 Figure 44: North America Market Absolute $ Opportunity, 2022 to 2033 Figure 45: Latin America Market Absolute $ Opportunity, 2022 to 2033 Figure 46: Europe Market Absolute $ Opportunity, 2022 to 2033 Figure 47: East Asia Market Absolute $ Opportunity, 2022 to 2033 Figure 48: South Asia & Pacific Market Absolute $ Opportunity, 2022 to 2033 Figure 49: Middle East & Africa Market Absolute $ Opportunity, 2022 to 2033 Figure 50: North America Market Share and BPS Analysis by Country – 2023 & 2033 Figure 51: North America Market Y-o-Y Growth Projections by Country, 2022 to 2033 Figure 52: North America Market Attractiveness by Country, 2023 to 2033 Figure 53: North America Market Share and BPS Analysis by Lifting Capacity– 2023 & 2033 Figure 54: North America Market Y-o-Y Growth Projections by Lifting Capacity, 2022 to 2033 Figure 55: North America Market Attractiveness by Lifting Capacity, 2023 to 2033 Figure 56: North America Market Share and BPS Analysis By Type – 2023 & 2033 Figure 57: North America Market Y-o-Y Growth Projections By Type, 2022 to 2033 Figure 58: North America Market Attractiveness By Type, 2023 to 2033 Figure 59: North America Market Share and BPS Analysis by Operation– 2023 & 2033 Figure 60: North America Market Y-o-Y Growth Projections by Operation, 2022 to 2033 Figure 61: North America Market Attractiveness by Operation, 2023 to 2033 Figure 62: North America Market Share and BPS Analysis By End Use Sector– 2023 & 2033 Figure 63: North America Market Y-o-Y Growth Projections By End Use Sector, 2022 to 2033 Figure 64: North America Market Attractiveness By End Use Sector, 2023 to 2033 Figure 65: North America Market Share and BPS Analysis By Ownership– 2023 & 2033 Figure 66: North America Market Y-o-Y Growth Projections By Ownership, 2022 to 2033 Figure 67: North America Market Attractiveness By Ownership, 2023 to 2033 Figure 68: Latin America Market Share and BPS Analysis by Country – 2023 & 2033 Figure 69: Latin America Market Y-o-Y Growth Projections by Country, 2022 to 2033 Figure 70: Latin America Market Attractiveness by Country, 2023 to 2033 Figure 71: Latin America Market Share and BPS Analysis by Lifting Capacity– 2023 & 2033 Figure 72: Latin America Market Y-o-Y Growth Projections by Lifting Capacity, 2022 to 2033 Figure 73: Latin America Market Attractiveness by Lifting Capacity, 2023 to 2033 Figure 74: Latin America Market Share and BPS Analysis By Type – 2023 & 2033 Figure 75: Latin America Market Y-o-Y Growth Projections By Type, 2022 to 2033 Figure 76: Latin America Market Attractiveness By Type, 2023 to 2033 Figure 77: Latin America Market Share and BPS Analysis by Operation– 2023 & 2033 Figure 78: Latin America Market Y-o-Y Growth Projections by Operation, 2022 to 2033 Figure 79: Latin America Market Attractiveness by Operation, 2023 to 2033 Figure 80: Latin America Market Share and BPS Analysis By End Use Sector– 2023 & 2033 Figure 81: Latin America Market Y-o-Y Growth Projections By End Use Sector, 2022 to 2033 Figure 82: Latin America Market Attractiveness By End Use Sector, 2023 to 2033 Figure 83: Latin America Market Share and BPS Analysis By Ownership– 2023 & 2033 Figure 84: Latin America Market Y-o-Y Growth Projections By Ownership, 2022 to 2033 Figure 85: Latin America Market Attractiveness By Ownership, 2023 to 2033 Figure 86: Europe Market Share and BPS Analysis by Country – 2023 & 2033 Figure 87: Europe Market Y-o-Y Growth Projections by Country, 2022 to 2033 Figure 88: Europe Market Attractiveness by Country, 2023 to 2033 Figure 89: Europe Market Share and BPS Analysis by Lifting Capacity– 2023 & 2033 Figure 90: Europe Market Y-o-Y Growth Projections by Lifting Capacity, 2022 to 2033 Figure 91: Europe Market Attractiveness by Lifting Capacity, 2023 to 2033 Figure 92: Europe Market Share and BPS Analysis By Type – 2023 & 2033 Figure 93: Europe Market Y-o-Y Growth Projections By Type, 2022 to 2033 Figure 94: Europe Market Attractiveness By Type, 2023 to 2033 Figure 95: Europe Market Share and BPS Analysis by Operation– 2023 & 2033 Figure 96: Europe Market Y-o-Y Growth Projections by Operation, 2023 to 2033 Figure 97: Europe Market Attractiveness by Operation, 2023 to 2033 Figure 98: Europe Market Share and BPS Analysis By End Use Sector– 2023 & 2033 Figure 99: Europe Market Y-o-Y Growth Projections By End Use Sector, 2022 to 2033 Figure 100: Europe Market Attractiveness By End Use Sector, 2023 to 2033 Figure 101: Europe Market Share and BPS Analysis By Ownership– 2023 & 2033 Figure 102: Europe Market Y-o-Y Growth Projections By Ownership, 2022 to 2033 Figure 103: Europe Market Attractiveness By Ownership, 2023 to 2033 Figure 104: East Asia Market Share and BPS Analysis by Country – 2023 & 2033 Figure 105: East Asia Market Y-o-Y Growth Projections by Country, 2022 to 2033 Figure 106: East Asia Market Attractiveness by Country, 2023 to 2033 Figure 107: East Asia Market Share and BPS Analysis by Lifting Capacity– 2023 & 2033 Figure 108: East Asia Market Y-o-Y Growth Projections by Lifting Capacity, 2022 to 2033 Figure 109: East Asia Market Attractiveness by Lifting Capacity, 2023 to 2033 Figure 110: East Asia Market Share and BPS Analysis By Type – 2023 & 2033 Figure 111: East Asia Market Y-o-Y Growth Projections By Type, 2022 to 2033 Figure 112: East Asia Market Attractiveness By Type, 2023 to 2033 Figure 113: East Asia Market Share and BPS Analysis by Operation– 2023 & 2033 Figure 114: East Asia Market Y-o-Y Growth Projections by Operation, 2022 to 2033 Figure 115: East Asia Market Attractiveness by Operation, 2023 to 2033 Figure 116: East Asia Market Share and BPS Analysis By End Use Sector– 2023 & 2033 Figure 117: East Asia Market Y-o-Y Growth Projections By End Use Sector, 2022 to 2033 Figure 118: East Asia Market Attractiveness By End Use Sector, 2023 to 2033 Figure 119: East Asia Market Share and BPS Analysis By Ownership– 2023 & 2033 Figure 120: East Asia Market Y-o-Y Growth Projections By Ownership, 2022 to 2033 Figure 121: East Asia Market Attractiveness By Ownership, 2023 to 2033 Figure 122: South Asia & Pacific Market Share and BPS Analysis by Country – 2023 & 2033 Figure 123: South Asia & Pacific Market Y-o-Y Growth Projections by Country, 2022 to 2033 Figure 124: South Asia & Pacific Market Attractiveness by Country, 2023 to 2033 Figure 125: South Asia & Pacific Market Share and BPS Analysis by Lifting Capacity– 2023 & 2033 Figure 126: South Asia & Pacific Market Y-o-Y Growth Projections by Lifting Capacity, 2022 to 2033 Figure 127: South Asia & Pacific Market Attractiveness by Lifting Capacity, 2023 to 2033 Figure 128: South Asia & Pacific Market Share and BPS Analysis By Type – 2023 & 2033 Figure 129: South Asia & Pacific Market Y-o-Y Growth Projections By Type, 2022 to 2033 Figure 130: South Asia & Pacific Market Attractiveness By Type, 2023 to 2033 Figure 131: South Asia & Pacific Market Share and BPS Analysis by Operation– 2023 & 2033 Figure 132: South Asia & Pacific Market Y-o-Y Growth Projections by Operation, 2022 to 2033 Figure 133: South Asia & Pacific Market Attractiveness by Operation, 2023 to 2033 Figure 134: South Asia & Pacific Market Share and BPS Analysis By End Use Sector– 2023 & 2033 Figure 135: South Asia & Pacific Market Y-o-Y Growth Projections By End Use Sector, 2022 to 2033 Figure 136: South Asia & Pacific Market Attractiveness By End Use Sector, 2023 to 2033 Figure 137: South Asia & Pacific Market Share and BPS Analysis By Ownership– 2023 & 2033 Figure 138: South Asia & Pacific Market Y-o-Y Growth Projections By Ownership, 2022 to 2033 Figure 139: South Asia & Pacific Market Attractiveness By Ownership, 2023 to 2033 Figure 140: Middle East & Africa Market Share and BPS Analysis by Country– 2023 & 2033 Figure 141: Middle East & Africa Market Y-o-Y Growth Projections by Country, 2022 to 2033 Figure 142: Middle East & Africa Market Attractiveness by Country, 2023 to 2033 Figure 143: Middle East & Africa Market Share and BPS Analysis by Lifting Capacity– 2023 & 2033 Figure 144: Middle East & Africa Market Y-o-Y Growth Projections by Lifting Capacity, 2022 to 2033 Figure 145: Middle East & Africa Market Attractiveness by Lifting Capacity, 2023 to 2033 Figure 146: Middle East & Africa Market Share and BPS Analysis By Type – 2023 & 2033 Figure 147: Middle East & Africa Market Y-o-Y Growth Projections By Type, 2022 to 2033 Figure 148: Middle East & Africa Market Attractiveness By Type, 2023 to 2033 Figure 149: Middle East & Africa Market Share and BPS Analysis by Operation– 2023 & 2033 Figure 150: Middle East & Africa Market Y-o-Y Growth Projections by Operation, 2022 to 2033 Figure 151: Middle East & Africa Market Attractiveness by Operation, 2023 to 2033 Figure 152: Middle East & Africa Market Share and BPS Analysis By End Use Sector– 2023 & 2033 Figure 153: Middle East & Africa Market Y-o-Y Growth Projections By End Use Sector, 2022 to 2033 Figure 154: Middle East & Africa Market Attractiveness By End Use Sector, 2023 to 2033 Figure 155: Middle East & Africa Market Share and BPS Analysis By Ownership– 2023 & 2033 Figure 156: Middle East & Africa Market Y-o-Y Growth Projections By Ownership, 2022 to 2033 Figure 157: Middle East & Africa Market Attractiveness By Ownership, 2023 to 2033
Explore Industrial Automation Insights
View Reports