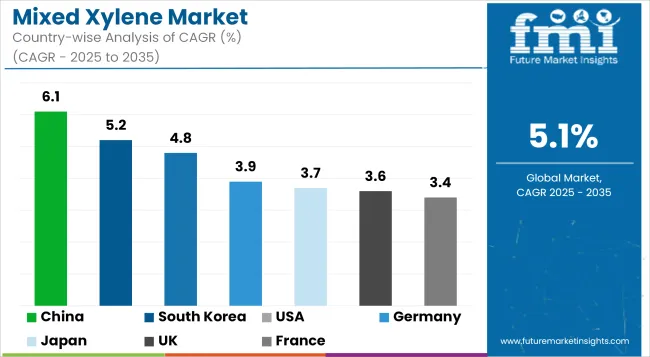
Mixed Xylene Market
Market Insights on Mixed Xylene covering sales outlook, demand forecast & up-to-date key trends
Mixed Xylene Market By Grade (Isomer Grade, Solvent Grade), Application (Fuel Blending, Solvents, Thinners, Raw Material) & Region - Forecast 2022 - 2028
Mixed Xylene Market Outlook (2022-2028)
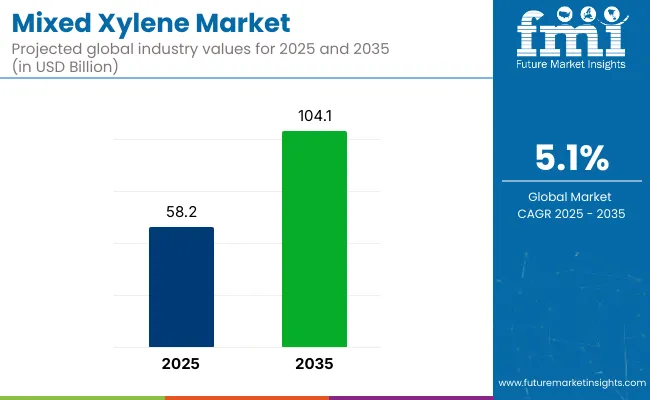
[231 pages Report] Sales of mixed xylene are set to be valued at US$ 197.8 Bn in 2022. The global mixed xylene market is predicted to expand at an impressive CAGR of 7.1% and surge to a valuation to US$ 299.2 Bn by the end of 2028.
Mixed Xylene Market Size (2022) |
US$ 197.8 Bn |
Projected Market Value (2028) |
US$ 299.2 Bn |
Forecasted Growth Rate (2022-2028) |
7.1% CAGR |
Country with Largest Market Share |
China - 25.3% |
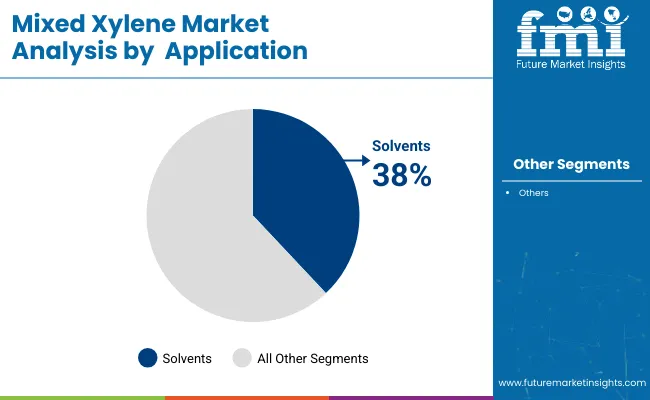
Demand for mixed xylene is predicted to be majorly influenced by rising demand for paraxylene in chemicals and other end-use industries. Use of mixed xylene as a solvent in multiple end-use industries is expected to increase over the coming years and push mixed xylene demand through 2028.
Let us know your requirement to get
100% FREE customization
Consumption Analysis of Mixed Xylene (2013 to 2021) Vs Forecast Statistics (2022 to 2028)
Xylene is a man-made chemical that has vast scope of application in numerous end-use industries. The mixed xylene market saw an increase in valuation from US$ 115.7 Bn in 2013 to US$ 184.9 Bn in 2021, expanding at a CAGR of 6%.
Increasing use of mixed xylene as a solvent is emerging as a prominent trend in the industry across the globe, and this is expected to drive mixed xylene demand through 2028. The market for mixed xylene has seen some major changes in the past couple of years due to oversupply and undersupply in various regions.
- For instance, ExxonMobil announced a halt of production at its Jurong Aromatics Recovery (JAR) plant in Singapore from January 2021 for an indefinite period due to oversupply and narrow profit margins.
However, high demand from multiple end-use industries has encouraged mixed xylene suppliers to increase their production capacity, especially for paraxylene, which sees high demand due to its crucial role in the manufacturing of polymers.
- Pakistan's Byco Petroleum, which is now Cnergyico Pk Limited, also depicted interest in building a new aromatics plant that would be capable of producing 27,300 b/d of benzene, mixed xylene, paraxylene, and other chemical products.
Increasing spending on the research & development of bio-based mixed xylene, rising demand for mixed xylene as a fuel blending agent, increasing scope of application as a solvent in end-use industries, and high demand for PET production are factors influence market growth potential.
Overall, the mixed xylene market is predicted to progress at a high CAGR of 7.1% from 2022 to 2028.
How is Demand for Polyethylene Terephthalate (PET) Expected to Influence the Mixed Xylene Market?
“High Use of Mixed Xylene as Raw Material in PET Production to Drive Market Growth”
Demand for PET bottles has increased substantially over the past few years as their adoption in the beverages industry has seen a major upward trend. This has fostered high demand for Polyethylene Terephthalate (PET), which crucially depends on mixed xylene for its production. Demand for PET fibers and films is also predicted to rise and propel mixed xylene sales through 2028.
Find your sweet spots for generating winning opportunities in this market.
Talk to AnalystWhat’s Restraining Market Growth to Some Extent?
“Adverse Effects on Health and Environment to Negatively Affect Mixed Xylene Demand”
Mixed xylene harms human health and can be fatal if the consumption amount is more than a particular amount. It’s harmful if inhaled or swallowed, and the toxicity is dependent on the composition of the medium. It can cause skin irritation, respiratory tract irritation, and also eye irritation such as an allergic reaction.
Environmental concerns regarding the use of plastic and stringent government mandates for chemical products are also expected to hamper mixed xylene demand growth to some extent over the coming years.
How is the Mixed Xylene Market Expected to Perform on a Regional Level?
“China to Lead Consumption of Mixed Xylene”
The mixed xylene industry has been surveyed across regions such as North America, Latin America, Europe, East Asia, South Asia & Pacific, and the Middle East & Africa (MEA).
Cumulatively, the market for mixed xylene in East Asia, South Asia, and the Pacific regions holds a dominant market share in the global landscape, and this trend is expected to be followed through 2028. China is the leading consumer of mixed xylene in the world.
Increasing use of mixed xylene as a solvent in multiple end-use industries is expected to be a major factor that is driving mixed xylene consumption in these aforementioned regions.
Demand for mixed xylene in North America is expected to rise at a notable pace over the forecast period. Shipments of mixed xylene in North America account for 17.7% of the global mixed xylene shipments at present. Rising use of mixed xylene to improve the octane number of gasoline and other fuels is a major trend in this region.
The market for mixed xylene in Eastern Europe and Western Europe holds a share of 5% and 12.8% respectively in 2022. The mixed xylene demand in these regions is expected to be influenced by the increasing use of mixed xylene in end-use industries like chemicals, rubber, and plastics.
Demand for mixed xylene from the MEA region is expected to be relatively lower than most regions. Mixed xylene market in MEA accounts for 5.6% of the global market landscape in 2022 and this is expected to rise at a steady pace as industrialization speeds up in the region.

An unified Market Research Subscription Platform, built for today’s disparate research needs.
Country-wise Analysis
What Drives High Demand for Mixed Xylene in China?
“Rising Use of Xylene in PET Products to Be Prominent Trend in China”
Increasing production of polyester products, such as polyethylene terephthalate (PET), films, and fibers in China is expected to majorly influence mixed xylene shipments over the forecast period. China is a major manufacturing hub and the presence of well-established production and distribution infrastructure makes it a highly favorable market for mixed xylene manufacturers.
The China mixed xylene market holds a share of 25.3% in the global market.
What is the Outlook for Mixed Xylene Shipments in the U.S.?
“Fuel Blending to Prominently Drive Mixed Xylene Consumption in the U.S.”
Increasing use of gasoline in the U.S. has majorly influenced the demand for mixed xylene. Mixed xylene is used as a fuel blender to improve the octane number of fuel and increase overall efficiency for better performance. Increasing spending on research and development of bio-based fuels in the U.S. as consumer awareness for environment increases is expected to drive mixed xylene market in this nation.
Increasing use of mixed xylene as a solvent in industries such as paints, coatings, adhesives, sealants, etc., is also expected to be a notable trend over the forecast period.
Category-wise Analysis
Which Grade of Mixed Xylene Has a Dominant Outlook?
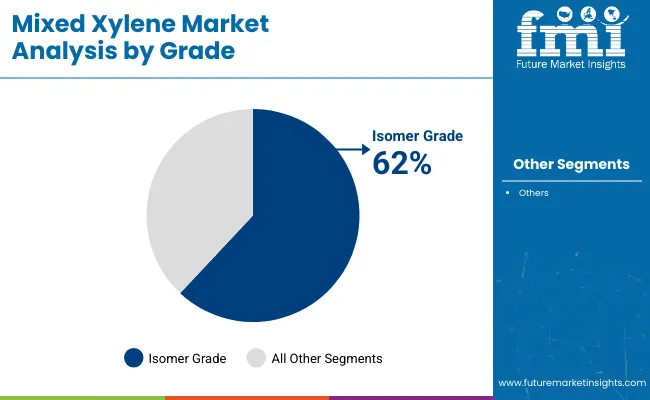
“Isomer Grade Mixed Xylene Holds Majority Revenue Share”
Isomer grade mixed xylene currently accounts for more than 70% of the global mixed xylene market share and is expected to have a strong stance through the forecast period. However, increasing demand for solvent grade mixed xylene from multiple end-use industries is expected to increase its consumption over the coming years.
Industries such as paint & coatings, pesticides, etc., utilize mixed xylene as a solvent due to its adhesive properties, and this could favor its demand over the coming time period.
COVID-19 Crisis Analysis
The pandemic caused manufacturing activities to hit a near standstill stance in 2020 and this adversely affected multiple industry verticals including the chemical industry. Production of many chemical products was negatively impacted in the pandemic era as lockdown mandates created difficulties in the production and distribution of raw materials and finished products.
Production of mixed xylene saw a drop in 2020 and this adversely affected the market potential. Demand for mixed xylene is expected to be high in the post-pandemic era and this increased demand is expected to be met with mixed xylene suppliers increasing their production capacities across the world.
Mixed xylene shipments are predicted to see a steady increase in the post-pandemic world, with manufacturing activities returning to normal operational capacities.
Competitive Landscape
Mixed xylene suppliers are investing in increasing their production capacity to meet the increasing demand from various end-use industries. Mixed xylene companies are also focusing on mergers and acquisitions to increase their market presence on a global level.
- In June 2020, Europe integrated Ineos announced the acquisition of BP’s global paraxylene (PX), acetyls, and purified terephthalic acid (PTA) businesses. This acquisition is aimed at further bolstering Ineos’s existing petrochemical business and will also strengthen its product portfolio for polyster market. The BP assets will be owned by Ineos Syrolution for US$ 5 Bn.
Mixed Xylene Industry Report Scope
Attribute |
Details |
Forecast Period |
2022-2028 |
Historical Data Available for |
2013-2021 |
Market Analysis |
US$ Mn for Value |
Key Regions Covered |
|
Key Countries Covered |
|
Key Market Segments Covered |
|
Key Companies Profiled |
|
Pricing |
Available upon Request |
Key Segments of Mixed Xylene Industry Survey
By Grade:
- Isomer Grade Mixed Xylene
- Solvent Grade Mixed Xylene
By Application:
- Fuel Blending
- Solvents
- Thinners
- Raw Materials
By End Use:
- Mixed Xylene for Paints & Coatings
- Mixed Xylene for Pesticides
- Mixed Xylene for Chemicals
- Mixed Xylene for Gasoline
- Mixed Xylene for Printing, Rubber & Leather
By Region:
- North America Mixed Xylene Market
- Latin America Mixed Xylene Market
- Europe Mixed Xylene Market
- East Asia Mixed Xylene Market
- South Asia & Pacific Mixed Xylene Market
- Middle East & Africa (MEA) Mixed Xylene Market
Frequently Asked Questions
The global mixed xylene market is estimated to expand at a CAGR of 6.7% over the forecast period of 2022 to 2028.
In 2022, the global mixed xylene market is set to be worth US$ 197.8 Bn.
Increasing R&D investments by manufacturers in the development of bio-based mixed xylene, rising use in fuel blending to improve the octane rating of fuels, and increasing use as a solvent in multiple end-use industries are propelling market expansion.
Mixed xylene market revenue is projected to reach US$ 299.2 Bn by 2028.
Paints & coatings, pesticides, chemicals, gasoline, and printing, and rubber & leather are major consuming end-use industries of mixed xylene.
1. Executive Summary
1.1. Overview
1.2. Market Analysis
1.3. FMI Analysis and Recommendations
1.4. Wheel of Fortune
2. Market Introduction
2.1. Market Taxonomy
2.2. Market Definition
3. Market Viewpoint
3.1. Macro-Economic Factors
3.2. Market Dynamics
3.2.1. Drivers
3.2.2. Restraints
3.2.3. Trends
3.3. Value Chain
3.4. Forecast Factors: Relevance and Impact
3.5. Opportunity Analysis
4. Global Mixed Xylene Market Analysis 2013–2021 and Forecast 2022–2028
4.1. Introduction
4.1.1. Market Volume Analysis
4.1.2. Global Average Pricing Analysis
4.1.3. Market Size and Y-o-Y Growth
4.1.4. Absolute $ Opportunity
5. Global Mixed Xylene Market Analysis 2013–2021 and Forecast 2022–2028 By Grade
5.1. Introduction / Key Findings
5.2. Historical Market Size (US$ Mn) and Volume (Tons) Analysis By Grade, 2013 - 2021
5.3. Current Market Size (US$ Mn) and Volume (Tons) Forecast By Grade, 2022 - 2028
5.3.1. Isomer Grade
5.3.2. Solvent Grade
5.4. Key Trends / Developments
5.5. Market Attractiveness Analysis By Grade
6. Global Mixed Xylene Market Analysis 2013–2021 and Forecast 2022–2028 By Application
6.1. Introduction / Key Findings
6.2. Historical Market Size (US$ Mn) and Volume (Tons) Analysis By Application , 2013 - 2021
6.3. Current Market Size (US$ Mn) and Volume (Tons) Forecast By Application , 2022 - 2028
6.3.1. Fuel Blending
6.3.2. Solvents
6.3.3. Thinners
6.3.4. Raw Material
6.4. Key Trends / Developments
6.5. Market Attractiveness Analysis By Application
7. Global Mixed Xylene Market Analysis 2013–2021 and Forecast 2022–2028 By End Use
7.1. Introduction / Key Findings
7.2. Historical Market Size (US$ Mn) and Volume (Tons) Analysis By End Use, 2013 - 2021
7.3. Current Market Size (US$ Mn) and Volume (Tons) Forecast By End Use, 2022 – 2028
7.3.1. Paints & Coatings
7.3.2. Pesticides
7.3.3. Chemicals
7.3.4. Gasoline
7.3.5. Printing, Rubber & Leather
7.4. Key Trends / Developments
7.5. Market Attractiveness Analysis By End Use
8. Global Mixed Xylene Market Analysis 2013–2021 and Forecast 2022–2028 By Region
8.1. Introduction / Key Findings
8.2. Historical Market Size (US$ Mn) and Volume (Tons) Analysis By Region, 2013 - 2021
8.3. Current Market Size (US$ Mn) and Volume (Tons) Forecast By Region, 2022 - 2028
8.3.1. North America
8.3.2. Latin America
8.3.3. Asia Pacific Excl. China & Japan (APEJC)
8.3.4. Western Europe
8.3.5. Eastern Europe
8.3.6. Middle East and Africa (MEA)
8.3.7. China
8.3.8. Japan
8.4. Market Attractiveness Analysis By Region
9. North America Mixed Xylene Market Analysis 2013–2021 and Forecast 2022–2028
9.1. Introduction
9.2. North America – Average Pricing Analysis
9.3. Historical Market Size (US$ Mn) and Volume (Tons) Analysis By Market Taxonomy, 2013 - 2021
9.3.1. By Country
9.3.2. By Grade
9.3.3. By Application
9.3.4. By End Use
9.4. Current Market Size (US$ Mn) and Volume (Tons) Forecast By Country 2022 - 2028
9.4.1. U.S.
9.4.2. Canada
9.5. Current Market Size (US$ Mn) and Volume (Tons) Forecast By Grade, 2022 - 2028
9.5.1. Isomer Grade
9.5.2. Solvent Grade
9.6. Current Market Size (US$ Mn) and Volume (Tons) Forecast By Application , 2022 - 2028
9.6.1. Fuel Blending
9.6.2. Solvent
9.6.3. Thinners
9.6.4. Raw Material
9.7. Current Market Size (US$ Mn) and Volume (Tons) Forecast By End Use, 2022 – 2028
9.7.1. Paints & Coatings
9.7.2. Pesticides
9.7.3. Chemicals
9.7.4. Printing, Rubber & Leather
9.8. Drivers and Restraints: Impact Analysis
9.9. Market Attractiveness Analysis
9.9.1. By Country
9.9.2. By Grade
9.9.3. By Application
9.9.4. By End Use
9.10. Key Representative Market Participants
9.11. Market Presence (Intensity Map)
10. Latin America Mixed Xylene Market Analysis 2013–2021 and Forecast 2022–2028
10.1. Introduction
10.2. Latin America – Average Pricing Analysis
10.3. Historical Market Size (US$ Mn) and Volume (Tons) Analysis By Market Taxonomy, 2013 - 2021
10.3.1. By Country
10.3.2. By Grade
10.3.3. By Application
10.3.4. By End Use
10.4. Current Market Size (US$ Mn) and Volume (Tons) Forecast By Country 2022 - 2028
10.4.1. Mexico
10.4.2. Brazil
10.4.3. Rest of Latin America
10.5. Current Market Size (US$ Mn) and Volume (Tons) Forecast By Grade, 2022 - 2028
10.5.1. Isomer Grade
10.5.2. Solvent Grade
10.6. Current Market Size (US$ Mn) and Volume (Tons) Forecast By Application , 2022 - 2028
10.6.1. Fuel Blending
10.6.2. Solvent
10.6.3. Thinners
10.6.4. Raw Material
10.7. Current Market Size (US$ Mn) and Volume (Tons) Forecast By End Use, 2022 – 2028
10.7.1. Paints & Coatings
10.7.2. Pesticides
10.7.3. Chemicals
10.7.4. Printing, Rubber & Leather
10.8. Drivers and Restraints: Impact Analysis
10.9. Market Attractiveness Analysis
10.9.1. By Country
10.9.2. By Grade
10.9.3. By Application
10.9.4. By End Use
10.10. Key Representative Market Participants
10.11. Market Presence (Intensity Map)
11. Western Europe Mixed Xylene Market Analysis 2013–2021 and Forecast 2022–2028
11.1. Introduction
11.2. Western Europe – Average Pricing Analysis
11.3. Historical Market Size (US$ Mn) and Volume (Tons) Analysis By Market Taxonomy, 2013 - 2021
11.3.1. By Country
11.3.2. By Grade
11.3.3. By Construction Type
11.3.4. By Application
11.3.5. By End Use
11.4. Current Market Size (US$ Mn) and Volume (Tons) Forecast By Country 2022 - 2028
11.4.1. Germany
11.4.2. Italy
11.4.3. France
11.4.4. U.K.
11.4.5. Spain
11.4.6. BENELUX
11.4.7. Rest of Western Europe
11.5. Current Market Size (US$ Mn) and Volume (Tons) Forecast By Grade, 2022 - 2028
11.5.1. Isomer Grade
11.5.2. Solvent Grade
11.6. Current Market Size (US$ Mn) and Volume (Tons) Forecast By Application , 2022 - 2028
11.6.1. Fuel Blending
11.6.2. Solvent
11.6.3. Thinners
11.6.4. Raw Material
11.7. Current Market Size (US$ Mn) and Volume (Tons) Forecast By End Use, 2022 – 2028
11.7.1. Paints & Coatings
11.7.2. Pesticides
11.7.3. Chemicals
11.7.4. Printing, Rubber & Leather
11.8. Drivers and Restraints: Impact Analysis
11.9. Market Attractiveness Analysis
11.9.1. By Country
11.9.2. By Grade
11.9.3. By Application
11.9.4. By End Use
11.10. Key Representative Market Participants
11.11. Market Presence (Intensity Map)
12. Eastern Europe Mixed Xylene Market Analysis 2013–2021 and Forecast 2022–2028
12.1. Introduction
12.2. Eastern Europe – Average Pricing Analysis
12.3. Historical Market Size (US$ Mn) and Volume (Tons) Analysis By Market Taxonomy, 2013 - 2021
12.3.1. By Country
12.3.2. By Grade
12.3.3. By Application
12.3.4. By End Use
12.4. Current Market Size (US$ Mn) and Volume (Tons) Forecast By Country 2022 - 2028
12.4.1. Russia
12.4.2. Poland
12.4.3. Rest of Eastern Europe
12.5. Current Market Size (US$ Mn) and Volume (Tons) Forecast By Grade, 2022 - 2028
12.5.1. Isomer Grade
12.5.2. Solvent Grade
12.6. Current Market Size (US$ Mn) and Volume (Tons) Forecast By Application , 2022 - 2028
12.6.1. Fuel Blending
12.6.2. Solvent
12.6.3. Thinners
12.6.4. Raw Material
12.7. Current Market Size (US$ Mn) and Volume (Tons) Forecast By End Use, 2022 – 2028
12.7.1. Paints & Coatings
12.7.2. Pesticides
12.7.3. Chemicals
12.7.4. Printing, Rubber & Leather
12.8. Drivers and Restraints: Impact Analysis
12.9. Market Attractiveness Analysis
12.9.1. By Country
12.9.2. By Grade
12.9.3. By Application
12.9.4. By End Use
12.10. Key Representative Market Participants
12.11. Market Presence (Intensity Map)
13. Middle East and Africa Mixed Xylene Market Analysis 2013–2021 and Forecast 2022–2028
13.1. Introduction
13.2. Middle East and Africa – Average Pricing Analysis
13.3. Historical Market Size (US$ Mn) and Volume (Tons) Analysis By Market Taxonomy, 2013 - 2021
13.3.1. By Country
13.3.2. By Grade
13.3.3. By Application
13.3.4. By End Use
13.4. Current Market Size (US$ Mn) and Volume (Tons) Forecast By Country 2022 - 2028
13.4.1. GCC Countries
13.4.2. Northern Africa
13.4.3. South Africa
13.4.4. Turkey
13.4.5. Rest of MEA
13.5. Current Market Size (US$ Mn) and Volume (Tons) Forecast By Grade, 2022 - 2028
13.5.1. Isomer Grade
13.5.2. Solvent Grade
13.6. Current Market Size (US$ Mn) and Volume (Tons) Forecast By Application , 2022 - 2028
13.6.1. Fuel Blending
13.6.2. Solvent
13.6.3. Thinners
13.6.4. Raw Material
13.7. Current Market Size (US$ Mn) and Volume (Tons) Forecast By End Use, 2022 – 2028
13.7.1. Paints & Coatings
13.7.2. Pesticides
13.7.3. Chemicals
13.7.4. Printing, Rubber & Leather
13.8. Drivers and Restraints: Impact Analysis
13.9. Market Attractiveness Analysis
13.9.1. By Country
13.9.2. By Grade
13.9.3. By Application
13.9.4. By End Use
13.10. Key Representative Market Participants
13.11. Market Presence (Intensity Map)
14. Asia Pacific Excl. China & Japan (APEJC) Mixed Xylene Market Analysis 2013–2021 and Forecast 2022–2028
14.1. Introduction
14.2. APEJC – Average Pricing Analysis
14.3. Historical Market Size (US$ Mn) and Volume (Tons) Analysis By Market Taxonomy, 2013 - 2021
14.3.1. By Country
14.3.2. By Grade
14.3.3. By Application
14.3.4. By End Use
14.4. Current Market Size (US$ Mn) and Volume (Tons) Forecast By Country 2022 - 2028
14.4.1. India
14.4.2. South Korea
14.4.3. ASEAN
14.4.4. Oceania
14.4.5. Rest of APEJ
14.5. Current Market Size (US$ Mn) and Volume (Tons) Forecast By Grade, 2022 - 2028
14.5.1. Isomer Grade
14.5.2. Solvent Grade
14.6. Current Market Size (US$ Mn) and Volume (Tons) Forecast By Application , 2022 - 2028
14.6.1. Fuel Blending
14.6.2. Solvent
14.6.3. Thinners
14.6.4. Raw Material
14.7. Current Market Size (US$ Mn) and Volume (Tons) Forecast By End Use, 2022 – 2028
14.7.1. Paints & Coatings
14.7.2. Pesticides
14.7.3. Chemicals
14.7.4. Printing, Rubber & Leather
14.8. Drivers and Restraints: Impact Analysis
14.9. Market Attractiveness Analysis
14.9.1. By Country
14.9.2. By Grade
14.9.3. By Application
14.9.4. By End Use
14.10. Key Representative Market Participants
14.11. Market Presence (Intensity Map)
15. China Mixed Xylene Market Analysis 2013–2021 and Forecast 2022–2028
15.1. Introduction
15.2. China – Average Pricing Analysis
15.3. Historical Market Size (US$ Mn) and Volume (Tons) Analysis By Market Taxonomy, 2013 - 2021
15.3.1. By Grade
15.3.2. By Application
15.3.3. By End Use
15.4. Current Market Size (US$ Mn) and Volume (Tons) Forecast By Grade, 2022 - 2028
15.4.1. Isomer Grade
15.4.2. Solvent Grade
15.5. Current Market Size (US$ Mn) and Volume (Tons) Forecast By Application , 2022 - 2028
15.5.1. Fuel Blending
15.5.2. Solvent
15.5.3. Thinners
15.5.4. Raw Material
15.6. Current Market Size (US$ Mn) and Volume (Tons) Forecast By End Use, 2022 – 2028
15.6.1. Paints & Coatings
15.6.2. Pesticides
15.6.3. Chemicals
15.6.4. Printing, Rubber & Leather
15.7. Drivers and Restraints: Impact Analysis
15.8. Market Attractiveness Analysis
15.8.1. By Country
15.8.2. By Grade
15.8.3. By Application
15.8.4. By End Use
15.9. Key Representative Market Participants
15.10. Market Presence (Intensity Map)
16. Japan Mixed Xylene Market Analysis 2013–2021 and Forecast 2022–2028
16.1. Introduction
16.2. Japan – Average Pricing Analysis
16.3. Historical Market Size (US$ Mn) and Volume (Tons) Analysis By Market Taxonomy, 2013 - 2021
16.3.1. By Grade
16.3.2. By Application
16.3.3. By End Use
16.4. Current Market Size (US$ Mn) and Volume (Tons) Forecast By Grade, 2022 - 2028
16.4.1. Isomer Grade
16.4.2. Solvent Grade
16.5. Current Market Size (US$ Mn) and Volume (Tons) Forecast By Application , 2022 - 2028
16.5.1. Fuel Blending
16.5.2. Solvent
16.5.3. Thinners
16.5.4. Raw Material
16.6. Current Market Size (US$ Mn) and Volume (Tons) Forecast By End Use, 2022 – 2028
16.6.1. Paints & Coatings
16.6.2. Pesticides
16.6.3. Chemicals
16.6.4. Printing, Rubber & Leather
16.7. Drivers and Restraints: Impact Analysis
16.8. Market Attractiveness Analysis
16.8.1. By Country
16.8.2. By Grade
16.8.3. By Application
16.8.4. By End Use
16.9. Key Representative Market Participants
16.10. Market Presence (Intensity Map)
17. Competition Landscape
17.1. Market Structure
17.2. Market Concentration
17.3. Market Share Analysis
17.4. Competition Dashboard
17.5. Company Profiles (Details – Overview, Financials, Strategy, Recent Developments)
17.5.1. Exxon Mobil Corporation,
17.5.2. Total S.A.,
17.5.3. GS Caltex Corporation,
17.5.4. Idemitsu Kosan Co. Ltd.,
17.5.5. Lotte Chemical Corporation,
17.5.6. Royal Dutch Shell PLC,
17.5.7. China National Petroleum Company,
17.5.8. Chevron Phillips Chemical Company,
17.5.9. China Petroleum & Chemicals Corporation,
17.5.10. Flint Hills Resources,
17.5.11. YPF,
17.5.12. SK Global Chemical Co. Ltd.,
18. Research Methodology
19. Assumptions & Acronyms
Let us know your requirement to get
100% FREE customization
Table 01: Global Market Size (US$ Mn) and Volume (KT) Forecast By Grade 2013 – 2028
Table 02: Global Market Size (US$ Mn) and Volume (KT) Forecast By Application 2013 – 2028
Table 03: Global Market Size (US$ Mn) and Volume (KT) Forecast By End Use 2013 – 2028
Table 04: Global Market Size (US$ Mn) and Volume (KT) Forecast by Region 2013 – 2028
Table 05: North America Market Size (US$ Mn) and Volume (KT) Forecast by Country 2013 – 2028
Table 06: North America Market Size (US$ Mn) and Volume (KT) Forecast By Grade 2013 – 2028
Table 07: North America Market Size (US$ Mn) and Volume (KT) Forecast By Application 2013 – 2028
Table 08: North America Market Size (US$ Mn) and Volume (KT) Forecast By End Use 2013 – 2028
Table 09: Latin America Market Size (US$ Mn) and Volume (KT) Forecast by Country 2013 – 2028
Table 10: Latin America Market Size (US$ Mn) and Volume (KT) Forecast By Grade 2013 – 2028
Table 11: Latin America Market Size (US$ Mn) and Volume (KT) Forecast By Application 2013 – 2028
Table 12: Latin America Market Size (US$ Mn) and Volume (KT) Forecast By End Use 2013 – 2028
Table 13: Eastern Europe Market Size (US$ Mn) and Volume (KT) Forecast by Country 2013 – 2028
Table 14: Eastern Europe Market Size (US$ Mn) and Volume (KT) Forecast By Grade 2013 – 2028
Table 15: Eastern Europe Market Size (US$ Mn) and Volume (KT) Forecast By Application 2013 – 2028
Table 16: Eastern Europe Market Size (US$ Mn) and Volume (KT) Forecast By End Use 2013 – 2028
Table 17: Western Europe Market Size (US$ Mn) and Volume (KT) Forecast by Country 2013 – 2028
Table 18: Western Europe Market Size (US$ Mn) and Volume (KT) Forecast By Grade 2013 – 2028
Table 19: Western Europe Market Size (US$ Mn) and Volume (KT) Forecast By Application 2013 – 2028
Table 20: Western Europe Market Size (US$ Mn) and Volume (KT) Forecast By End Use 2013 – 2028
Table 21: MEA Market Size (US$ Mn) and Volume (KT) Forecast by Country 2013 – 2028
Table 22: MEA Market Size (US$ Mn) and Volume (KT) Forecast By Grade 2013 – 2028
Table 23: MEA Market Size (US$ Mn) and Volume (KT) Forecast By Application 2013 – 2028
Table 24: MEA Market Size (US$ Mn) and Volume (KT) Forecast By End Use 2013 – 2028
Table 25: APEJC Market Size (US$ Mn) and Volume (KT) Forecast by Country 2013 – 2028
Table 26: APEJC Market Size (US$ Mn) and Volume (KT) Forecast By Grade 2013 – 2028
Table 27: APEJC Market Size (US$ Mn) and Volume (KT) Forecast By Application 2013 – 2028
Table 28: APEJC Market Size (US$ Mn) and Volume (KT) Forecast By End Use 2013 – 2028
Table 29: China Market Size (US$ Mn) and Volume (KT) Forecast By Grade 2013 – 2028
Table 30: China Market Size (US$ Mn) and Volume (KT) Forecast By Application 2013 – 2028
Table 31: China Market Size (US$ Mn) and Volume (KT) Forecast By End Use 2013 – 2028
Table 32: Japan Market Size (US$ Mn) and Volume (KT) Forecast By Grade 2013 – 2028
Table 33: Japan Market Size (US$ Mn) and Volume (KT) Forecast By Application 2013 – 2028
Table 34: Japan Market Size (US$ Mn) and Volume (KT) Forecast By End Use 2013 – 2028
Find your sweet spots for generating winning opportunities in this market.
Talk to AnalystFigure 01: Global Mixed Xylene Market Split by Grade, 2021
Figure 02: Global Mixed Xylene Market Split by Application, 2021
Figure 03: Global Mixed Xylene Market Split by End Use, 2021
Figure 04: Global Mixed Xylene Market Split by Region, 2021
Figure 05: North America GDP Forecast (US$ Bn) & Y-o-Y Growth, 2021 – 2028
Figure 06: Latin America GDP Forecast (US$ Bn) & Y-o-Y Growth, 2021 – 2028xx
Figure 07: Eastern Europe GDP Forecast (US$ Bn) & Y-o-Y Growth, 2021 – 2028
Figure 08: Western Europe GDP Forecast (US$ Bn) & Y-o-Y Growth, 2021 – 2028
Figure 09: MEA GDP Forecast (US$ Bn) & Y-o-Y Growth, 2021 – 2028
Figure 10: APEJC GDP Forecast (US$ Bn) & Y-o-Y Growth, 2021 – 2028
Figure 11: China GDP Forecast (US$ Bn) & Y-o-Y Growth, 2021 – 2028
Figure 12: Japan GDP Forecast (US$ Bn) & Y-o-Y Growth, 2021 – 2028
Figure 13: Global Historical Market Volume (KT) Analysis, 2013-2021
Figure 14: Global Current and Future Market Volume (KT) Analysis, 2022-2028
Figure 15: Global Mixed Xylene Market Historical Value (US$ Mn), 2013 – 2021
Figure 16: Global Mixed Xylene Market Value (US$ Mn) Forecast, 2022 – 2028
Figure 17: Global Mixed Xylene Market Absolute $ Opportunity, 2013 to 2021 and 2028
Figure 18: Global Mixed Xylene Market Value Share and BPS Analysis By Grade – 2022 & 2028
Figure 19: Global Mixed Xylene Market Value Y-o-Y (%) Growth Projections By Grade, 2021 – 2028
Figure 20: Global Mixed Xylene Market Attractiveness Analysis By Grade, 2022 – 2028
Figure 21: Global Mixed Xylene Market Absolute $ Opportunity by Isomer Grade Segment, 2021 – 2028
Figure 22: Global Mixed Xylene Market Absolute $ Opportunity by Solvent Grade Segment, 2021 – 2028
Figure 23: Global Mixed Xylene Market Value Share and BPS Analysis By Application – 2022 & 2028
Figure 24: Global Mixed Xylene Market Value Y-o-Y (%) Growth Projections By Application, 2021 – 2028
Figure 25: Global Mixed Xylene Market Attractiveness Analysis By Application, 2022 – 2028
Figure 26: Global Mixed Xylene Market Absolute $ Opportunity by Fuel Blending Segment, 2021 – 2028
Figure 27: Global Mixed Xylene Market Absolute $ Opportunity by Solvents Segment, 2021 – 2028
Figure 28: Global Mixed Xylene Market Absolute $ Opportunity by Thinners Segment, 2021 – 2028
Figure 29: Global Mixed Xylene Market Absolute $ Opportunity by Raw Material Segment, 2021 – 2028
Figure 30: Global Mixed Xylene Market Value Share and BPS Analysis By End Use – 2022 & 2028
Figure 31: Global Mixed Xylene Market Value Y-o-Y (%) Growth Projections By End Use, 2021 – 2028
Figure 32: Global Mixed Xylene Market Attractiveness Analysis By End Use, 2022 – 2028
Figure 33: Global Mixed Xylene Market Absolute $ Opportunity by Paints & Coatings Segment, 2021 – 2028
Figure 34: Global Mixed Xylene Market Absolute $ Opportunity by Pesticides Segment, 2021 – 2028
Figure 35: Global Mixed Xylene Market Absolute $ Opportunity by Chemicals Segment, 2021 – 2028
Figure 36: Global Mixed Xylene Market Absolute $ Opportunity by Gasoline Segment, 2021 – 2028
Figure 37: Global Mixed Xylene Market Absolute $ Opportunity by Printing, Rubber & Leather Segment, 2021 – 2028
Figure 38: Global Mixed Xylene Market Value Share and BPS Analysis by Region – 2022 & 2028
Figure 39: Global Mixed Xylene Market Value Y-o-Y (%) Growth Projections by Region, 2021 – 2028
Figure 40: Global Mixed Xylene Market Attractiveness Analysis by Region, 2022 – 2028
Figure 41: North America Mixed Xylene Market Absolute $ Opportunity, 2021 – 2028
Figure 42: Latin America Mixed Xylene Market Absolute $ Opportunity, 2021 – 2028
Figure 43: Eastern Europe Mixed Xylene Market Absolute $ Opportunity, 2021 – 2028
Figure 44: Western Europe Mixed Xylene Market Absolute $ Opportunity, 2021 – 2028
Figure 45: MEA Mixed Xylene Market Absolute $ Opportunity, 2021 – 2028
Figure 46: APEJC Mixed Xylene Market Absolute $ Opportunity, 2021 – 2028
Figure 47: China Mixed Xylene Market Absolute $ Opportunity, 2021 – 2028
Figure 48: Japan Mixed Xylene Market Absolute $ Opportunity, 2021 – 2028
Figure 49: North America Mixed Xylene Market Value Share and BPS Analysis by Country – 2022 & 2028
Figure 50: North America Mixed Xylene Market Value Y-o-Y (%) Growth Projections by Country, 2021 – 2028
Figure 51: North America Mixed Xylene Market Attractiveness Analysis by Country, 2022 – 2028
Figure 52: U.S. Mixed Xylene Market Absolute $ Opportunity, 2021 – 2028
Figure 53: Canada Mixed Xylene Market Absolute $ Opportunity, 2021 – 2028
Figure 54: North America Mixed Xylene Market Value Share and BPS Analysis By Grade – 2022 & 2028
Figure 55: North America Mixed Xylene Market Value Y-o-Y (%) Growth Projections By Grade, 2021 – 2028
Figure 56: North America Mixed Xylene Market Attractiveness Analysis By Grade, 2022 – 2028
Figure 57: North America Mixed Xylene Market Value Share and BPS Analysis By Application – 2022 & 2028
Figure 58: North America Mixed Xylene Market Value Y-o-Y (%) Growth Projections By Application, 2021 – 2028
Figure 59: North America Mixed Xylene Market Attractiveness Analysis By Application, 2022 – 2028
Figure 60: North America Mixed Xylene Market Value Share and BPS Analysis By End Use – 2022 & 2028
Figure 61: North America Mixed Xylene Market Value Y-o-Y (%) Growth Projections By End Use, 2021 – 2028
Figure 62: North America Mixed Xylene Market Attractiveness Analysis By End Use, 2022 – 2028
Figure 63: Latin America Mixed Xylene Market Value Share and BPS Analysis by Country – 2022 & 2028
Figure 64: Latin America Mixed Xylene Market Value Y-o-Y (%) Growth Projections by Country, 2021 – 2028
Figure 65: Latin America Mixed Xylene Market Attractiveness Analysis by Country, 2022 – 2028
Figure 66: Brazil Mixed Xylene Market Absolute $ Opportunity, 2021 – 2028
Figure 67: Mexico Mixed Xylene Market Absolute $ Opportunity, 2021 – 2028
Figure 68: Rest of LA Mixed Xylene Market Absolute $ Opportunity, 2021 – 2028
Figure 69: Latin America Mixed Xylene Market Value Share and BPS Analysis By Grade – 2022 & 2028
Figure 70: Latin America Mixed Xylene Market Value Y-o-Y (%) Growth Projections By Grade, 2021 – 2028
Figure 71: Latin America Mixed Xylene Market Attractiveness Analysis By Grade, 2022 – 2028
Figure 72: Latin America Mixed Xylene Market Value Share and BPS Analysis By Application – 2022 & 2028
Figure 73: Latin America Mixed Xylene Market Value Y-o-Y (%) Growth Projections By Application, 2021 – 2028
Figure 74: Latin America Mixed Xylene Market Attractiveness Analysis By Application, 2022 – 2028
Figure 75: Latin America Mixed Xylene Market Value Share and BPS Analysis By End Use – 2022 & 2028
Figure 76: Latin America Mixed Xylene Market Value Y-o-Y (%) Growth Projections By End Use, 2021 – 2028
Figure 77: Latin America Mixed Xylene Market Attractiveness Analysis By End Use, 2022 – 2028
Figure 78: Eastern Europe Mixed Xylene Market Value Share and BPS Analysis by Country – 2022 & 2028
Figure 79: Eastern Europe Mixed Xylene Market Value Y-o-Y (%) Growth Projections by Country, 2021 – 2028
Figure 80: Eastern Europe Mixed Xylene Market Attractiveness Analysis by Country, 2022 – 2028
Figure 81: Russia Mixed Xylene Market Absolute $ Opportunity, 2021 – 2028
Figure 82: Poland Mixed Xylene Market Absolute $ Opportunity, 2021 – 2028
Figure 83: Rest of EE Mixed Xylene Market Absolute $ Opportunity, 2021 – 2028
Figure 84: Eastern Europe Mixed Xylene Market Value Share and BPS Analysis By Grade – 2022 & 2028
Figure 85: Eastern Europe Mixed Xylene Market Value Y-o-Y (%) Growth Projections By Grade, 2021 – 2028
Figure 86: Eastern Europe Mixed Xylene Market Attractiveness Analysis By Grade, 2022 – 2028
Figure 87: Eastern Europe Mixed Xylene Market Value Share and BPS Analysis By Application – 2022 & 2028
Figure 88: Eastern Europe Mixed Xylene Market Value Y-o-Y (%) Growth Projections By Application, 2021 – 2028
Figure 89: Eastern Europe Mixed Xylene Market Attractiveness Analysis By Application, 2022 – 2028
Figure 90: Eastern Europe Mixed Xylene Market Value Share and BPS Analysis By End Use – 2022 & 2028
Figure 91: Eastern Europe Mixed Xylene Market Value Y-o-Y (%) Growth Projections By End Use, 2021 – 2028
Figure 92: Eastern Europe Mixed Xylene Market Attractiveness Analysis By End Use, 2022 – 2028
Figure 93: Western Europe Mixed Xylene Market Value Share and BPS Analysis by Country – 2022 & 2028
Figure 94: Western Europe Mixed Xylene Market Value Y-o-Y (%) Growth Projections by Country, 2021 – 2028
Figure 95: Western Europe Mixed Xylene Market Attractiveness Analysis by Country, 2022 – 2028
Figure 96: Germany Mixed Xylene Market Absolute $ Opportunity, 2021 – 2028
Figure 97: Italy Mixed Xylene Market Absolute $ Opportunity, 2021 – 2028
Figure 98: France Mixed Xylene Market Absolute $ Opportunity, 2021 – 2028
Figure 99: U.K. Mixed Xylene Market Absolute $ Opportunity, 2021 – 2028
Figure 100: Spain Mixed Xylene Market Absolute $ Opportunity, 2021 – 2028
Figure 101: Rest of WE Mixed Xylene Market Absolute $ Opportunity, 2021 – 2028
Figure 102: Western Europe Mixed Xylene Market Value Share and BPS Analysis By Grade – 2022 & 2028
Figure 103: Western Europe Mixed Xylene Market Value Y-o-Y (%) Growth Projections By Grade, 2021 – 2028
Figure 104: Western Europe Mixed Xylene Market Attractiveness Analysis By Grade, 2022 – 2028
Figure 105: Western Europe Mixed Xylene Market Value Share and BPS Analysis By Application – 2022 & 2028
Figure 106: Western Europe Mixed Xylene Market Value Y-o-Y (%) Growth Projections By Application, 2021 – 2028
Figure 107: Western Europe Mixed Xylene Market Attractiveness Analysis By Application, 2022 – 2028
Figure 108: Western Europe Mixed Xylene Market Value Share and BPS Analysis By End Use – 2022 & 2028
Figure 109: Western Europe Mixed Xylene Market Value Y-o-Y (%) Growth Projections By End Use, 2021 – 2028
Figure 110: Western Europe Mixed Xylene Market Attractiveness Analysis By End Use, 2022 – 2028
Figure 111: MEA Mixed Xylene Market Value Share and BPS Analysis by Country – 2022 & 2028
Figure 112: MEA Mixed Xylene Market Value Y-o-Y (%) Growth Projections by Country, 2021 – 2028
Figure 113: MEA Mixed Xylene Market Attractiveness Analysis by Country, 2022 – 2028
Figure 114: GCC Countries Mixed Xylene Market Absolute $ Opportunity, 2021 – 2028
Figure 115: Egypt Mixed Xylene Market Absolute $ Opportunity, 2021 – 2028
Figure 116: South Africa Mixed Xylene Market Absolute $ Opportunity, 2021 – 2028
Figure 117: Rest of MEA Mixed Xylene Market Absolute $ Opportunity, 2021 – 2028
Figure 118: MEA Mixed Xylene Market Value Share and BPS Analysis By Grade – 2022 & 2028
Figure 119: MEA Mixed Xylene Market Value Y-o-Y (%) Growth Projections By Grade, 2021 – 2028
Figure 120: MEA Mixed Xylene Market Attractiveness Analysis By Grade, 2022 – 2028
Figure 121: MEA Mixed Xylene Market Value Share and BPS Analysis By Application – 2022 & 2028
Figure 122: MEA Mixed Xylene Market Value Y-o-Y (%) Growth Projections By Application, 2021 – 2028
Figure 123: MEA Mixed Xylene Market Attractiveness Analysis By Application, 2022 – 2028
Figure 124: MEA Mixed Xylene Market Value Share and BPS Analysis By End Use – 2022 & 2028
Figure 125: MEA Mixed Xylene Market Value Y-o-Y (%) Growth Projections By End Use, 2021 – 2028
Figure 126: MEA Mixed Xylene Market Attractiveness Analysis By End Use, 2022 – 2028
Figure 127: APEJC Mixed Xylene Market Value Share and BPS Analysis by Country – 2022 & 2028
Figure 128: APEJC Mixed Xylene Market Value Y-o-Y (%) Growth Projections by Country, 2021 – 2028
Figure 129: APEJC Mixed Xylene Market Attractiveness Analysis by Country, 2022 – 2028
Figure 130: India Mixed Xylene Market Absolute $ Opportunity, 2021 – 2028
Figure 131: S.Korea Mixed Xylene Market Absolute $ Opportunity, 2021 – 2028
Figure 132: ASEAN Mixed Xylene Market Absolute $ Opportunity, 2021 – 2028
Figure 133: ANZ Mixed Xylene Market Absolute $ Opportunity, 2021 – 2028
Figure 134: Rest of SEA Mixed Xylene Market Absolute $ Opportunity, 2021 – 2028
Figure 135: APEJC Mixed Xylene Market Value Share and BPS Analysis By Grade – 2022 & 2028
Figure 136: APEJC Mixed Xylene Market Value Y-o-Y (%) Growth Projections By Grade, 2021 – 2028
Figure 137: APEJC Mixed Xylene Market Attractiveness Analysis By Grade, 2022 – 2028
Figure 138: APEJC Mixed Xylene Market Value Share and BPS Analysis By Application – 2022 & 2028
Figure 139: APEJC Mixed Xylene Market Value Y-o-Y (%) Growth Projections By Application, 2021 – 2028
Figure 140: APEJC Mixed Xylene Market Attractiveness Analysis By Application, 2022 – 2028
Figure 141: APEJC Mixed Xylene Market Value Share and BPS Analysis By End Use – 2022 & 2028
Figure 142: APEJC Mixed Xylene Market Value Y-o-Y (%) Growth Projections By End Use, 2021 – 2028
Figure 143: APEJC Mixed Xylene Market Attractiveness Analysis By End Use, 2022 – 2028
Figure 144: China Mixed Xylene Market Value Share and BPS Analysis By Grade – 2022 & 2028
Figure 145: China Mixed Xylene Market Value Y-o-Y (%) Growth Projections By Grade, 2021 – 2028
Figure 146: China Mixed Xylene Market Attractiveness Analysis By Grade, 2022 – 2028
Figure 147: China Mixed Xylene Market Value Share and BPS Analysis By Application – 2022 & 2028
Figure 148: China Mixed Xylene Market Value Y-o-Y (%) Growth Projections By Application, 2021 – 2028
Figure 149: China Mixed Xylene Market Attractiveness Analysis By Application, 2022 – 2028
Figure 150: China Mixed Xylene Market Value Share and BPS Analysis By End Use – 2022 & 2028
Figure 151: China Mixed Xylene Market Value Y-o-Y (%) Growth Projections By End Use, 2021 – 2028
Figure 152: China Mixed Xylene Market Attractiveness Analysis By End Use, 2022 – 2028
Figure 153: Japan Mixed Xylene Market Value Share and BPS Analysis By Grade – 2022 & 2028
Figure 154: Japan Mixed Xylene Market Value Y-o-Y (%) Growth Projections By Grade, 2021 – 2028
Figure 155: Japan Mixed Xylene Market Attractiveness Analysis By Grade, 2022 – 2028
Figure 156: Japan Mixed Xylene Market Value Share and BPS Analysis By Application – 2022 & 2028
Figure 157: Japan Mixed Xylene Market Value Y-o-Y (%) Growth Projections By Application, 2021 – 2028
Figure 158: Japan Mixed Xylene Market Attractiveness Analysis By Application, 2022 – 2028
Figure 159: Japan Mixed Xylene Market Value Share and BPS Analysis By End Use – 2022 & 2028
Figure 160: Japan Mixed Xylene Market Value Y-o-Y (%) Growth Projections By End Use, 2021 – 2028
Figure 161: Japan Mixed Xylene Market Attractiveness Analysis By End Use, 2022 – 2028
Need specific information?
Request CustomizationExplore Chemicals & Materials Insights
View Reports