Mono-Material Packaging Market Size, Share, and Forecast Outlook 2025 to 2035

In 2025, the global mono-material packaging market is valued at USD 4.9 billion and is likely to reach USD 7.8 billion by 2035, growing at a CAGR of 4.8%. This expansion underscores increasing demand for recyclable, low-complexity packaging formats.
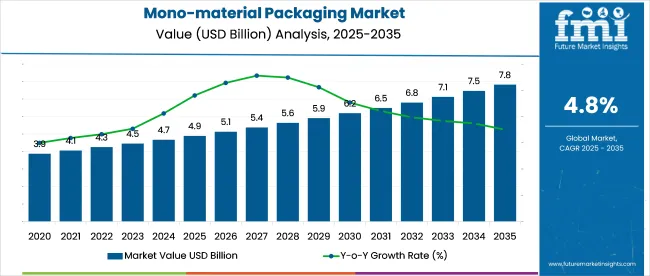
Quick Stats of Mono-Material Packaging Market

  • Market Value (2025): USD 4.9 billion
  • Forecast Value (2035): USD 7.8 billion
  • Forecast CAGR: 4.8%
  • Product Leader in 2025: Polyethylene (PE) - 62% market share
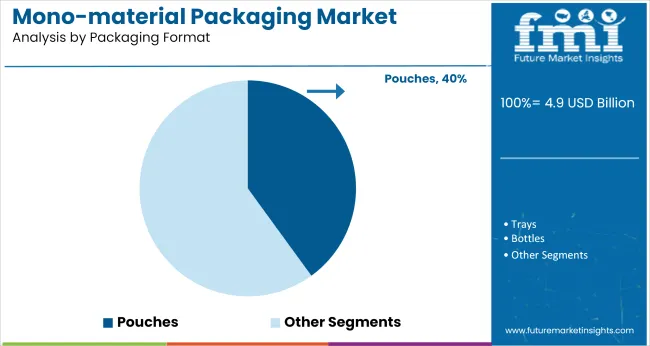
  • Top Distribution Channel: Flexible formats (e.g., pouches, films) - over 40% share
  • Key Growth Region: Europe - 50-55% of global demand
  • Leading Player: Amcor Plc -holding 11.5% market share

Mono Material Packaging Market

Key Market Indicators

Attribute Value
Market Size (2025) USD 4.9 billion
Market Size (2035) USD 7.8 billion
CAGR (2025 to 2035) 4.8%

Mono-material solutions-made from a single polymer such as PE or PP-are gaining traction across food, personal care, household, and e-commerce sectors. Ongoing advancements in film technologies are significantly enhancing durability and functionality. As regulatory expectations rise and consumers favor low-waste, recyclable options, brands are showcasing mono-material packaging to strengthen environmental alignment and reinforce consumer trust.

In April 2024, Dr. Nicolas Wiedmann, CEO of Siegwerk Druckfarben, emphasized that mono-material solutions can deliver high-barrier performance while enabling true circularity. Speaking in the Siegwerk-Borouge partnership announcement on recyclable HDPE pouches, he highlighted that their oxygen-barrier coating allows complete deinking during recycling, producing polyethylene suitable for new food-grade packaging. This innovation supports sustainable packaging by maintaining functionality while ensuring full recyclability.

The mono-material packaging market is reshaping packaging systems globally, with current adoption rates reflecting changing priorities. In flexible packaging, mono-materials now account for 28-32% of the market, becoming the top choice for brands moving away from complex laminates.

The food sector shows 22-25% uptake, especially for dry goods and dairy, while consumer goods reach 18-20%, driven by premium segments. Notably, mono-materials make up 35-40% of new packaging developments worldwide. Europe leads with 50-55% market presence, while North America follows at 35-40%. Asia’s 20-25% share is expanding quickly, supported by supply chain shifts.

Growth continues at 14-16% annually, with mono-materials expected to dominate 60% of eco-friendly packaging by 2030. Advances in high-performance mono-material films and recycling technologies are accelerating this shift, alongside stricter regulations and corporate environmental goals.

Analysing Mono-material Packaging Market by Top Investment Segments

The mono-material packaging market is increasingly shaped by material compatibility, format efficiency, and end-use application demands. Polyethylene-based structures dominate, while food packaging continues to drive the highest application volumes. In parallel, pouch formats and high-barrier solutions showcase accelerated adoption across sectors.
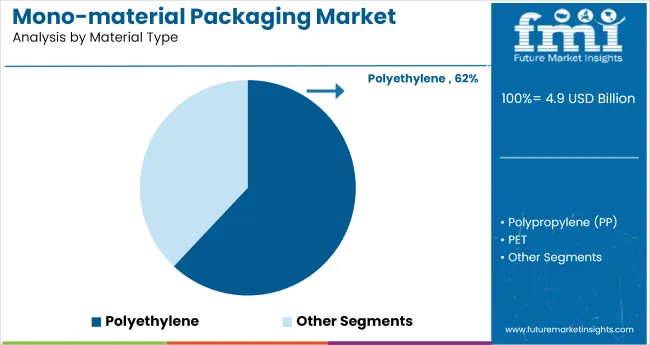
Polyethylene Leads Mono-material Demand with 62% Market Share in 2025

Mono Material Packaging Market Analysis By Material Type

Polyethylene (PE) remains the leading material in mono-material packaging, accounting for approximately 62% of total consumption. Its adoption is attributed to processing flexibility, thermoformability, and wide seal temperature range (110-140°C). PE supports both cast and blown extrusion lines, improving production adaptability across converters.

Film thickness typically ranges from 30-80 microns, enabling downgauging without loss of tensile strength. Key industry players-Amcor, Mondi, and Sealed Air-offer mono-PE films for flexible pouching, lidding films, and overwraps. PE films can handle elongation values up to 600%, ideal for high-speed stretch and form-fill-seal operations.

  • Supports downgauging initiatives through high elongation and strength-to-weight ratio
  • Maintains seal integrity at lower thermal thresholds, reducing energy usage per cycle
  • Allows up to 20-25% faster line throughput in co-extrusion film manufacturing

Food & Beverage Segment Dominates Use with 46% Application Share

Food and beverage packaging represents approximately 46% of the total application base for mono-material packaging. This demand is fueled by increasing output volumes across processed food, snacks, dairy, and chilled categories. Mono-material structures-primarily PE and PP-support barrier control, hot-fill, and MAP compatibility.

Manufacturers such as Constantia Flexibles, Coveris, and Berry Global supply solutions designed for oxygen transmission rates of <0.5 cc/m²/day, ensuring freshness retention for extended shelf life. Thermoformed trays and pillow pouches are commonly used, with fill lines operating at speeds up to 300 packs/minute.
  • Compatible with pasteurization and light retort processes up to 120°C
  • Offers sealing reliability even at ±2gram fill variation margins in automated lines
  • Optimizes line changeovers through reel-based lamination and standardized web widths

Pouch Formats Surpass 40% Share Due to Versatility & Speed

Mono Material Packaging Market Analysis By Packaging Format

Pouches account for over 40% of mono-material packaging format usage due to their favorable volume-to-material ratio and adaptable design configurations. Form-fill-seal systems using mono-PE or PP pouches operate at speeds of 300-400 units/min, making them highly efficient for large-scale production.

Brands like ProAmpac, Glenroy, and Huhtamaki offer stand-up, pillow, and gusseted pouches optimized for high-barrier product categories. Average pouch thickness lies between 50-80 microns, allowing excellent load-bearing capacity while maintaining print quality.
  • Enables up to 60-70% material savings over rigid equivalents
  • Compatible with reclose systems and laser scoring for portion dispensing
  • Supports full-bleed surface printing for high-shelf visibility and branding

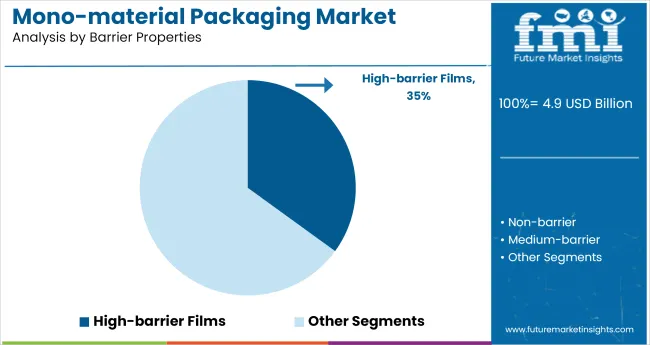
High-barrier Films Capture 35% of Moisture-sensitive Packaging Needs

Mono Material Packaging Market Analysis By Barrier Properties

High-barrier mono-material films are estimated to represent 35% of the total demand, addressing moisture- and oxygen-sensitive packaging applications. Barrier levels as low as 0.06 cc/m²/day (OTR) and <1.5 g/m²/day (WVTR) are achieved through EVOH-layer integration in PE or PP substrates.

Manufacturers like Jindal Films, Toray, and Mitsubishi Chemical offer 5-9 layer structures for vacuum packs, retort pouches, and medical-grade overwraps. These films endure sterilization cycles at 121°C and cold storage below to 20°C, making them suitable for ready meals, frozen items, and pet food.

  • Maintains structural stability during retort, without layer delamination or blistering
  • Uses <10% EVOH to retain recyclability without compromising barrier efficiency
  • Operates effectively across die widths up to 1,600 mm for wide-format rolls

Personal Care Packaging Commands 20% Share with Tube-based Formats

The personal care industry contributes approximately 20% to mono-material packaging demand, primarily in tubes, bottles, and dispensers. Mono-PE and PP structures are engineered to resist ambient humidity, frequent handling, and chemical abrasion from formulations. Tube diameters range from 19 to 50 mm, with standard wall thicknesses of 0.35-0.5 mm.

Key suppliers-Albéa, Essel Propack, and Skypack-offer extrusion-based tubes with in-line printing, ultrasonic sealing, and shoulder integration. Water vapor permeability thresholds below 3 g/m²/day ensure formulation stability for lotions, serums, and gels.

  • Accommodates up to 8-color decoration with minimal post-processing delays
  • Ensures compatibility with high-viscosity products via wide-aperture nozzles
  • Eliminates use of aluminum barriers, retaining product aesthetics and recyclability

Top Mono-material Packaging Market Dynamics

Mono-material packaging is gaining traction as brands replace multilayer films to meet recyclability targets and improve line efficiency. Growth remains uneven due to technical limits in barrier performance, resin price fluctuations, and lack of supporting infrastructure in key markets, particularly where recycling systems are not equipped to handle polymer-specific waste.

Compliance-Driven Substitution and Equipment Retooling

Mono-material packaging adoption has accelerated across food and ingredient segments as brands adjust to recyclability mandates and cost-efficiency targets. Between Q3 2024 and Q2 2025, mono-polyethylene and mono-polypropylene films replaced multi-layer laminates in 47% of new snack and legume SKUs launched in Germany, Spain, and the Netherlands.

Retrofitting of vertical form-fill-seal (VFFS) machines for single-polymer compatibility increased by 22% among contract packers in Poland and Turkey, reducing downtime and material mismatch errors. Suppliers of extrusion-coated mono-webs reported a 19% rise in quarterly orders from emerging markets, especially Kenya and Vietnam, where retailers now require EPR-compliant primary packaging for private-label goods.

Barrier Performance Limits and Recycling Infrastructure Gaps

Performance limitations in oxygen and moisture resistance continue to restrict mono-material usage in high-fat or high-moisture applications. Brands attempting to replace foil-lined structures in nut-based spreads and dairy powders reported shelf-life reductions of up to 27%, despite secondary barrier coatings.

In markets lacking robust recycling systems-such as parts of Sub-Saharan Africa and Southeast Asia-mono-material benefits remain unrealized, as single-polymer streams are not separately collected or processed. Price volatility in specialty PE and PP resins also impacted margins, with Q2 2025 spot prices up 13% YoY amid feedstock constraints. These constraints have slowed conversion plans for brands dependent on legacy filling systems that require broader heat-seal ranges.
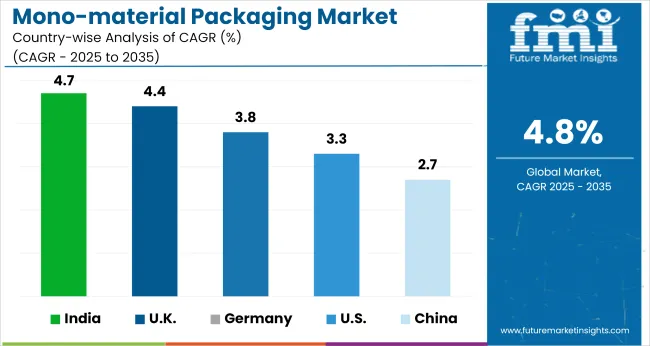
Top Countries Manufacturing, Synthesizing, Distributing, and Generating Demand for Mono-material Packaging

Mono Material Packaging Market Cagr Analysis By Country

Countries CAGR (2025 to 2035)
India 4.7%
UK 4.4%
Germany 3.8%
China 2.7%
USA 3.3%

Global demand for mono-material packaging is projected to grow at a 6.0% CAGR from 2025 to 2035. Among the five key markets reviewed, India (4.7%) and China (2.7%), both BRICS members, post growth well below the global benchmark. Similarly, OECD economies such as the UK (4.4%) and Germany (3.8%) are showing downturns, reflecting limited momentum in replacing multilayer structures.

The USA, also an OECD country, records a 3.3% CAGR-still below average, yet outperforming its counterparts. These figures reflect a sluggish shift toward simpler packaging formats across both industrialized and developing economies. Limited infrastructure for mono-material recovery, fragmented material policies, and reliance on traditional packaging methods continue to affect progress.

ASEAN markets, by contrast, are showing higher adaptability in adopting simplified and recyclable formats. Disparities in growth reflect both regulatory inertia and challenges in aligning local production systems with global shifts toward single-polymer packaging materials.

The report covers detailed analysis of 40+ countries, with the top five countries shared as a reference

Growth Analysis of Mono-material Packaging Market in the United States

In the United States, mono-material packaging demand is projected to rise from 1.25 million metric tons (MT) in 2025 to approximately 1.77 million MT by 2035, marking a 3.3% CAGR. Growth is largely underpinned by regulatory clarity on recyclability labeling, driven by the Federal Trade Commission and state-led EPR frameworks.

Major corporations are now mandating mono-material use in private-label packaging, especially for food, beverage, and e-commerce parcels. Notably, film-based mono-polyethylene solutions are being integrated into packaging automation lines to enhance cost efficiency while meeting recyclability guidelines.

  • Retailers like Walmart and Target now require mono-material compliance for over 60% of store-brand products.
  • California and New York are allocating funds toward mono-resin collection stream upgrades.
  • Smart-label integration in PE-based pouches is rising to support traceability and material tracking.

Demand Forecast for Mono-material Packaging Market in China

China’s mono-material packaging consumption is forecasted to drop from 3.4 million MT in 2025 to around 2.6 million MT by 2035, reflecting a 2.7% CAGR. While mono-materials initially gained traction in low-cost food packaging, shifting industrial goals have deprioritized them in favor of hybrid barrier solutions.

The 2024 revision of China’s Green Packaging Standards now encourages the use of multi-functional materials over single-substrate formats. At the same time, the boom in fresh produce delivery and smart logistics has favored performance-grade packaging, where mono-layer structures often underperform.

  • Functional laminates now represent 45% of flexible packaging output in urban supply chains.
  • Mono-material share in snack packaging declined by 18% between 2022 and 2024.
  • Provincial subsidies now favor performance-laminated pouches and multilayer films in perishable segments.

Future Outlook for Mono-material Packaging Market in the United Kingdom

The UK mono-material packaging segment is expected to fall from 670,000 MT in 2025 to 430,000 MT by 2035, translating to a 4.4% CAGR. Despite efforts under the UK Plastics Pact, the lack of consistency across municipal waste sorting systems continues to hinder mono-material feasibility.

Moreover, home-compostable packaging has seen a sharp uptick-particularly in fresh produce and bakery segments-reducing the footprint of synthetic single-substrate materials. The shift toward molded fiber trays and paper-based laminates is also being led by premium grocery chains and environmentally inclined SMEs.

  • Nearly 40% of bakery chains in the UK now use cellulose or paper-based wrap alternatives.
  • Only 21% of councils are currently equipped to separate mono-PE from mixed plastic streams.
  • Import volumes of mono-material films dropped 13% YoY in 2024 due to lower retailer uptake.

Analysis of Mono-material Packaging Market in Germany

Germany’s mono-material packaging volumes are forecasted to decline from 1.02 million MT in 2025 to 702,000 MT by 2035, registering a 3.8% CAGR. Here, mono-materials are often viewed as too limiting for sectors that demand barrier functionality and temperature resilience.

The country’s leading packaging R&D ecosystem is instead investing in chemically recyclable multilayer technologies and smart-pack interfaces. Regulatory compliance with the DIN EN 13430 standard has pushed brands to adopt complex yet recyclable alternatives that outperform single-polymer formats in shelf-life and transport efficiency.

  • Over €1.1 billion was allocated to recyclable multilayer R&D in 2024, surpassing mono-material investment.
  • PET-PE multilayers dominate 52% of dairy packaging formats across national retail shelves.
  • Cold-chain and pharma sectors have replaced mono-structures with foamed multilayer trays and smart barriers.

Analysis of Mono-material Packaging Market in India

India’s mono-material packaging demand is expected to contract from 2.85 million MT in 2025 to 1.78 million MT by 2035, reflecting a 4.7% CAGR-the steepest among major markets. The country’s fragmented supply chain, climate diversity, and rural distribution models have favored adaptive, hybrid materials over standardized single-layer films.

Furthermore, regulatory incentives under the Plastic Waste Management (Amendment) Rules, 2023 have fueled the adoption of starch-based and paper-laminate solutions. Indian brands operating in mid-tier markets are increasingly choosing cost-effective biodegradable or multi-functional options to meet local compliance and climate sensitivities.
  • Flexible laminates saw a 16% year-over-year rise in India’s packaged snacks and condiments sector.
  • Only 9% of municipal recycling systems can consistently sort and recover mono-material films.
  • Indigenous packaging start-ups are developing jute and bagasse-based wraps for consumer goods exports.

Leading Mono-material Packaging Suppliers Manufacturers, Suppliers, Distributors

Mono Material Packaging Market Analysis By Company

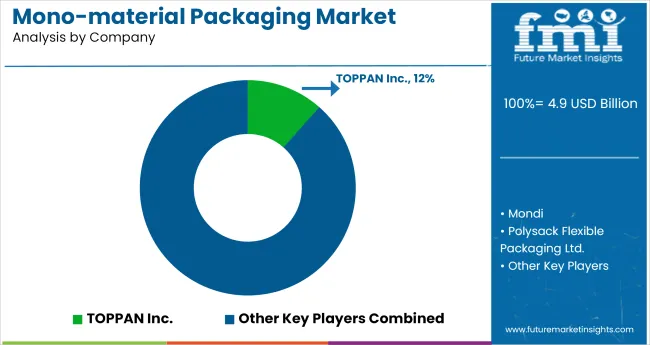
The packaging industry's move toward mono-material solutions continues to accelerate as both major players and startups develop new approaches to improve recyclability. Companies like Mondi have introduced polypropylene pouches designed specifically for easier recycling processes, while Amcor's partnership with Nestlé focuses on advancing flexible packaging alternatives.

At the same time, emerging innovators such as Polysack are gaining attention with their single-polymer shrink films, offering brands additional options for simplified material streams. The significant challenges remain for new market entrants, particularly around the specialized equipment requirements and complex regulatory standards needed for production.

These barriers give established packaging manufacturers an advantage, as their existing research capabilities and optimized supply chains allow them to maintain dominance in this competitive space. The result is a market where technological progress coexists with high entry thresholds, shaping an industry landscape where scale and experience provide clear benefits.

Recent Developments in Mono-Material Packaging Industry

  • January 2024, Mondi launched a new mono-material polypropylene (PP) pouch for pet food, designed for full recyclability in existing PP waste streams.
  • In March 2024, Amcor partnered with Danone to introduce a mono-material high-barrier flexible film for dairy products, eliminating the need for mixed-material layers.
  • In April 2024, TOPPAN Inc. developed a transparent mono-material film with oxygen and moisture barriers, targeting snack and dry food packaging.

Report Scope

Report Attributes Details
Market Size (2025) USD 4.9 billion
Projected Market Size (2035) USD 7.8 billion
CAGR (2025 to 2035) 4.8%
Base Year for Estimation 2024
Historical Period 2020 to 2024
Projections Period 2025 to 2035
Quantitative Units USD billion for value
Material Types Analyzed (Segment 1) Polyethylene (PE), Polypropylene (PP), PET, EVOH-based Structures
Packaging Formats Analyzed (Segment 2) Pouches, Trays, Bottles, Tubes, Films
Barrier Properties Analyzed (Segment 3) Non-barrier, Medium-barrier, High-barrier
Applications Analyzed (Segment 4) Food Packaging, Personal Care, Household, Pet Food
End-Use Industries Analyzed (Segment 5) FMCG, Food & Beverage, Cosmetics, Pharmaceuticals
Regions Covered North America; Latin America; Western Europe; Eastern Europe; East Asia; South Asia & Pacific; Middle East & Africa
Countries Covered United States, Canada, Germany, France, United Kingdom, China, Japan, India, Brazil, South Africa
Key Players Influencing the Market TOPPAN Inc., Mondi, Polysack Flexible Packaging Ltd., Dai Nippon Printing Co., Ltd., Amcor, Berry Global Inc., DIC ASIA PACIFIC PTE LTD, APC Packaging, Huhtamaki, Constantia Flexibles
Additional Attributes Dollar sales tracked by material type and packaging format; share by end-use sectors such as FMCG and personal care; increasing demand for recyclable and high-barrier mono-material structures; rising adoption in food and pet food packaging for extended shelf life; regional production hubs in East Asia and Western Europe driving export opportunities; brand owners shifting toward mono-materials to meet circular packaging goals

Leading players

  • TOPPAN Inc.
  • Mondi
  • Polysack Flexible Packaging Ltd.
  • Dai Nippon Printing Co., Ltd.
  • Amcor
  • Berry Global Inc.
  • DIC ASIA PACIFIC PTE LTD
  • APC Packaging
  • Huhtamaki
  • Constantia Flexibles

Mono-Material Packaging Market Analyzed by Key Investment Segments

By Material Type:

Polyethylene (PE), Polypropylene (PP), PET and EVOH-based Structures

By Packaging Format:

Pouches, Trays, Bottles, Tubes, and Films

By Barrier Properties:

Non-barrier, Medium-barrier, and High-barrier

By Application:

Food Packaging, Personal Care, Household, and Pet Food

By End-Use Industry:

FMCG, Food & Beverage, Cosmetics, and Pharmaceuticals

By Region:

North America, Europe, Asia-Pacific, Latin America, Middle East & Africa

Table of Content

  1. Executive Summary
    • Global Market Outlook
    • Demand-side Trends
    • Supply-side Trends
    • Technology Roadmap Analysis
    • Analysis and Recommendations
  2. Market Overview
    • Market Coverage / Taxonomy
    • Market Definition / Scope / Limitations
  3. Market Background
    • Market Dynamics
      • Drivers
      • Restraints
      • Opportunity
      • Trends
    • Scenario Forecast
      • Demand in Optimistic Scenario
      • Demand in Likely Scenario
      • Demand in Conservative Scenario
    • Opportunity Map Analysis
    • Product Life Cycle Analysis
    • Supply Chain Analysis
      • Supply Side Participants and their Roles
        • Producers
        • Mid-Level Participants (Traders/ Agents/ Brokers)
        • Wholesalers and Distributors
      • Value Added and Value Created at Node in the Supply Chain
      • List of Raw Material Suppliers
      • List of Existing and Potential Buyer’s
    • Investment Feasibility Matrix
    • Value Chain Analysis
      • Profit Margin Analysis
      • Wholesalers and Distributors
      • Retailers
    • PESTLE and Porter’s Analysis
    • Regulatory Landscape
      • By Key Regions
      • By Key Countries
    • Regional Parent Market Outlook
    • Production and Consumption Statistics
    • Import and Export Statistics
  4. Global Market Analysis 2020 to 2024 and Forecast, 2025 to 2035
    • Historical Market Size Value (USD Billion) & Volume (MT) Analysis, 2020 to 2024
    • Current and Future Market Size Value (USD Billion) & Volume (MT) Projections, 2025 to 2035
      • Y-o-Y Growth Trend Analysis
      • Absolute $ Opportunity Analysis
  5. Global Market Pricing Analysis 2020 to 2024 and Forecast 2025 to 2035
  6. Global Market Analysis 2020 to 2024 and Forecast 2025 to 2035, By Material Type
    • Introduction / Key Findings
    • Historical Market Size Value (USD Billion) & Volume (MT) Analysis By Material Type, 2020 to 2024
    • Current and Future Market Size Value (USD Billion) & Volume (MT) Analysis and Forecast By Material Type, 2025 to 2035
      • Polyethylene (PE)
      • Polypropylene (PP)
      • PET
      • EVOH-based Structures
    • Y-o-Y Growth Trend Analysis By Material Type, 2020 to 2024
    • Absolute $ Opportunity Analysis By Material Type, 2025 to 2035
  7. Global Market Analysis 2020 to 2024 and Forecast 2025 to 2035, By Packaging Format
    • Introduction / Key Findings
    • Historical Market Size Value (USD Billion) & Volume (MT) Analysis By Packaging Format, 2020 to 2024
    • Current and Future Market Size Value (USD Billion) & Volume (MT) Analysis and Forecast By Packaging Format, 2025 to 2035
      • Pouches
      • Trays
      • Bottles
      • Tubes
      • Films
    • Y-o-Y Growth Trend Analysis By Packaging Format, 2020 to 2024
    • Absolute $ Opportunity Analysis By Packaging Format, 2025 to 2035
  8. Global Market Analysis 2020 to 2024 and Forecast 2025 to 2035, By Barrier Properties
    • Introduction / Key Findings
    • Historical Market Size Value (USD Billion) & Volume (MT) Analysis By Barrier Properties, 2020 to 2024
    • Current and Future Market Size Value (USD Billion) & Volume (MT) Analysis and Forecast By Barrier Properties, 2025 to 2035
      • Non-barrier
      • Medium-barrier
      • High-barrier
    • Y-o-Y Growth Trend Analysis By Barrier Properties, 2020 to 2024
    • Absolute $ Opportunity Analysis By Barrier Properties, 2025 to 2035
  9. Global Market Analysis 2020 to 2024 and Forecast 2025 to 2035, By Application
    • Introduction / Key Findings
    • Historical Market Size Value (USD Billion) & Volume (MT) Analysis By Application, 2020 to 2024
    • Current and Future Market Size Value (USD Billion) & Volume (MT) Analysis and Forecast By Application, 2025 to 2035
      • Food Packaging
      • Personal Care
      • Household
      • Pet Food
    • Y-o-Y Growth Trend Analysis By Application, 2020 to 2024
    • Absolute $ Opportunity Analysis By Application, 2025 to 2035
  10. Global Market Analysis 2020 to 2024 and Forecast 2025 to 2035, By End-Use Industry
    • Introduction / Key Findings
    • Historical Market Size Value (USD Billion) & Volume (MT) Analysis By End-Use Industry, 2020 to 2024
    • Current and Future Market Size Value (USD Billion) & Volume (MT) Analysis and Forecast By End-Use Industry, 2025 to 2035
      • FMCG
      • Food & Beverage
      • Cosmetics
      • Pharmaceuticals
    • Y-o-Y Growth Trend Analysis By End-Use Industry, 2020 to 2024
    • Absolute $ Opportunity Analysis By End-Use Industry, 2025 to 2035
  11. Global Market Analysis 2020 to 2024 and Forecast 2025 to 2035, By Region
    • Introduction
    • Historical Market Size Value (USD Billion) & Volume (MT) Analysis By Region, 2020 to 2024
    • Current Market Size Value (USD Billion) & Volume (MT) Analysis and Forecast By Region, 2025 to 2035
      • North America
      • Latin America
      • Western Europe
      • Eastern Europe
      • East Asia
      • South Asia & Pacific
      • Middle East and Africa
    • Market Attractiveness Analysis By Region
  12. North America Market Analysis 2020 to 2024 and Forecast 2025 to 2035, By Country
    • Historical Market Size Value (USD Billion) & Volume (MT) Trend Analysis By Market Taxonomy, 2020 to 2024
    • Market Size Value (USD Billion) & Volume (MT) Forecast By Market Taxonomy, 2025 to 2035
      • By Country
        • USA
        • Canada
        • Mexico
      • By Material Type
      • By Packaging Format
      • By Barrier Properties
      • By Application
      • By End-Use Industry
    • Market Attractiveness Analysis
      • By Country
      • By Material Type
      • By Packaging Format
      • By Barrier Properties
      • By Application
      • By End-Use Industry
    • Key Takeaways
  13. Latin America Market Analysis 2020 to 2024 and Forecast 2025 to 2035, By Country
    • Historical Market Size Value (USD Billion) & Volume (MT) Trend Analysis By Market Taxonomy, 2020 to 2024
    • Market Size Value (USD Billion) & Volume (MT) Forecast By Market Taxonomy, 2025 to 2035
      • By Country
        • Brazil
        • Argentina
        • Rest of LATAM
      • By Material Type
      • By Packaging Format
      • By Barrier Properties
      • By Application
      • By End-Use Industry
    • Market Attractiveness Analysis
      • By Country
      • By Material Type
      • By Packaging Format
      • By Barrier Properties
      • By Application
      • By End-Use Industry
    • Key Takeaways
  14. Western Europe Market Analysis 2020 to 2024 and Forecast 2025 to 2035, By Country
    • Historical Market Size Value (USD Billion) & Volume (MT) Trend Analysis By Market Taxonomy, 2020 to 2024
    • Market Size Value (USD Billion) & Volume (MT) Forecast By Market Taxonomy, 2025 to 2035
      • By Country
        • Germany
        • Italy
        • France
        • UK
        • Spain
        • BENELUX
        • Nordic
        • Rest of W.Europe
      • By Material Type
      • By Packaging Format
      • By Barrier Properties
      • By Application
      • By End-Use Industry
    • Market Attractiveness Analysis
      • By Country
      • By Material Type
      • By Packaging Format
      • By Barrier Properties
      • By Application
      • By End-Use Industry
    • Key Takeaways
  15. Eastern Europe Market Analysis 2020 to 2024 and Forecast 2025 to 2035, By Country
    • Historical Market Size Value (USD Billion) & Volume (MT) Trend Analysis By Market Taxonomy, 2020 to 2024
    • Market Size Value (USD Billion) & Volume (MT) Forecast By Market Taxonomy, 2025 to 2035
      • By Country
        • Russia
        • Hungary
        • Poland
        • Balkan & Baltics
        • Rest of E. Europe
      • By Material Type
      • By Packaging Format
      • By Barrier Properties
      • By Application
      • By End-Use Industry
    • Market Attractiveness Analysis
      • By Country
      • By Material Type
      • By Packaging Format
      • By Barrier Properties
      • By Application
      • By End-Use Industry
    • Key Takeaways
  16. East Asia Market Analysis 2020 to 2024 and Forecast 2025 to 2035, By Country
    • Historical Market Size Value (USD Billion) & Volume (MT) Trend Analysis By Market Taxonomy, 2020 to 2024
    • Market Size Value (USD Billion) & Volume (MT) Forecast By Market Taxonomy, 2025 to 2035
      • By Country
        • China
        • Japan
        • South Korea
      • By Material Type
      • By Packaging Format
      • By Barrier Properties
      • By Application
      • By End-Use Industry
    • Market Attractiveness Analysis
      • By Country
      • By Material Type
      • By Packaging Format
      • By Barrier Properties
      • By Application
      • By End-Use Industry
    • Key Takeaways
  17. South Asia & Pacific Market Analysis 2020 to 2024 and Forecast 2025 to 2035, By Country
    • Historical Market Size Value (USD Billion) & Volume (MT) Trend Analysis By Market Taxonomy, 2020 to 2024
    • Market Size Value (USD Billion) & Volume (MT) Forecast By Market Taxonomy, 2025 to 2035
      • By Country
        • India
        • Australia & New Zealand
        • ASEAN
        • Rest of SAP
      • By Material Type
      • By Packaging Format
      • By Barrier Properties
      • By Application
      • By End-Use Industry
    • Market Attractiveness Analysis
      • By Country
      • By Material Type
      • By Packaging Format
      • By Barrier Properties
      • By Application
      • By End-Use Industry
    • Key Takeaways
  18. Middle East and Africa Market Analysis 2020 to 2024 and Forecast 2025 to 2035, By Country
    • Historical Market Size Value (USD Billion) & Volume (MT) Trend Analysis By Market Taxonomy, 2020 to 2024
    • Market Size Value (USD Billion) & Volume (MT) Forecast By Market Taxonomy, 2025 to 2035
      • By Country
        • GCC Countries
        • Northern Africa
        • South Africa
        • Turkiye
        • Rest of MEA
      • By Material Type
      • By Packaging Format
      • By Barrier Properties
      • By Application
      • By End-Use Industry
    • Market Attractiveness Analysis
      • By Country
      • By Material Type
      • By Packaging Format
      • By Barrier Properties
      • By Application
      • By End-Use Industry
    • Key Takeaways
  19. Key Countries Market Analysis
    • USA
      • Pricing Analysis
      • Market Share Analysis, 2024
        • By Material Type
        • By Packaging Format
        • By Barrier Properties
        • By Application
        • By End-Use Industry
    • Canada
      • Pricing Analysis
      • Market Share Analysis, 2024
        • By Material Type
        • By Packaging Format
        • By Barrier Properties
        • By Application
        • By End-Use Industry
    • Brazil
      • Pricing Analysis
      • Market Share Analysis, 2024
        • By Material Type
        • By Packaging Format
        • By Barrier Properties
        • By Application
        • By End-Use Industry
    • Mexico
      • Pricing Analysis
      • Market Share Analysis, 2024
        • By Material Type
        • By Packaging Format
        • By Barrier Properties
        • By Application
        • By End-Use Industry
    • Argentina
      • Pricing Analysis
      • Market Share Analysis, 2024
        • By Material Type
        • By Packaging Format
        • By Barrier Properties
        • By Application
        • By End-Use Industry
  20. Market Structure Analysis
    • Competition Dashboard
    • Competition Benchmarking
    • Market Share Analysis of Top Players
      • By Regional
      • By Material Type
      • By Packaging Format
      • By Barrier Properties
      • By Application
      • By End-Use Industry
  21. Competition Analysis
    • Competition Deep Dive
      • TOPPAN Inc.
        • Overview
        • Product Portfolio
        • Profitability by Market Segments (Product/Age /Sales Channel/Region)
        • Sales Footprint
        • Strategy Overview
          • Marketing Strategy
          • Product Strategy
          • Channel Strategy
      • Mondi
        • Overview
        • Product Portfolio
        • Profitability by Market Segments (Product/Age /Sales Channel/Region)
        • Sales Footprint
        • Strategy Overview
          • Marketing Strategy
          • Product Strategy
          • Channel Strategy
      • Polysack Flexible Packaging Ltd.
        • Overview
        • Product Portfolio
        • Profitability by Market Segments (Product/Age /Sales Channel/Region)
        • Sales Footprint
        • Strategy Overview
          • Marketing Strategy
          • Product Strategy
          • Channel Strategy
      • Dai Nippon Printing Co., Ltd.
        • Overview
        • Product Portfolio
        • Profitability by Market Segments (Product/Age /Sales Channel/Region)
        • Sales Footprint
        • Strategy Overview
          • Marketing Strategy
          • Product Strategy
          • Channel Strategy
      • Amcor
        • Overview
        • Product Portfolio
        • Profitability by Market Segments (Product/Age /Sales Channel/Region)
        • Sales Footprint
        • Strategy Overview
          • Marketing Strategy
          • Product Strategy
          • Channel Strategy
      • Berry Global Inc.
        • Overview
        • Product Portfolio
        • Profitability by Market Segments (Product/Age /Sales Channel/Region)
        • Sales Footprint
        • Strategy Overview
          • Marketing Strategy
          • Product Strategy
          • Channel Strategy
      • DIC ASIA PACIFIC PTE LTD
        • Overview
        • Product Portfolio
        • Profitability by Market Segments (Product/Age /Sales Channel/Region)
        • Sales Footprint
        • Strategy Overview
          • Marketing Strategy
          • Product Strategy
          • Channel Strategy
      • APC Packaging
        • Overview
        • Product Portfolio
        • Profitability by Market Segments (Product/Age /Sales Channel/Region)
        • Sales Footprint
        • Strategy Overview
          • Marketing Strategy
          • Product Strategy
          • Channel Strategy
      • Huhtamaki
        • Overview
        • Product Portfolio
        • Profitability by Market Segments (Product/Age /Sales Channel/Region)
        • Sales Footprint
        • Strategy Overview
          • Marketing Strategy
          • Product Strategy
          • Channel Strategy
      • Constantia Flexibles
        • Overview
        • Product Portfolio
        • Profitability by Market Segments (Product/Age /Sales Channel/Region)
        • Sales Footprint
        • Strategy Overview
          • Marketing Strategy
          • Product Strategy
          • Channel Strategy
  22. Assumptions & Acronyms Used
  23. Research Methodology

List of Tables

  • Table 1: Global Market Value (USD Billion) Forecast by Region, 2020 to 2035
  • Table 2: Global Market Volume (MT) Forecast by Region, 2020 to 2035
  • Table 3: Global Market Value (USD Billion) Forecast by Material Type, 2020 to 2035
  • Table 4: Global Market Volume (MT) Forecast by Material Type, 2020 to 2035
  • Table 5: Global Market Value (USD Billion) Forecast by Packaging Format, 2020 to 2035
  • Table 6: Global Market Volume (MT) Forecast by Packaging Format, 2020 to 2035
  • Table 7: Global Market Value (USD Billion) Forecast by Barrier Properties, 2020 to 2035
  • Table 8: Global Market Volume (MT) Forecast by Barrier Properties, 2020 to 2035
  • Table 9: Global Market Value (USD Billion) Forecast by Application, 2020 to 2035
  • Table 10: Global Market Volume (MT) Forecast by Application, 2020 to 2035
  • Table 11: Global Market Value (USD Billion) Forecast by End-Use Industry, 2020 to 2035
  • Table 12: Global Market Volume (MT) Forecast by End-Use Industry, 2020 to 2035
  • Table 13: North America Market Value (USD Billion) Forecast by Country, 2020 to 2035
  • Table 14: North America Market Volume (MT) Forecast by Country, 2020 to 2035
  • Table 15: North America Market Value (USD Billion) Forecast by Material Type, 2020 to 2035
  • Table 16: North America Market Volume (MT) Forecast by Material Type, 2020 to 2035
  • Table 17: North America Market Value (USD Billion) Forecast by Packaging Format, 2020 to 2035
  • Table 18: North America Market Volume (MT) Forecast by Packaging Format, 2020 to 2035
  • Table 19: North America Market Value (USD Billion) Forecast by Barrier Properties, 2020 to 2035
  • Table 20: North America Market Volume (MT) Forecast by Barrier Properties, 2020 to 2035
  • Table 21: North America Market Value (USD Billion) Forecast by Application, 2020 to 2035
  • Table 22: North America Market Volume (MT) Forecast by Application, 2020 to 2035
  • Table 23: North America Market Value (USD Billion) Forecast by End-Use Industry, 2020 to 2035
  • Table 24: North America Market Volume (MT) Forecast by End-Use Industry, 2020 to 2035
  • Table 25: Latin America Market Value (USD Billion) Forecast by Country, 2020 to 2035
  • Table 26: Latin America Market Volume (MT) Forecast by Country, 2020 to 2035
  • Table 27: Latin America Market Value (USD Billion) Forecast by Material Type, 2020 to 2035
  • Table 28: Latin America Market Volume (MT) Forecast by Material Type, 2020 to 2035
  • Table 29: Latin America Market Value (USD Billion) Forecast by Packaging Format, 2020 to 2035
  • Table 30: Latin America Market Volume (MT) Forecast by Packaging Format, 2020 to 2035
  • Table 31: Latin America Market Value (USD Billion) Forecast by Barrier Properties, 2020 to 2035
  • Table 32: Latin America Market Volume (MT) Forecast by Barrier Properties, 2020 to 2035
  • Table 33: Latin America Market Value (USD Billion) Forecast by Application, 2020 to 2035
  • Table 34: Latin America Market Volume (MT) Forecast by Application, 2020 to 2035
  • Table 35: Latin America Market Value (USD Billion) Forecast by End-Use Industry, 2020 to 2035
  • Table 36: Latin America Market Volume (MT) Forecast by End-Use Industry, 2020 to 2035
  • Table 37: Western Europe Market Value (USD Billion) Forecast by Country, 2020 to 2035
  • Table 38: Western Europe Market Volume (MT) Forecast by Country, 2020 to 2035
  • Table 39: Western Europe Market Value (USD Billion) Forecast by Material Type, 2020 to 2035
  • Table 40: Western Europe Market Volume (MT) Forecast by Material Type, 2020 to 2035
  • Table 41: Western Europe Market Value (USD Billion) Forecast by Packaging Format, 2020 to 2035
  • Table 42: Western Europe Market Volume (MT) Forecast by Packaging Format, 2020 to 2035
  • Table 43: Western Europe Market Value (USD Billion) Forecast by Barrier Properties, 2020 to 2035
  • Table 44: Western Europe Market Volume (MT) Forecast by Barrier Properties, 2020 to 2035
  • Table 45: Western Europe Market Value (USD Billion) Forecast by Application, 2020 to 2035
  • Table 46: Western Europe Market Volume (MT) Forecast by Application, 2020 to 2035
  • Table 47: Western Europe Market Value (USD Billion) Forecast by End-Use Industry, 2020 to 2035
  • Table 48: Western Europe Market Volume (MT) Forecast by End-Use Industry, 2020 to 2035
  • Table 49: Eastern Europe Market Value (USD Billion) Forecast by Country, 2020 to 2035
  • Table 50: Eastern Europe Market Volume (MT) Forecast by Country, 2020 to 2035
  • Table 51: Eastern Europe Market Value (USD Billion) Forecast by Material Type, 2020 to 2035
  • Table 52: Eastern Europe Market Volume (MT) Forecast by Material Type, 2020 to 2035
  • Table 53: Eastern Europe Market Value (USD Billion) Forecast by Packaging Format, 2020 to 2035
  • Table 54: Eastern Europe Market Volume (MT) Forecast by Packaging Format, 2020 to 2035
  • Table 55: Eastern Europe Market Value (USD Billion) Forecast by Barrier Properties, 2020 to 2035
  • Table 56: Eastern Europe Market Volume (MT) Forecast by Barrier Properties, 2020 to 2035
  • Table 57: Eastern Europe Market Value (USD Billion) Forecast by Application, 2020 to 2035
  • Table 58: Eastern Europe Market Volume (MT) Forecast by Application, 2020 to 2035
  • Table 59: Eastern Europe Market Value (USD Billion) Forecast by End-Use Industry, 2020 to 2035
  • Table 60: Eastern Europe Market Volume (MT) Forecast by End-Use Industry, 2020 to 2035
  • Table 61: East Asia Market Value (USD Billion) Forecast by Country, 2020 to 2035
  • Table 62: East Asia Market Volume (MT) Forecast by Country, 2020 to 2035
  • Table 63: East Asia Market Value (USD Billion) Forecast by Material Type, 2020 to 2035
  • Table 64: East Asia Market Volume (MT) Forecast by Material Type, 2020 to 2035
  • Table 65: East Asia Market Value (USD Billion) Forecast by Packaging Format, 2020 to 2035
  • Table 66: East Asia Market Volume (MT) Forecast by Packaging Format, 2020 to 2035
  • Table 67: East Asia Market Value (USD Billion) Forecast by Barrier Properties, 2020 to 2035
  • Table 68: East Asia Market Volume (MT) Forecast by Barrier Properties, 2020 to 2035
  • Table 69: East Asia Market Value (USD Billion) Forecast by Application, 2020 to 2035
  • Table 70: East Asia Market Volume (MT) Forecast by Application, 2020 to 2035
  • Table 71: East Asia Market Value (USD Billion) Forecast by End-Use Industry, 2020 to 2035
  • Table 72: East Asia Market Volume (MT) Forecast by End-Use Industry, 2020 to 2035
  • Table 73: South Asia & Pacific Market Value (USD Billion) Forecast by Country, 2020 to 2035
  • Table 74: South Asia & Pacific Market Volume (MT) Forecast by Country, 2020 to 2035
  • Table 75: South Asia & Pacific Market Value (USD Billion) Forecast by Material Type, 2020 to 2035
  • Table 76: South Asia & Pacific Market Volume (MT) Forecast by Material Type, 2020 to 2035
  • Table 77: South Asia & Pacific Market Value (USD Billion) Forecast by Packaging Format, 2020 to 2035
  • Table 78: South Asia & Pacific Market Volume (MT) Forecast by Packaging Format, 2020 to 2035
  • Table 79: South Asia & Pacific Market Value (USD Billion) Forecast by Barrier Properties, 2020 to 2035
  • Table 80: South Asia & Pacific Market Volume (MT) Forecast by Barrier Properties, 2020 to 2035
  • Table 81: South Asia & Pacific Market Value (USD Billion) Forecast by Application, 2020 to 2035
  • Table 82: South Asia & Pacific Market Volume (MT) Forecast by Application, 2020 to 2035
  • Table 83: South Asia & Pacific Market Value (USD Billion) Forecast by End-Use Industry, 2020 to 2035
  • Table 84: South Asia & Pacific Market Volume (MT) Forecast by End-Use Industry, 2020 to 2035
  • Table 85: Middle East and Africa Market Value (USD Billion) Forecast by Country, 2020 to 2035
  • Table 86: Middle East and Africa Market Volume (MT) Forecast by Country, 2020 to 2035
  • Table 87: Middle East and Africa Market Value (USD Billion) Forecast by Material Type, 2020 to 2035
  • Table 88: Middle East and Africa Market Volume (MT) Forecast by Material Type, 2020 to 2035
  • Table 89: Middle East and Africa Market Value (USD Billion) Forecast by Packaging Format, 2020 to 2035
  • Table 90: Middle East and Africa Market Volume (MT) Forecast by Packaging Format, 2020 to 2035
  • Table 91: Middle East and Africa Market Value (USD Billion) Forecast by Barrier Properties, 2020 to 2035
  • Table 92: Middle East and Africa Market Volume (MT) Forecast by Barrier Properties, 2020 to 2035
  • Table 93: Middle East and Africa Market Value (USD Billion) Forecast by Application, 2020 to 2035
  • Table 94: Middle East and Africa Market Volume (MT) Forecast by Application, 2020 to 2035
  • Table 95: Middle East and Africa Market Value (USD Billion) Forecast by End-Use Industry, 2020 to 2035
  • Table 96: Middle East and Africa Market Volume (MT) Forecast by End-Use Industry, 2020 to 2035

List of Figures

  • Figure 1: Global Market Volume (MT) Forecast 2020 to 2035
  • Figure 2: Global Market Pricing Analysis
  • Figure 3: Global Market Value (USD Billion) Forecast 2020 to 2035
  • Figure 4: Global Market Value Share and BPS Analysis by Material Type, 2025 and 2035
  • Figure 5: Global Market Y-o-Y Growth Comparison by Material Type, 2025 to 2035
  • Figure 6: Global Market Attractiveness Analysis by Material Type
  • Figure 7: Global Market Value Share and BPS Analysis by Packaging Format, 2025 and 2035
  • Figure 8: Global Market Y-o-Y Growth Comparison by Packaging Format, 2025 to 2035
  • Figure 9: Global Market Attractiveness Analysis by Packaging Format
  • Figure 10: Global Market Value Share and BPS Analysis by Barrier Properties, 2025 and 2035
  • Figure 11: Global Market Y-o-Y Growth Comparison by Barrier Properties, 2025 to 2035
  • Figure 12: Global Market Attractiveness Analysis by Barrier Properties
  • Figure 13: Global Market Value Share and BPS Analysis by Application, 2025 and 2035
  • Figure 14: Global Market Y-o-Y Growth Comparison by Application, 2025 to 2035
  • Figure 15: Global Market Attractiveness Analysis by Application
  • Figure 16: Global Market Value Share and BPS Analysis by End-Use Industry, 2025 and 2035
  • Figure 17: Global Market Y-o-Y Growth Comparison by End-Use Industry, 2025 to 2035
  • Figure 18: Global Market Attractiveness Analysis by End-Use Industry
  • Figure 19: Global Market Value (USD Billion) Share and BPS Analysis by Region, 2025 and 2035
  • Figure 20: Global Market Y-o-Y Growth Comparison by Region, 2025 to 2035
  • Figure 21: Global Market Attractiveness Analysis by Region
  • Figure 22: North America Market Incremental $ Opportunity, 2025 to 2035
  • Figure 23: Latin America Market Incremental $ Opportunity, 2025 to 2035
  • Figure 24: Western Europe Market Incremental $ Opportunity, 2025 to 2035
  • Figure 25: Eastern Europe Market Incremental $ Opportunity, 2025 to 2035
  • Figure 26: East Asia Market Incremental $ Opportunity, 2025 to 2035
  • Figure 27: South Asia & Pacific Market Incremental $ Opportunity, 2025 to 2035
  • Figure 28: Middle East and Africa Market Incremental $ Opportunity, 2025 to 2035
  • Figure 29: North America Market Value Share and BPS Analysis by Country, 2025 and 2035
  • Figure 30: North America Market Value Share and BPS Analysis by Material Type, 2025 and 2035
  • Figure 31: North America Market Y-o-Y Growth Comparison by Material Type, 2025 to 2035
  • Figure 32: North America Market Attractiveness Analysis by Material Type
  • Figure 33: North America Market Value Share and BPS Analysis by Packaging Format, 2025 and 2035
  • Figure 34: North America Market Y-o-Y Growth Comparison by Packaging Format, 2025 to 2035
  • Figure 35: North America Market Attractiveness Analysis by Packaging Format
  • Figure 36: North America Market Value Share and BPS Analysis by Barrier Properties, 2025 and 2035
  • Figure 37: North America Market Y-o-Y Growth Comparison by Barrier Properties, 2025 to 2035
  • Figure 38: North America Market Attractiveness Analysis by Barrier Properties
  • Figure 39: North America Market Value Share and BPS Analysis by Application, 2025 and 2035
  • Figure 40: North America Market Y-o-Y Growth Comparison by Application, 2025 to 2035
  • Figure 41: North America Market Attractiveness Analysis by Application
  • Figure 42: North America Market Value Share and BPS Analysis by End-Use Industry, 2025 and 2035
  • Figure 43: North America Market Y-o-Y Growth Comparison by End-Use Industry, 2025 to 2035
  • Figure 44: North America Market Attractiveness Analysis by End-Use Industry
  • Figure 45: Latin America Market Value Share and BPS Analysis by Country, 2025 and 2035
  • Figure 46: Latin America Market Value Share and BPS Analysis by Material Type, 2025 and 2035
  • Figure 47: Latin America Market Y-o-Y Growth Comparison by Material Type, 2025 to 2035
  • Figure 48: Latin America Market Attractiveness Analysis by Material Type
  • Figure 49: Latin America Market Value Share and BPS Analysis by Packaging Format, 2025 and 2035
  • Figure 50: Latin America Market Y-o-Y Growth Comparison by Packaging Format, 2025 to 2035
  • Figure 51: Latin America Market Attractiveness Analysis by Packaging Format
  • Figure 52: Latin America Market Value Share and BPS Analysis by Barrier Properties, 2025 and 2035
  • Figure 53: Latin America Market Y-o-Y Growth Comparison by Barrier Properties, 2025 to 2035
  • Figure 54: Latin America Market Attractiveness Analysis by Barrier Properties
  • Figure 55: Latin America Market Value Share and BPS Analysis by Application, 2025 and 2035
  • Figure 56: Latin America Market Y-o-Y Growth Comparison by Application, 2025 to 2035
  • Figure 57: Latin America Market Attractiveness Analysis by Application
  • Figure 58: Latin America Market Value Share and BPS Analysis by End-Use Industry, 2025 and 2035
  • Figure 59: Latin America Market Y-o-Y Growth Comparison by End-Use Industry, 2025 to 2035
  • Figure 60: Latin America Market Attractiveness Analysis by End-Use Industry
  • Figure 61: Western Europe Market Value Share and BPS Analysis by Country, 2025 and 2035
  • Figure 62: Western Europe Market Value Share and BPS Analysis by Material Type, 2025 and 2035
  • Figure 63: Western Europe Market Y-o-Y Growth Comparison by Material Type, 2025 to 2035
  • Figure 64: Western Europe Market Attractiveness Analysis by Material Type
  • Figure 65: Western Europe Market Value Share and BPS Analysis by Packaging Format, 2025 and 2035
  • Figure 66: Western Europe Market Y-o-Y Growth Comparison by Packaging Format, 2025 to 2035
  • Figure 67: Western Europe Market Attractiveness Analysis by Packaging Format
  • Figure 68: Western Europe Market Value Share and BPS Analysis by Barrier Properties, 2025 and 2035
  • Figure 69: Western Europe Market Y-o-Y Growth Comparison by Barrier Properties, 2025 to 2035
  • Figure 70: Western Europe Market Attractiveness Analysis by Barrier Properties
  • Figure 71: Western Europe Market Value Share and BPS Analysis by Application, 2025 and 2035
  • Figure 72: Western Europe Market Y-o-Y Growth Comparison by Application, 2025 to 2035
  • Figure 73: Western Europe Market Attractiveness Analysis by Application
  • Figure 74: Western Europe Market Value Share and BPS Analysis by End-Use Industry, 2025 and 2035
  • Figure 75: Western Europe Market Y-o-Y Growth Comparison by End-Use Industry, 2025 to 2035
  • Figure 76: Western Europe Market Attractiveness Analysis by End-Use Industry
  • Figure 77: Eastern Europe Market Value Share and BPS Analysis by Country, 2025 and 2035
  • Figure 78: Eastern Europe Market Value Share and BPS Analysis by Material Type, 2025 and 2035
  • Figure 79: Eastern Europe Market Y-o-Y Growth Comparison by Material Type, 2025 to 2035
  • Figure 80: Eastern Europe Market Attractiveness Analysis by Material Type
  • Figure 81: Eastern Europe Market Value Share and BPS Analysis by Packaging Format, 2025 and 2035
  • Figure 82: Eastern Europe Market Y-o-Y Growth Comparison by Packaging Format, 2025 to 2035
  • Figure 83: Eastern Europe Market Attractiveness Analysis by Packaging Format
  • Figure 84: Eastern Europe Market Value Share and BPS Analysis by Barrier Properties, 2025 and 2035
  • Figure 85: Eastern Europe Market Y-o-Y Growth Comparison by Barrier Properties, 2025 to 2035
  • Figure 86: Eastern Europe Market Attractiveness Analysis by Barrier Properties
  • Figure 87: Eastern Europe Market Value Share and BPS Analysis by Application, 2025 and 2035
  • Figure 88: Eastern Europe Market Y-o-Y Growth Comparison by Application, 2025 to 2035
  • Figure 89: Eastern Europe Market Attractiveness Analysis by Application
  • Figure 90: Eastern Europe Market Value Share and BPS Analysis by End-Use Industry, 2025 and 2035
  • Figure 91: Eastern Europe Market Y-o-Y Growth Comparison by End-Use Industry, 2025 to 2035
  • Figure 92: Eastern Europe Market Attractiveness Analysis by End-Use Industry
  • Figure 93: East Asia Market Value Share and BPS Analysis by Country, 2025 and 2035
  • Figure 94: East Asia Market Value Share and BPS Analysis by Material Type, 2025 and 2035
  • Figure 95: East Asia Market Y-o-Y Growth Comparison by Material Type, 2025 to 2035
  • Figure 96: East Asia Market Attractiveness Analysis by Material Type
  • Figure 97: East Asia Market Value Share and BPS Analysis by Packaging Format, 2025 and 2035
  • Figure 98: East Asia Market Y-o-Y Growth Comparison by Packaging Format, 2025 to 2035
  • Figure 99: East Asia Market Attractiveness Analysis by Packaging Format
  • Figure 100: East Asia Market Value Share and BPS Analysis by Barrier Properties, 2025 and 2035
  • Figure 101: East Asia Market Y-o-Y Growth Comparison by Barrier Properties, 2025 to 2035
  • Figure 102: East Asia Market Attractiveness Analysis by Barrier Properties
  • Figure 103: East Asia Market Value Share and BPS Analysis by Application, 2025 and 2035
  • Figure 104: East Asia Market Y-o-Y Growth Comparison by Application, 2025 to 2035
  • Figure 105: East Asia Market Attractiveness Analysis by Application
  • Figure 106: East Asia Market Value Share and BPS Analysis by End-Use Industry, 2025 and 2035
  • Figure 107: East Asia Market Y-o-Y Growth Comparison by End-Use Industry, 2025 to 2035
  • Figure 108: East Asia Market Attractiveness Analysis by End-Use Industry
  • Figure 109: South Asia & Pacific Market Value Share and BPS Analysis by Country, 2025 and 2035
  • Figure 110: South Asia & Pacific Market Value Share and BPS Analysis by Material Type, 2025 and 2035
  • Figure 111: South Asia & Pacific Market Y-o-Y Growth Comparison by Material Type, 2025 to 2035
  • Figure 112: South Asia & Pacific Market Attractiveness Analysis by Material Type
  • Figure 113: South Asia & Pacific Market Value Share and BPS Analysis by Packaging Format, 2025 and 2035
  • Figure 114: South Asia & Pacific Market Y-o-Y Growth Comparison by Packaging Format, 2025 to 2035
  • Figure 115: South Asia & Pacific Market Attractiveness Analysis by Packaging Format
  • Figure 116: South Asia & Pacific Market Value Share and BPS Analysis by Barrier Properties, 2025 and 2035
  • Figure 117: South Asia & Pacific Market Y-o-Y Growth Comparison by Barrier Properties, 2025 to 2035
  • Figure 118: South Asia & Pacific Market Attractiveness Analysis by Barrier Properties
  • Figure 119: South Asia & Pacific Market Value Share and BPS Analysis by Application, 2025 and 2035
  • Figure 120: South Asia & Pacific Market Y-o-Y Growth Comparison by Application, 2025 to 2035
  • Figure 121: South Asia & Pacific Market Attractiveness Analysis by Application
  • Figure 122: South Asia & Pacific Market Value Share and BPS Analysis by End-Use Industry, 2025 and 2035
  • Figure 123: South Asia & Pacific Market Y-o-Y Growth Comparison by End-Use Industry, 2025 to 2035
  • Figure 124: South Asia & Pacific Market Attractiveness Analysis by End-Use Industry
  • Figure 125: Middle East and Africa Market Value Share and BPS Analysis by Country, 2025 and 2035
  • Figure 126: Middle East and Africa Market Value Share and BPS Analysis by Material Type, 2025 and 2035
  • Figure 127: Middle East and Africa Market Y-o-Y Growth Comparison by Material Type, 2025 to 2035
  • Figure 128: Middle East and Africa Market Attractiveness Analysis by Material Type
  • Figure 129: Middle East and Africa Market Value Share and BPS Analysis by Packaging Format, 2025 and 2035
  • Figure 130: Middle East and Africa Market Y-o-Y Growth Comparison by Packaging Format, 2025 to 2035
  • Figure 131: Middle East and Africa Market Attractiveness Analysis by Packaging Format
  • Figure 132: Middle East and Africa Market Value Share and BPS Analysis by Barrier Properties, 2025 and 2035
  • Figure 133: Middle East and Africa Market Y-o-Y Growth Comparison by Barrier Properties, 2025 to 2035
  • Figure 134: Middle East and Africa Market Attractiveness Analysis by Barrier Properties
  • Figure 135: Middle East and Africa Market Value Share and BPS Analysis by Application, 2025 and 2035
  • Figure 136: Middle East and Africa Market Y-o-Y Growth Comparison by Application, 2025 to 2035
  • Figure 137: Middle East and Africa Market Attractiveness Analysis by Application
  • Figure 138: Middle East and Africa Market Value Share and BPS Analysis by End-Use Industry, 2025 and 2035
  • Figure 139: Middle East and Africa Market Y-o-Y Growth Comparison by End-Use Industry, 2025 to 2035
  • Figure 140: Middle East and Africa Market Attractiveness Analysis by End-Use Industry
  • Figure 141: Global Market - Tier Structure Analysis
  • Figure 142: Global Market - Company Share Analysis

Frequently Asked Questions

What is the projected size of the mono-material packaging market by 2035?

The industry is forecasted to reach USD 7.8 billion by 2035, growing from USD 4.9 billion in 2025.

What is the expected CAGR of the mono-material packaging market during 2025 to 2035?

The industry is expected to grow at a compound annual growth rate (CAGR) of 4.8% during the forecast period.

Which material segment leads the mono-material packaging market in 2025?

Polyethylene (PE) leads with a 62.0% share in 2025.

Which application dominates mono-material packaging usage?

Food & Beverage Packaging accounts for 46.0% of market share in 2025, making it the largest application segment.

Who are the leading players in the mono-material packaging market?

Key players include Amcor plc with a 11.5% share in 2025.

Explore Similar Insights

Future Market Insights

Mono-Material Packaging Market