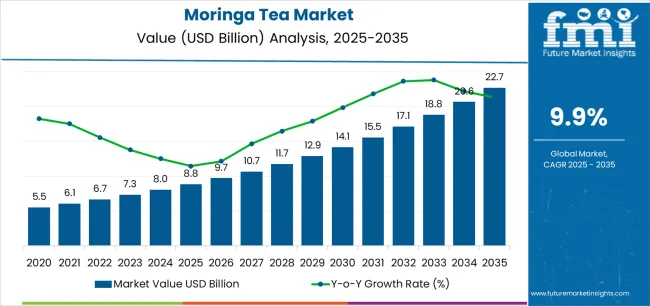
The moringa tea market is estimated to be worth USD 8,001.4 million in 2024. By 2034, it is anticipated that the market value will have shot up to USD 21,456.10 million. Thus, the industry is set to book a CAGR of 10.4% through 2034.
Stimulus to Strengthen the Sales of Moringa Tea
Consumers are on the lookout for herbal remedies as they are increasingly being taken as a complement or even as a replacement for pharmaceuticals. Moringa tea is one such herbal remedy that is capturing the attention of consumers.
Certain regions consume moringa tea traditionally because of its health benefits. These regions exhibit a booming interest in the market. They tend to make it convenient and palatable to assimilate its benefits into daily routines.
The presence of moringa tea across myriad sales channels like health food stores, online retailers, supermarkets, and specialty tea shops jacks up consumer reach, thereby advancing the market growth of moringa tea.
Attributes | Details |
---|---|
Market Value for 2024 | USD 8,001.40 million |
Market Value for 2034 | USD 21,456.10 million |
Market CAGR from 2024 to 2034 | 10.40% |
From 2019 to 2023, the moringa tea industry saw robust growth with a historical CAGR of 9.60%, facilitated by consumer awareness of its health aids and its traction as an organic medication. Demand for moringa tea thrusted as consumers transitioned toward healthier beverage alternatives.
For the period from 2024 to 2034, the growth is supposed to happen at a CAGR of 10.4%. Rising health consciousness is a significant propeller of the demand for the product. The increasing affordability of the tea variety, made possible by streamlining production methods, also enables greater sale.
Attributes | Details |
---|---|
Market Value for 2019 | USD 6,978.80 million |
Market CAGR from 2019 to 2023 | 9.60% |
The flourishing of moringa trees is confined to certain areas of the globe and even in those areas, the production may be seasonal. Thus, there are gaps in the supply of raw material to producers. This trend serves as a deterrent to the market.
Products made from moringa tea cost a bit more than those made from traditional tea leaves. This discourages price-conscious customers from consistently purchasing moringa tea, hampering the moringa tea market expansion.
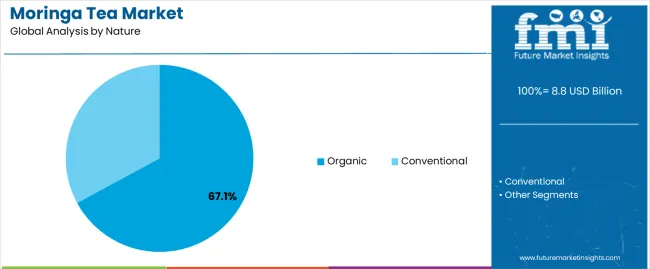
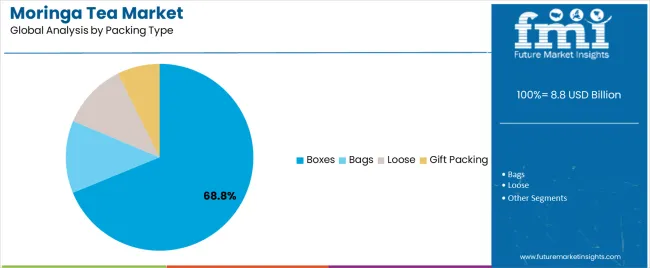
The segmented market analysis of moringa tea shows that the boxes sector is leading the packaging type category, and the organic segment is commanding the nature category.
Segment | Organic |
---|---|
Share (2024) | 67.1% |
Demand for natural and non-poisonous items has gone up leading to organic moringa tea becoming a favorite among health-conscious buyers. There is growing emphasis placed on greener agricultural practices, and organic farming methods used in cultivating moringa are well aligned with ecologically sound consumer preferences. Premium pricing prospects of organic moringa tea highlight its assumed value proposition, attracting the attention of a niche market segment that looks for quality products ethically sourced.
Segment | Boxes |
---|---|
Share (2024) | 68.8% |
The quality and freshness of moringa tea leaves are sustained better in a box, which charms the customers. Retailers also prefer storing up boxes because of the ease of stackability, optimal shelf space usage, and expedited efficient inventory management.
The moringa tea market proliferation, which focus on the leading economies in the United States, Germany, China, Japan and India, can be observed in the subsequent tables. A comprehensive evaluation demonstrates that the United States has enormous moringa tea market opportunities.
Nation | United States |
---|---|
CAGR (2024 to 2034) | 9.00% |
The United States moringa tea leaves market encountered robust growth amplified by health-conscious consumers, focusing on natural and organic products. The escalating consciousness about sustainable products intensifies the demand among carbon-neutral consumers in the United States.
The myriad culinary landscape in the United States proffers opportunities for moringa tea in various beverages and foods, strengthening the moringa tea industry. The market tactics emphasize the nutritional worth and its antioxidant properties which are the essential catalysts enticing health-conscious consumers in the United States.
Nation | Germany |
---|---|
CAGR (2024 to 2034) | 8.10% |
Germany's market is bolstered by a strong tradition of herbal remedies, moringa tea is taking by storm for its perceived health benefits and natural ingredients. The German market's concentrate on sustainability and ethical sourcing going well with Moringa tea's eco-safe production activities, boosting consumer choice.
Moringa tea's adoption as a beverage and an ingredient in conventional German cuisine is helping it proliferate in the country. Germans are also becoming more interested in plant-based products and alternative medicines, seeing demand enhance in Germany for the product.
Nation | China |
---|---|
CAGR (2024 to 2034) | 5.30% |
The China moringa tea leaves market is thriving as urbanization rates are climbing in the country, leading to greater demand for packaged beverages. Like suppliers of other food products in the country, the moringa tea market distributors are increasing their online presence to register more sales.
China’s health and wellness sector is vast and with the therapeutic health benefits of the product, the industry is thriving in the country. Moringa tea producers are capitalizing on Chinese customers’ affinity for herbal teas and natural drugs and medications to increase revenue.
Nation | Japan |
---|---|
CAGR (2024 to 2034) | 5.20% |
Because of its potential effects in curbing age-related diseases, Japan, which has a large population of old people, is now becoming more attentive to it. Immune-boosting properties it allegedly possesses make it quite popular in Japan that is aligned with the focus on preventive healthcare. This cultural preference for herbal medicines and traditional medicine makes the moringa tea leaves market stronger in Japan.
Country | India |
---|---|
CAGR (2024 to 2034) | 4.20% |
The rising concerns over pollution and environmental degradation in India make customers seek organic alternatives for immune system boosting and detoxification purposes. In India’s vibrant food and beverage sector which favours premium and exotic ingredients, there are opportunities for growth of moringa tea as a luxury product.
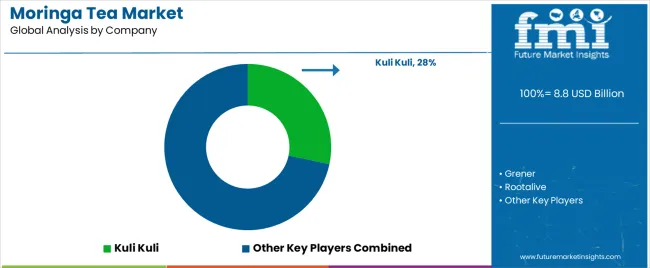
Several moringa tea vendors strive for market share. Kuli Kuli, Grener, Rootalive, Rainforest Herbs, and Ayuritz Phytonutrients Pvt. Ltd. are the dominant moringa tea producers at the forefront of the market. These moringa tea manufacturers have set themselves as the pathfinders, elevating innovation and setting distinct quality standards.
Kuli Kuli has earned a name for itself with its adoption of sustainable and responsible sourcing and manufacturing practices. Grener is pretty high-end with its quality teas. Rootalive has managed to carve a share of the pie for itself with its focus on organic ingredients. Rainforest Herbs has targeted sophisticated market with herbal teas and supplements. The enterprise brings its potent knowledge of botanicals into the sector to profit.
To aggrandize the competitive landscape, vendors of moringa Tea come up with individual strengths to strengthen sales and satisfy varied consumer demands. With time the market is maturing, thus these moringa tea suppliers are looking to pave the way forward through constant advancements and strategic market planning.
Prominent Enhancements and Inventions
Company | Details |
---|---|
NEXE | NEXE Innovations declared XOMA Superfoods in January 2021 in response to the boosting needs of environmentally concerned and health-aware consumers. With the declaration of a new direct-to-consumer eCommerce platform, NEXE intends to amplify the quantity of products offered for online and subscription purchases. |
MRSGI | The current CSR partnership between MRSGI and the moringa producers (GreenEarth Heritage Foundation) and Adlai (Kiboa Ridge Farms) was strengthened in December 2020. Through this collaboration agreement, MRSGI to give these small vendors access to a broader market by stocking their goods in certain Metro locations. |
Green Provisions | Green Provisions' new moringa iced tea debuted in May 2020, is made with premium moringa leaves. This is a great iced tea that comes in a convenient bottle. |
GNC Holdings, LLC | GNC Holdings, LLC launched in July 2019 that it designed to close up to 1,400 company-owned retail locations, most of which were found inside malls. |
Table 1: Global Market Value (US$ Million) Forecast by Region, 2019 to 2024
Table 2: Global Market Volume (Unit Pack) Forecast by Region, 2019 to 2024
Table 3: Global Market Value (US$ Million) Forecast by Nature, 2019 to 2024
Table 4: Global Market Volume (Unit Pack) Forecast by Nature, 2019 to 2024
Table 5: Global Market Value (US$ Million) Forecast by Formulation, 2019 to 2024
Table 6: Global Market Volume (Unit Pack) Forecast by Formulation, 2019 to 2024
Table 7: Global Market Value (US$ Million) Forecast by Packing Type, 2019 to 2024
Table 8: Global Market Volume (Unit Pack) Forecast by Packing Type, 2019 to 2024
Table 9: Global Market Value (US$ Million) Forecast by Type, 2019 to 2024
Table 10: Global Market Volume (Unit Pack) Forecast by Type, 2019 to 2024
Table 11: North America Market Value (US$ Million) Forecast by Country, 2019 to 2024
Table 12: North America Market Volume (Unit Pack) Forecast by Country, 2019 to 2024
Table 13: North America Market Value (US$ Million) Forecast by Nature, 2019 to 2024
Table 14: North America Market Volume (Unit Pack) Forecast by Nature, 2019 to 2024
Table 15: North America Market Value (US$ Million) Forecast by Formulation, 2019 to 2024
Table 16: North America Market Volume (Unit Pack) Forecast by Formulation, 2019 to 2024
Table 17: North America Market Value (US$ Million) Forecast by Packing Type, 2019 to 2024
Table 18: North America Market Volume (Unit Pack) Forecast by Packing Type, 2019 to 2024
Table 19: North America Market Value (US$ Million) Forecast by Type, 2019 to 2024
Table 20: North America Market Volume (Unit Pack) Forecast by Type, 2019 to 2024
Table 21: Latin America Market Value (US$ Million) Forecast by Country, 2019 to 2024
Table 22: Latin America Market Volume (Unit Pack) Forecast by Country, 2019 to 2024
Table 23: Latin America Market Value (US$ Million) Forecast by Nature, 2019 to 2024
Table 24: Latin America Market Volume (Unit Pack) Forecast by Nature, 2019 to 2024
Table 25: Latin America Market Value (US$ Million) Forecast by Formulation, 2019 to 2024
Table 26: Latin America Market Volume (Unit Pack) Forecast by Formulation, 2019 to 2024
Table 27: Latin America Market Value (US$ Million) Forecast by Packing Type, 2019 to 2024
Table 28: Latin America Market Volume (Unit Pack) Forecast by Packing Type, 2019 to 2024
Table 29: Latin America Market Value (US$ Million) Forecast by Type, 2019 to 2024
Table 30: Latin America Market Volume (Unit Pack) Forecast by Type, 2019 to 2024
Table 31: Western Europe Market Value (US$ Million) Forecast by Country, 2019 to 2024
Table 32: Western Europe Market Volume (Unit Pack) Forecast by Country, 2019 to 2024
Table 33: Western Europe Market Value (US$ Million) Forecast by Nature, 2019 to 2024
Table 34: Western Europe Market Volume (Unit Pack) Forecast by Nature, 2019 to 2024
Table 35: Western Europe Market Value (US$ Million) Forecast by Formulation, 2019 to 2024
Table 36: Western Europe Market Volume (Unit Pack) Forecast by Formulation, 2019 to 2024
Table 37: Western Europe Market Value (US$ Million) Forecast by Packing Type, 2019 to 2024
Table 38: Western Europe Market Volume (Unit Pack) Forecast by Packing Type, 2019 to 2024
Table 39: Western Europe Market Value (US$ Million) Forecast by Type, 2019 to 2024
Table 40: Western Europe Market Volume (Unit Pack) Forecast by Type, 2019 to 2024
Table 41: Eastern Europe Market Value (US$ Million) Forecast by Country, 2019 to 2024
Table 42: Eastern Europe Market Volume (Unit Pack) Forecast by Country, 2019 to 2024
Table 43: Eastern Europe Market Value (US$ Million) Forecast by Nature, 2019 to 2024
Table 44: Eastern Europe Market Volume (Unit Pack) Forecast by Nature, 2019 to 2024
Table 45: Eastern Europe Market Value (US$ Million) Forecast by Formulation, 2019 to 2024
Table 46: Eastern Europe Market Volume (Unit Pack) Forecast by Formulation, 2019 to 2024
Table 47: Eastern Europe Market Value (US$ Million) Forecast by Packing Type, 2019 to 2024
Table 48: Eastern Europe Market Volume (Unit Pack) Forecast by Packing Type, 2019 to 2024
Table 49: Eastern Europe Market Value (US$ Million) Forecast by Type, 2019 to 2024
Table 50: Eastern Europe Market Volume (Unit Pack) Forecast by Type, 2019 to 2024
Table 51: South Asia and Pacific Market Value (US$ Million) Forecast by Country, 2019 to 2024
Table 52: South Asia and Pacific Market Volume (Unit Pack) Forecast by Country, 2019 to 2024
Table 53: South Asia and Pacific Market Value (US$ Million) Forecast by Nature, 2019 to 2024
Table 54: South Asia and Pacific Market Volume (Unit Pack) Forecast by Nature, 2019 to 2024
Table 55: South Asia and Pacific Market Value (US$ Million) Forecast by Formulation, 2019 to 2024
Table 56: South Asia and Pacific Market Volume (Unit Pack) Forecast by Formulation, 2019 to 2024
Table 57: South Asia and Pacific Market Value (US$ Million) Forecast by Packing Type, 2019 to 2024
Table 58: South Asia and Pacific Market Volume (Unit Pack) Forecast by Packing Type, 2019 to 2024
Table 59: South Asia and Pacific Market Value (US$ Million) Forecast by Type, 2019 to 2024
Table 60: South Asia and Pacific Market Volume (Unit Pack) Forecast by Type, 2019 to 2024
Table 61: East Asia Market Value (US$ Million) Forecast by Country, 2019 to 2024
Table 62: East Asia Market Volume (Unit Pack) Forecast by Country, 2019 to 2024
Table 63: East Asia Market Value (US$ Million) Forecast by Nature, 2019 to 2024
Table 64: East Asia Market Volume (Unit Pack) Forecast by Nature, 2019 to 2024
Table 65: East Asia Market Value (US$ Million) Forecast by Formulation, 2019 to 2024
Table 66: East Asia Market Volume (Unit Pack) Forecast by Formulation, 2019 to 2024
Table 67: East Asia Market Value (US$ Million) Forecast by Packing Type, 2019 to 2024
Table 68: East Asia Market Volume (Unit Pack) Forecast by Packing Type, 2019 to 2024
Table 69: East Asia Market Value (US$ Million) Forecast by Type, 2019 to 2024
Table 70: East Asia Market Volume (Unit Pack) Forecast by Type, 2019 to 2024
Table 71: Middle East and Africa Market Value (US$ Million) Forecast by Country, 2019 to 2024
Table 72: Middle East and Africa Market Volume (Unit Pack) Forecast by Country, 2019 to 2024
Table 73: Middle East and Africa Market Value (US$ Million) Forecast by Nature, 2019 to 2024
Table 74: Middle East and Africa Market Volume (Unit Pack) Forecast by Nature, 2019 to 2024
Table 75: Middle East and Africa Market Value (US$ Million) Forecast by Formulation, 2019 to 2024
Table 76: Middle East and Africa Market Volume (Unit Pack) Forecast by Formulation, 2019 to 2024
Table 77: Middle East and Africa Market Value (US$ Million) Forecast by Packing Type, 2019 to 2024
Table 78: Middle East and Africa Market Volume (Unit Pack) Forecast by Packing Type, 2019 to 2024
Table 79: Middle East and Africa Market Value (US$ Million) Forecast by Type, 2019 to 2024
Table 80: Middle East and Africa Market Volume (Unit Pack) Forecast by Type, 2019 to 2024
Figure 1: Global Market Value (US$ Million) by Nature, 2024 to 2024
Figure 2: Global Market Value (US$ Million) by Formulation, 2024 to 2024
Figure 3: Global Market Value (US$ Million) by Packing Type, 2024 to 2024
Figure 4: Global Market Value (US$ Million) by Type, 2024 to 2024
Figure 5: Global Market Value (US$ Million) by Region, 2024 to 2024
Figure 6: Global Market Value (US$ Million) Analysis by Region, 2019 to 2024
Figure 7: Global Market Volume (Unit Pack) Analysis by Region, 2019 to 2024
Figure 8: Global Market Value Share (%) and BPS Analysis by Region, 2024 to 2024
Figure 9: Global Market Y-o-Y Growth (%) Projections by Region, 2024 to 2024
Figure 10: Global Market Value (US$ Million) Analysis by Nature, 2019 to 2024
Figure 11: Global Market Volume (Unit Pack) Analysis by Nature, 2019 to 2024
Figure 12: Global Market Value Share (%) and BPS Analysis by Nature, 2024 to 2024
Figure 13: Global Market Y-o-Y Growth (%) Projections by Nature, 2024 to 2024
Figure 14: Global Market Value (US$ Million) Analysis by Formulation, 2019 to 2024
Figure 15: Global Market Volume (Unit Pack) Analysis by Formulation, 2019 to 2024
Figure 16: Global Market Value Share (%) and BPS Analysis by Formulation, 2024 to 2024
Figure 17: Global Market Y-o-Y Growth (%) Projections by Formulation, 2024 to 2024
Figure 18: Global Market Value (US$ Million) Analysis by Packing Type, 2019 to 2024
Figure 19: Global Market Volume (Unit Pack) Analysis by Packing Type, 2019 to 2024
Figure 20: Global Market Value Share (%) and BPS Analysis by Packing Type, 2024 to 2024
Figure 21: Global Market Y-o-Y Growth (%) Projections by Packing Type, 2024 to 2024
Figure 22: Global Market Value (US$ Million) Analysis by Type, 2019 to 2024
Figure 23: Global Market Volume (Unit Pack) Analysis by Type, 2019 to 2024
Figure 24: Global Market Value Share (%) and BPS Analysis by Type, 2024 to 2024
Figure 25: Global Market Y-o-Y Growth (%) Projections by Type, 2024 to 2024
Figure 26: Global Market Attractiveness by Nature, 2024 to 2024
Figure 27: Global Market Attractiveness by Formulation, 2024 to 2024
Figure 28: Global Market Attractiveness by Packing Type, 2024 to 2024
Figure 29: Global Market Attractiveness by Type, 2024 to 2024
Figure 30: Global Market Attractiveness by Region, 2024 to 2024
Figure 31: North America Market Value (US$ Million) by Nature, 2024 to 2024
Figure 32: North America Market Value (US$ Million) by Formulation, 2024 to 2024
Figure 33: North America Market Value (US$ Million) by Packing Type, 2024 to 2024
Figure 34: North America Market Value (US$ Million) by Type, 2024 to 2024
Figure 35: North America Market Value (US$ Million) by Country, 2024 to 2024
Figure 36: North America Market Value (US$ Million) Analysis by Country, 2019 to 2024
Figure 37: North America Market Volume (Unit Pack) Analysis by Country, 2019 to 2024
Figure 38: North America Market Value Share (%) and BPS Analysis by Country, 2024 to 2024
Figure 39: North America Market Y-o-Y Growth (%) Projections by Country, 2024 to 2024
Figure 40: North America Market Value (US$ Million) Analysis by Nature, 2019 to 2024
Figure 41: North America Market Volume (Unit Pack) Analysis by Nature, 2019 to 2024
Figure 42: North America Market Value Share (%) and BPS Analysis by Nature, 2024 to 2024
Figure 43: North America Market Y-o-Y Growth (%) Projections by Nature, 2024 to 2024
Figure 44: North America Market Value (US$ Million) Analysis by Formulation, 2019 to 2024
Figure 45: North America Market Volume (Unit Pack) Analysis by Formulation, 2019 to 2024
Figure 46: North America Market Value Share (%) and BPS Analysis by Formulation, 2024 to 2024
Figure 47: North America Market Y-o-Y Growth (%) Projections by Formulation, 2024 to 2024
Figure 48: North America Market Value (US$ Million) Analysis by Packing Type, 2019 to 2024
Figure 49: North America Market Volume (Unit Pack) Analysis by Packing Type, 2019 to 2024
Figure 50: North America Market Value Share (%) and BPS Analysis by Packing Type, 2024 to 2024
Figure 51: North America Market Y-o-Y Growth (%) Projections by Packing Type, 2024 to 2024
Figure 52: North America Market Value (US$ Million) Analysis by Type, 2019 to 2024
Figure 53: North America Market Volume (Unit Pack) Analysis by Type, 2019 to 2024
Figure 54: North America Market Value Share (%) and BPS Analysis by Type, 2024 to 2024
Figure 55: North America Market Y-o-Y Growth (%) Projections by Type, 2024 to 2024
Figure 56: North America Market Attractiveness by Nature, 2024 to 2024
Figure 57: North America Market Attractiveness by Formulation, 2024 to 2024
Figure 58: North America Market Attractiveness by Packing Type, 2024 to 2024
Figure 59: North America Market Attractiveness by Type, 2024 to 2024
Figure 60: North America Market Attractiveness by Country, 2024 to 2024
Figure 61: Latin America Market Value (US$ Million) by Nature, 2024 to 2024
Figure 62: Latin America Market Value (US$ Million) by Formulation, 2024 to 2024
Figure 63: Latin America Market Value (US$ Million) by Packing Type, 2024 to 2024
Figure 64: Latin America Market Value (US$ Million) by Type, 2024 to 2024
Figure 65: Latin America Market Value (US$ Million) by Country, 2024 to 2024
Figure 66: Latin America Market Value (US$ Million) Analysis by Country, 2019 to 2024
Figure 67: Latin America Market Volume (Unit Pack) Analysis by Country, 2019 to 2024
Figure 68: Latin America Market Value Share (%) and BPS Analysis by Country, 2024 to 2024
Figure 69: Latin America Market Y-o-Y Growth (%) Projections by Country, 2024 to 2024
Figure 70: Latin America Market Value (US$ Million) Analysis by Nature, 2019 to 2024
Figure 71: Latin America Market Volume (Unit Pack) Analysis by Nature, 2019 to 2024
Figure 72: Latin America Market Value Share (%) and BPS Analysis by Nature, 2024 to 2024
Figure 73: Latin America Market Y-o-Y Growth (%) Projections by Nature, 2024 to 2024
Figure 74: Latin America Market Value (US$ Million) Analysis by Formulation, 2019 to 2024
Figure 75: Latin America Market Volume (Unit Pack) Analysis by Formulation, 2019 to 2024
Figure 76: Latin America Market Value Share (%) and BPS Analysis by Formulation, 2024 to 2024
Figure 77: Latin America Market Y-o-Y Growth (%) Projections by Formulation, 2024 to 2024
Figure 78: Latin America Market Value (US$ Million) Analysis by Packing Type, 2019 to 2024
Figure 79: Latin America Market Volume (Unit Pack) Analysis by Packing Type, 2019 to 2024
Figure 80: Latin America Market Value Share (%) and BPS Analysis by Packing Type, 2024 to 2024
Figure 81: Latin America Market Y-o-Y Growth (%) Projections by Packing Type, 2024 to 2024
Figure 82: Latin America Market Value (US$ Million) Analysis by Type, 2019 to 2024
Figure 83: Latin America Market Volume (Unit Pack) Analysis by Type, 2019 to 2024
Figure 84: Latin America Market Value Share (%) and BPS Analysis by Type, 2024 to 2024
Figure 85: Latin America Market Y-o-Y Growth (%) Projections by Type, 2024 to 2024
Figure 86: Latin America Market Attractiveness by Nature, 2024 to 2024
Figure 87: Latin America Market Attractiveness by Formulation, 2024 to 2024
Figure 88: Latin America Market Attractiveness by Packing Type, 2024 to 2024
Figure 89: Latin America Market Attractiveness by Type, 2024 to 2024
Figure 90: Latin America Market Attractiveness by Country, 2024 to 2024
Figure 91: Western Europe Market Value (US$ Million) by Nature, 2024 to 2024
Figure 92: Western Europe Market Value (US$ Million) by Formulation, 2024 to 2024
Figure 93: Western Europe Market Value (US$ Million) by Packing Type, 2024 to 2024
Figure 94: Western Europe Market Value (US$ Million) by Type, 2024 to 2024
Figure 95: Western Europe Market Value (US$ Million) by Country, 2024 to 2024
Figure 96: Western Europe Market Value (US$ Million) Analysis by Country, 2019 to 2024
Figure 97: Western Europe Market Volume (Unit Pack) Analysis by Country, 2019 to 2024
Figure 98: Western Europe Market Value Share (%) and BPS Analysis by Country, 2024 to 2024
Figure 99: Western Europe Market Y-o-Y Growth (%) Projections by Country, 2024 to 2024
Figure 100: Western Europe Market Value (US$ Million) Analysis by Nature, 2019 to 2024
Figure 101: Western Europe Market Volume (Unit Pack) Analysis by Nature, 2019 to 2024
Figure 102: Western Europe Market Value Share (%) and BPS Analysis by Nature, 2024 to 2024
Figure 103: Western Europe Market Y-o-Y Growth (%) Projections by Nature, 2024 to 2024
Figure 104: Western Europe Market Value (US$ Million) Analysis by Formulation, 2019 to 2024
Figure 105: Western Europe Market Volume (Unit Pack) Analysis by Formulation, 2019 to 2024
Figure 106: Western Europe Market Value Share (%) and BPS Analysis by Formulation, 2024 to 2024
Figure 107: Western Europe Market Y-o-Y Growth (%) Projections by Formulation, 2024 to 2024
Figure 108: Western Europe Market Value (US$ Million) Analysis by Packing Type, 2019 to 2024
Figure 109: Western Europe Market Volume (Unit Pack) Analysis by Packing Type, 2019 to 2024
Figure 110: Western Europe Market Value Share (%) and BPS Analysis by Packing Type, 2024 to 2024
Figure 111: Western Europe Market Y-o-Y Growth (%) Projections by Packing Type, 2024 to 2024
Figure 112: Western Europe Market Value (US$ Million) Analysis by Type, 2019 to 2024
Figure 113: Western Europe Market Volume (Unit Pack) Analysis by Type, 2019 to 2024
Figure 114: Western Europe Market Value Share (%) and BPS Analysis by Type, 2024 to 2024
Figure 115: Western Europe Market Y-o-Y Growth (%) Projections by Type, 2024 to 2024
Figure 116: Western Europe Market Attractiveness by Nature, 2024 to 2024
Figure 117: Western Europe Market Attractiveness by Formulation, 2024 to 2024
Figure 118: Western Europe Market Attractiveness by Packing Type, 2024 to 2024
Figure 119: Western Europe Market Attractiveness by Type, 2024 to 2024
Figure 120: Western Europe Market Attractiveness by Country, 2024 to 2024
Figure 121: Eastern Europe Market Value (US$ Million) by Nature, 2024 to 2024
Figure 122: Eastern Europe Market Value (US$ Million) by Formulation, 2024 to 2024
Figure 123: Eastern Europe Market Value (US$ Million) by Packing Type, 2024 to 2024
Figure 124: Eastern Europe Market Value (US$ Million) by Type, 2024 to 2024
Figure 125: Eastern Europe Market Value (US$ Million) by Country, 2024 to 2024
Figure 126: Eastern Europe Market Value (US$ Million) Analysis by Country, 2019 to 2024
Figure 127: Eastern Europe Market Volume (Unit Pack) Analysis by Country, 2019 to 2024
Figure 128: Eastern Europe Market Value Share (%) and BPS Analysis by Country, 2024 to 2024
Figure 129: Eastern Europe Market Y-o-Y Growth (%) Projections by Country, 2024 to 2024
Figure 130: Eastern Europe Market Value (US$ Million) Analysis by Nature, 2019 to 2024
Figure 131: Eastern Europe Market Volume (Unit Pack) Analysis by Nature, 2019 to 2024
Figure 132: Eastern Europe Market Value Share (%) and BPS Analysis by Nature, 2024 to 2024
Figure 133: Eastern Europe Market Y-o-Y Growth (%) Projections by Nature, 2024 to 2024
Figure 134: Eastern Europe Market Value (US$ Million) Analysis by Formulation, 2019 to 2024
Figure 135: Eastern Europe Market Volume (Unit Pack) Analysis by Formulation, 2019 to 2024
Figure 136: Eastern Europe Market Value Share (%) and BPS Analysis by Formulation, 2024 to 2024
Figure 137: Eastern Europe Market Y-o-Y Growth (%) Projections by Formulation, 2024 to 2024
Figure 138: Eastern Europe Market Value (US$ Million) Analysis by Packing Type, 2019 to 2024
Figure 139: Eastern Europe Market Volume (Unit Pack) Analysis by Packing Type, 2019 to 2024
Figure 140: Eastern Europe Market Value Share (%) and BPS Analysis by Packing Type, 2024 to 2024
Figure 141: Eastern Europe Market Y-o-Y Growth (%) Projections by Packing Type, 2024 to 2024
Figure 142: Eastern Europe Market Value (US$ Million) Analysis by Type, 2019 to 2024
Figure 143: Eastern Europe Market Volume (Unit Pack) Analysis by Type, 2019 to 2024
Figure 144: Eastern Europe Market Value Share (%) and BPS Analysis by Type, 2024 to 2024
Figure 145: Eastern Europe Market Y-o-Y Growth (%) Projections by Type, 2024 to 2024
Figure 146: Eastern Europe Market Attractiveness by Nature, 2024 to 2024
Figure 147: Eastern Europe Market Attractiveness by Formulation, 2024 to 2024
Figure 148: Eastern Europe Market Attractiveness by Packing Type, 2024 to 2024
Figure 149: Eastern Europe Market Attractiveness by Type, 2024 to 2024
Figure 150: Eastern Europe Market Attractiveness by Country, 2024 to 2024
Figure 151: South Asia and Pacific Market Value (US$ Million) by Nature, 2024 to 2024
Figure 152: South Asia and Pacific Market Value (US$ Million) by Formulation, 2024 to 2024
Figure 153: South Asia and Pacific Market Value (US$ Million) by Packing Type, 2024 to 2024
Figure 154: South Asia and Pacific Market Value (US$ Million) by Type, 2024 to 2024
Figure 155: South Asia and Pacific Market Value (US$ Million) by Country, 2024 to 2024
Figure 156: South Asia and Pacific Market Value (US$ Million) Analysis by Country, 2019 to 2024
Figure 157: South Asia and Pacific Market Volume (Unit Pack) Analysis by Country, 2019 to 2024
Figure 158: South Asia and Pacific Market Value Share (%) and BPS Analysis by Country, 2024 to 2024
Figure 159: South Asia and Pacific Market Y-o-Y Growth (%) Projections by Country, 2024 to 2024
Figure 160: South Asia and Pacific Market Value (US$ Million) Analysis by Nature, 2019 to 2024
Figure 161: South Asia and Pacific Market Volume (Unit Pack) Analysis by Nature, 2019 to 2024
Figure 162: South Asia and Pacific Market Value Share (%) and BPS Analysis by Nature, 2024 to 2024
Figure 163: South Asia and Pacific Market Y-o-Y Growth (%) Projections by Nature, 2024 to 2024
Figure 164: South Asia and Pacific Market Value (US$ Million) Analysis by Formulation, 2019 to 2024
Figure 165: South Asia and Pacific Market Volume (Unit Pack) Analysis by Formulation, 2019 to 2024
Figure 166: South Asia and Pacific Market Value Share (%) and BPS Analysis by Formulation, 2024 to 2024
Figure 167: South Asia and Pacific Market Y-o-Y Growth (%) Projections by Formulation, 2024 to 2024
Figure 168: South Asia and Pacific Market Value (US$ Million) Analysis by Packing Type, 2019 to 2024
Figure 169: South Asia and Pacific Market Volume (Unit Pack) Analysis by Packing Type, 2019 to 2024
Figure 170: South Asia and Pacific Market Value Share (%) and BPS Analysis by Packing Type, 2024 to 2024
Figure 171: South Asia and Pacific Market Y-o-Y Growth (%) Projections by Packing Type, 2024 to 2024
Figure 172: South Asia and Pacific Market Value (US$ Million) Analysis by Type, 2019 to 2024
Figure 173: South Asia and Pacific Market Volume (Unit Pack) Analysis by Type, 2019 to 2024
Figure 174: South Asia and Pacific Market Value Share (%) and BPS Analysis by Type, 2024 to 2024
Figure 175: South Asia and Pacific Market Y-o-Y Growth (%) Projections by Type, 2024 to 2024
Figure 176: South Asia and Pacific Market Attractiveness by Nature, 2024 to 2024
Figure 177: South Asia and Pacific Market Attractiveness by Formulation, 2024 to 2024
Figure 178: South Asia and Pacific Market Attractiveness by Packing Type, 2024 to 2024
Figure 179: South Asia and Pacific Market Attractiveness by Type, 2024 to 2024
Figure 180: South Asia and Pacific Market Attractiveness by Country, 2024 to 2024
Figure 181: East Asia Market Value (US$ Million) by Nature, 2024 to 2024
Figure 182: East Asia Market Value (US$ Million) by Formulation, 2024 to 2024
Figure 183: East Asia Market Value (US$ Million) by Packing Type, 2024 to 2024
Figure 184: East Asia Market Value (US$ Million) by Type, 2024 to 2024
Figure 185: East Asia Market Value (US$ Million) by Country, 2024 to 2024
Figure 186: East Asia Market Value (US$ Million) Analysis by Country, 2019 to 2024
Figure 187: East Asia Market Volume (Unit Pack) Analysis by Country, 2019 to 2024
Figure 188: East Asia Market Value Share (%) and BPS Analysis by Country, 2024 to 2024
Figure 189: East Asia Market Y-o-Y Growth (%) Projections by Country, 2024 to 2024
Figure 190: East Asia Market Value (US$ Million) Analysis by Nature, 2019 to 2024
Figure 191: East Asia Market Volume (Unit Pack) Analysis by Nature, 2019 to 2024
Figure 192: East Asia Market Value Share (%) and BPS Analysis by Nature, 2024 to 2024
Figure 193: East Asia Market Y-o-Y Growth (%) Projections by Nature, 2024 to 2024
Figure 194: East Asia Market Value (US$ Million) Analysis by Formulation, 2019 to 2024
Figure 195: East Asia Market Volume (Unit Pack) Analysis by Formulation, 2019 to 2024
Figure 196: East Asia Market Value Share (%) and BPS Analysis by Formulation, 2024 to 2024
Figure 197: East Asia Market Y-o-Y Growth (%) Projections by Formulation, 2024 to 2024
Figure 198: East Asia Market Value (US$ Million) Analysis by Packing Type, 2019 to 2024
Figure 199: East Asia Market Volume (Unit Pack) Analysis by Packing Type, 2019 to 2024
Figure 200: East Asia Market Value Share (%) and BPS Analysis by Packing Type, 2024 to 2024
Figure 201: East Asia Market Y-o-Y Growth (%) Projections by Packing Type, 2024 to 2024
Figure 202: East Asia Market Value (US$ Million) Analysis by Type, 2019 to 2024
Figure 203: East Asia Market Volume (Unit Pack) Analysis by Type, 2019 to 2024
Figure 204: East Asia Market Value Share (%) and BPS Analysis by Type, 2024 to 2024
Figure 205: East Asia Market Y-o-Y Growth (%) Projections by Type, 2024 to 2024
Figure 206: East Asia Market Attractiveness by Nature, 2024 to 2024
Figure 207: East Asia Market Attractiveness by Formulation, 2024 to 2024
Figure 208: East Asia Market Attractiveness by Packing Type, 2024 to 2024
Figure 209: East Asia Market Attractiveness by Type, 2024 to 2024
Figure 210: East Asia Market Attractiveness by Country, 2024 to 2024
Figure 211: Middle East and Africa Market Value (US$ Million) by Nature, 2024 to 2024
Figure 212: Middle East and Africa Market Value (US$ Million) by Formulation, 2024 to 2024
Figure 213: Middle East and Africa Market Value (US$ Million) by Packing Type, 2024 to 2024
Figure 214: Middle East and Africa Market Value (US$ Million) by Type, 2024 to 2024
Figure 215: Middle East and Africa Market Value (US$ Million) by Country, 2024 to 2024
Figure 216: Middle East and Africa Market Value (US$ Million) Analysis by Country, 2019 to 2024
Figure 217: Middle East and Africa Market Volume (Unit Pack) Analysis by Country, 2019 to 2024
Figure 218: Middle East and Africa Market Value Share (%) and BPS Analysis by Country, 2024 to 2024
Figure 219: Middle East and Africa Market Y-o-Y Growth (%) Projections by Country, 2024 to 2024
Figure 220: Middle East and Africa Market Value (US$ Million) Analysis by Nature, 2019 to 2024
Figure 221: Middle East and Africa Market Volume (Unit Pack) Analysis by Nature, 2019 to 2024
Figure 222: Middle East and Africa Market Value Share (%) and BPS Analysis by Nature, 2024 to 2024
Figure 223: Middle East and Africa Market Y-o-Y Growth (%) Projections by Nature, 2024 to 2024
Figure 224: Middle East and Africa Market Value (US$ Million) Analysis by Formulation, 2019 to 2024
Figure 225: Middle East and Africa Market Volume (Unit Pack) Analysis by Formulation, 2019 to 2024
Figure 226: Middle East and Africa Market Value Share (%) and BPS Analysis by Formulation, 2024 to 2024
Figure 227: Middle East and Africa Market Y-o-Y Growth (%) Projections by Formulation, 2024 to 2024
Figure 228: Middle East and Africa Market Value (US$ Million) Analysis by Packing Type, 2019 to 2024
Figure 229: Middle East and Africa Market Volume (Unit Pack) Analysis by Packing Type, 2019 to 2024
Figure 230: Middle East and Africa Market Value Share (%) and BPS Analysis by Packing Type, 2024 to 2024
Figure 231: Middle East and Africa Market Y-o-Y Growth (%) Projections by Packing Type, 2024 to 2024
Figure 232: Middle East and Africa Market Value (US$ Million) Analysis by Type, 2019 to 2024
Figure 233: Middle East and Africa Market Volume (Unit Pack) Analysis by Type, 2019 to 2024
Figure 234: Middle East and Africa Market Value Share (%) and BPS Analysis by Type, 2024 to 2024
Figure 235: Middle East and Africa Market Y-o-Y Growth (%) Projections by Type, 2024 to 2024
Figure 236: Middle East and Africa Market Attractiveness by Nature, 2024 to 2024
Figure 237: Middle East and Africa Market Attractiveness by Formulation, 2024 to 2024
Figure 238: Middle East and Africa Market Attractiveness by Packing Type, 2024 to 2024
Figure 239: Middle East and Africa Market Attractiveness by Type, 2024 to 2024
Figure 240: Middle East and Africa Market Attractiveness by Country, 2024 to 2024
The moringa tea and product market to acquire a valuation USD 8,001.40 million in 2024.
Emerging themes reflect an estimation of USD 21,456.10 million by 2034.
The moringa tea and product market to surge at a CAGR of 10.40% through 2034.
From 2019 to 2023, the moringa product market accelerated at a 9.60% CAGR.
The organic sector is set to procure a market share of 67.10% in 2024.
The boxes segment envisions a market share of 68.80% in 2024.
Explore Similar Insights
Thank you!
You will receive an email from our Business Development Manager. Please be sure to check your SPAM/JUNK folder too.