Reports

- Global Locations -

Headquarters

Future Market Insights, Inc.

Christiana Corporate, 200
Continental Drive, Suite 401,
Newark, Delaware - 19713,
United States

T: +1-347-918-3531

Americas

Future Market Insights, Inc.

616 Corporate Way, Suite 2-9018,
Valley Cottage, NY 10989, United States

MEA

Future Market Insights

1602-6 Jumeirah Bay X2 Tower, Plot No: JLT-PH2-X2A,
Jumeirah Lakes Towers, Dubai,
United Arab Emirates

Europe

Future Market Insights

3rd Floor, 207 Regent Street,
W1B 3HH London
United Kingdom

T: + 44 (0) 20 8123 9659

Asia Pacific

Future Market Insights

IndiaLand Global Tech Park, Unit UG-1, Behind Grand HighStreet, Phase 1, Hinjawadi, MH, Pune – 411057, India

Nisin Market Outlook (2022 to 2032)

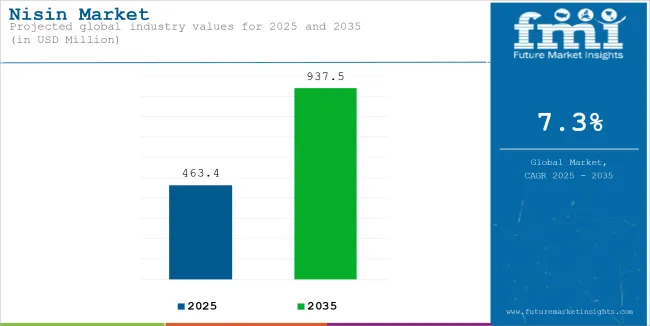
Nisin demand is estimated to be valued at US$ 83.2 million in 2022 and further expand at a CAGR of 7.3% during the forecast period (2022 to 2032). Overall nisin sales are poised to exceed a market valuation of US$ 164.7 million by 2032. Rising applications in the food and beverage, bakery, and dairy sectors is a key factors propelling demand for nisin in the global market.

Nisin, a polycyclic peptide derived from the bacterium Lactococcus lactis, is a bactericidal food preservative. It is effective against a wide range of gram-positive bacteria that cause food spoilage, including Bacillus subtilis, Staphylococcus aureus, Listeria, Clostridium botulinum, and their spores. Nisin eliminates the need for heat sterilization of packaged food products before preserving them because it controls microbial growth at both normal and frozen temperatures.

As people are becoming more aware of the dangers of chemical preservatives, the demand for natural preservatives like nisin is expected to skyrocket during the forecast period. It is effective against a wide range of microbes and is simple to apply to food products during packaging.

Similarly, the growth of the canned food industry is likely to generate high nisin demand due to its effectiveness in controlling Clostridium botulinum, a problematic bacteria found in canned foods.

Growing consumer shift toward convenience products with natural ingredients and extended shelf lives is prompting manufacturers to utilize safe and effective preservatives like nisin in their products. This, in turn, is creating lucrative growth prospects for key players, and the trend is expected to continue during the projection period.

Nisin is becoming an increasingly popular preservative due to its antimicrobial properties. This natural preservative has many applications in food and beverage industries, such as in cheese products, canned foods and beverages, baked goods, salad dressings, and other processed foods.

Regionally, Asia Pacific is emerging as a key market for Nisin and the trend will further escalate during the forecast period as people across countries like India, China, and Japan are becoming aware of the harmful effects of chemical food preservatives.

The growing demand for convenience foods and processed items along with increased consumer awareness regarding health benefits offered by natural preservatives are some of the primary factors driving the growth of the Asia Pacific market.

Additionally, government regulations on synthetic food additives have also created an opportunity for natural products like Nisin to increase their presence in this region. Furthermore, continuous advancements in biotechnology have resulted in cost-effective production methods that make nisin more accessible than ever before.

Attribute Key Insights
Nisin Market Estimated Value (2022) US$ 83.2 million
Projected Market Value (2032) US$ 164.7 million
Value-based CAGR (2022 to 2032) 7.3%
Share of the United Kingdom in the Global Market 22%

Don't pay for what you don't need

Customize your report by selecting specific countries or regions and save 30%!

2017 to 2021 Nisin Demand Outlook Compared to 2022 to 2032 Sales Forecast

According to Future Market Insights (FMI), the global nisin demand is projected to grow at 7.3% CAGR between 2022 and 2032 in comparison to the 7.6% CAGR registered during the historical period from 2017 to 2021.

Growing usage of nisin as a natural preservative for protecting a wide range of food products including canned products, bakeries, meat, poultry, and dairy items from microbial attack is a key factor providing impetus to the growth of the global nisin industry.

Similarly, growing consumer preference towards natural food preservatives and increasing consumption of packaged, pre-processed, and frozen foods are expected to generate high nisin demand during the forecast period.

Nisin has become an excellent preservative for temperature-sensitive foods such as dairy and frozen foods due to its safe and effective nature. The addition of this natural preservative eliminates the need for heat sterilization. As a result, the majority of food manufacturers utilize nisin in their products to expand their shelf life. This will boost nisin sales over the forthcoming period.

The growing demand for convenience food products has been one of the primary drivers of the nisin industry’s expansion. In order to keep up with consumer demand for ready-to-eat meals that have longer shelf lives than those made from fresh ingredients, various food companies use nisin as a preserving agent for their products.

Comparative Analysis of Nisin Markets

Nisin Market:

Differentiating Aspects Nisin Market
CAGR in 2022 to 2032 7.3%
Current Valuation in 2022 US$ 83.2 million
Projected Valuation in 2032 US$ 164.7 million
Demand Drivers
  • Growing demand for processed food across the world is expected to boost nisin sales during the forecast period.
  • Rising consumer awareness about the potential side effects of chemical food preservatives on the human body will generate high demand for nisin over the next ten years.

Sweetener Market:

Differentiating Aspects Sweetener Market
CAGR in 2022 to 2032 3.8%
Current Valuation in 2022 US$ 108.6 billion
Projected Valuation in 2032 US$ 157.7 billion
Demand Drivers
  • Rising usage of sweeteners across pharmaceutical and food & beverages industries to improve the palatability of many products is driving the global sweetener market
  • The growing popularity of sugarless or keto sweeteners, especially among health-conscious people, will boost sales of sweeteners during the forecast period.

Food Coating Ingredients Market:

Differentiating Aspects Food Coating Ingredients Market
CAGR in 2022 to 2032 6.4%
Current Valuation in 2022 US$ 3.5 billion
Projected Valuation in 2032 US$ 6.5 billion
Demand Drivers
  • The fast-growing food processing industry coupled with increasing consumption of ready-to-eat food products is a key factor providing impetus to the global food coating ingredients market.
  • The growing popularity of antimicrobial coatings is expected to boost sales during the projection period.
Nandini Roy Choudhury

Principal Consultant

Talk to Analyst

Find your sweet spots for generating winning opportunities in this market.

Country wise insights

Why is the USA Considered a Dominant Market for Nisin?

Growing Preference for Natural Food Preservatives Propelling Nisin Sales in the USA

North America, spearheaded by the USA, is a powerhouse in the nisin market, holding the largest market share globally. The product is a polycyclic antibacterial peptide developed by certain strains of bacteria and used as a food preservative. It has been commercially used since the 1950s and is present in many products worldwide today.

The vast majority of nisin production takes place in North America, with approximately two-thirds of global production originating from North American countries such as the United States, Canada, and Mexico.

This high market share is due to several factors including high consumer demand for safe, nutritious food products, the availability of cutting-edge technologies that enable efficient large-scale manufacturing, and the presence of stringent regulations governing food safety standards.

Similarly, increasing support from government authorities towards promoting the use of natural preservatives like nisin over synthetic ones and the growing popularity of canned food products will boost nisin sales across the USA over the next decade.

Why is the Demand for Nisin Rising in the United Kingdom?

Growing Awareness About the Benefits of Nisin Fueling its Adoption Across the United Kingdom

The United Kingdom is one of the most attractive markets for nisin, a natural food preservative made from certain bacteria, and is expected to generate significant revenues by the end of the forecast period. This can be attributed to the rising awareness about the benefits of nisin among both consumers and food manufacturers.

Nisin has many benefits that make it an ideal choice for food production in the United Kingdom, particularly in terms of cost-effectiveness, safety, and convenience. It's also very stable in comparison to other preservatives, making it much easier to store and use on a regular basis. Additionally, its low toxicity level means there are fewer risks associated with its usage than other preservatives.

Rising usage of natural food preservatives like nisin by the United Kingdom food manufacturing companies to protect their products from microbial attack will continue to elevate nisin demand in the market during the forthcoming period.

Category wise insights

Which are the Leading Segments in the Global Nisin Industry?

Powder Segment to Showcase Highest Growth Through 2032

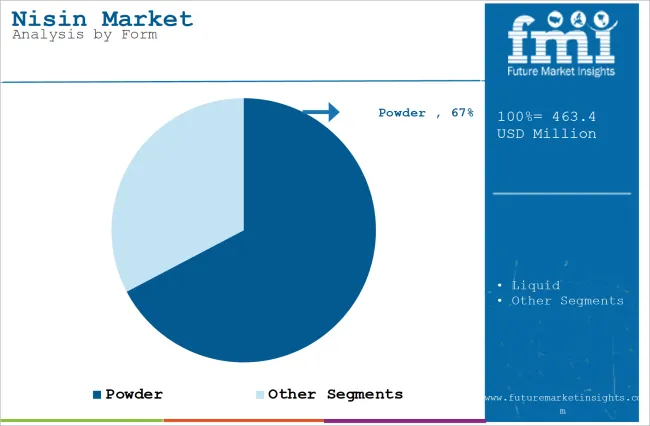
Based on type, the powder segment is likely to witness a higher growth rate during the forecast period owing to the rising applications of powdered nisin across sectors like bakery, dairy, and food & beverages.

Powdered nisin is being increasingly used in processed cheese, bakery products, flavored milk, canned food, and dairy items. Increasing production and consumption of these products will therefore generate high demand for powdered nisin during the forecast period.

Canned Product and Beverage Segments Together Hold a Substantial Share of the Market

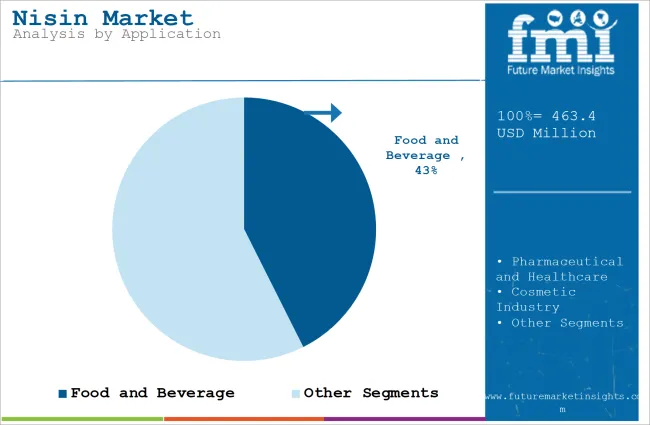
Based on application, canned product, and beverage segments collectively hold a significant share of the global market and the trend is likely to continue during the forecast period. This can be attributed to the rising usage of nisin for preserving beverages and canned products coupled with the high consumption of these products.

The global market for nisin is projected to experience significant growth in the coming years. It is an antimicrobial peptide used primarily as a preservative in canned products. As it grows, so will its application across various industries and categories.

The food and beverage sector is one of the largest consumers of nisin due to its use as a preservative in canned goods, beverages, and processed food items. Dairy products, frozen foods, sauces, and other processed items are also expected to see an increase in demand for this ingredient.

However, the majority of the nisin demand is expected to arise from meat and poultry items due to the growing need for protecting these products from contamination as well as expanding their shelf-lives.

Get the data you need at a Fraction of the cost

Personalize your report by choosing insights you need
and save 40%!

Competitive Landscape

The competitive landscape of the nisin industry is a complex and ever-changing one. Key manufacturers of nisin products are adopting various strategies such as new product launches, mergers, partnerships, acquisitions, facility expansions, and investments in research and development to expand their customer base and gain a competitive edge in the market. For instance,

  • In 2021, DuPont Nutrition & Biosciences launched NovaGARD® NR 100-G, a synergistic blend of two natural ingredients i.e., nisin and rosemary, in the Middle East and Africa. The new antimicrobial and antioxidant solution is effective against gram-positive bacteria and spores and therefore will help end users protect the quality of their products.
  • In January 2022, DSM launched a new integrated Food & Beverage business group to provide a full range of taste, texture, and health solutions to several end users.

Report Scope

Attributes Details
Estimated Market Size (2022) US$ 83.2 million
Projected Market Size (2032) US$ 164.7 million
Anticipated Growth Rate (2022 to 2032) 7.3%
Forecast Period 2022 to 2032
Historical Data Available for 2017 to 2021
Market Analysis US$ million in value
Key Regions Covered
  • North America
  • Eastern Europe
  • Western Europe
  • Japan
  • South America
  • Asian Pacific
  • Middle east and Africa
Key Countries Covered
  • USA
  • Germany
  • France
  • Italy
  • Canada
  • United Kingdom
  • Spain
  • China
  • India
  • Australia
Key Segments Covered
  • Type
  • Application
  • Distribution Channel
  • Region
Key Companies Profiled
  • DSM
  • Galactic
  • Shandong Freda Biotechnology
  • Siveele B.V.
  • DuPont
  • Handary S.A.
  • Cayman Chemical
  • Chihon Biotechnology
  • Amtech Biotech
  • Zhejiang Silver-Elephant Bioengineering
  • Mayasan Biotech
Report Coverage Market Forecast, Company Share Analysis, DROT Analysis, Market Dynamics, Competitive Landscape, Challenges, Strategic Growth Initiatives

Nisin Industry Segmentation by Category: -

By Type:

  • Powder
  • Liquid

By Application:

  • Meat
  • Beverage
  • Bakery Product
  • Canned Product
  • Dairy Product

By Distribution Channel:

  • Online
  • Offline

By Region:

  • North America
  • Latin America
  • Asia Pacific
  • Eastern Europe
  • Western Europe
  • Japan

Frequently Asked Questions

How big is the global market for nisin?

The global nisin market size is assessed to US$ 83.2 million in 2022.

At what rate is the demand for nisin expected to rise between 2022 and 2032?

Between 2022 and 2032, the overall nisin demand is expected to rise at a CAGR of 7.3%.

What is the estimated valuation for the nisin market by the end of 2032?

The global market for nisin is forecast to surpass a valuation of US$ 164.7 million by the end of 2032.

Which are the major countries driving demand for nisin?

The USA, China, Canada, Germany, China, India, the United Kingdom, and Australia are the major countries driving nisin demand.

Australia are the major countries driving nisin demand.

What is the market share of Germany? Germany holds about a 6.1% share of the global market.

Who are the top players operating in the market?

DSM, Galactic, Shandong Freda Biotechnology, Siveele B.V., DuPont, Handary S.A., Cayman Chemical, Cayman Chemicals, Chihon Biotechnology, Amtech Biotech, Zhejiang Silver-Elephant Bioengineering, Mayasan Biotech are expected to be the top players operating in the market.

Table of Content

1. Executive Summary | Nisin Market

    1.1. Global Market Outlook

    1.2. Demand-side Trends

    1.3. Supply-side Trends

    1.4. Technology Roadmap Analysis

    1.5. Analysis and Recommendations

2. Market Overview

    2.1. Market Coverage / Taxonomy

    2.2. Market Definition / Scope / Limitations

3. Market Background

    3.1. Market Dynamics

        3.1.1. Drivers

        3.1.2. Restraints

        3.1.3. Opportunity

        3.1.4. Trends

    3.2. Scenario Forecast

        3.2.1. Demand in Optimistic Scenario

        3.2.2. Demand in Likely Scenario

        3.2.3. Demand in Conservative Scenario

    3.3. Product launches & Recent Developments

    3.4. Product Life Cycle Analysis

    3.5. Value Chain Analysis

        3.5.1. Supply Side Participants and their Roles

            3.5.1.1. Producers

            3.5.1.2. Mid-Level Participants (Traders/ Agents/ Brokers)

            3.5.1.3. Wholesalers and Distributors

        3.5.2. % of Operating Margin Analysis

        3.5.3. List of Raw Material Suppliers

        3.5.4. List of Existing and Potential Buyer’s

    3.6. Global Market - Pricing Analysis

        3.6.1. Price Point Assessment by Region

        3.6.2. Price Point Assessment by Product Type

        3.6.3. Price Forecast till 2032

        3.6.4. Factors affecting pricing

    3.7. Forecast Factors - Relevance & Impact

    3.8. PESTLE and Porter’s Analysis

    3.9. Regulatory Landscape

        3.9.1. Packaging & Labelling Regulations

        3.9.2. Certifications and Certifying Agency Overview

        3.9.3. Import/Export Policies

    3.10. Regional Parent Market Outlook

    3.11. Production and Consumption Statistics

    3.12. Import and Export Statistics

    3.13. Consumers Survey Analysis

    3.14. Macro-Economic Factors

    3.15. Product Claims & Nutritional Information Scan by Buyers

4. Global Analysis 2017 to 2021 and Forecast, 2022 to 2032

    4.1. Historical Market Size Value (US$ million) & Volume (MT) Analysis, 2017 to 2021

    4.2. Current and Future Market Size Value (US$ million) & Volume (MT) Projections, 2022 to 2032

        4.2.1. Y-o-Y Growth Trend Analysis

        4.2.2. Absolute $ Opportunity Analysis

5. Global Analysis 2017 to 2021 and Forecast 2022 to 2032, By Type

    5.1. Introduction / Key Findings

    5.2. Historical Market Size Value (US$ million) & Volume (MT) Analysis By Type, 2017 to 2021

    5.3. Current and Future Market Size Value (US$ million) & Volume (MT) Analysis and Forecast By Type, 2022 to 2032

        5.3.1. Powder

        5.3.2. Liquid

    5.4. Y-o-Y Growth Trend Analysis By Type, 2017 to 2021

    5.5. Absolute $ Opportunity Analysis By Type, 2022 to 2032

6. Global Analysis 2017 to 2021 and Forecast 2022 to 2032, By Application

    6.1. Introduction / Key Findings

    6.2. Historical Market Size Value (US$ million) & Volume (MT) Analysis By Application, 2017 to 2021

    6.3. Current and Future Market Size Value (US$ million) & Volume (MT) Analysis and Forecast By Application, 2022 to 2032

        6.3.1. Meat

        6.3.2. Beverage

        6.3.3. Bakery Product

        6.3.4. Canned Product

        6.3.5. Dairy Product

    6.4. Y-o-Y Growth Trend Analysis By Application, 2017 to 2021

    6.5. Absolute $ Opportunity Analysis By Application, 2022 to 2032

7. Global Analysis 2017 to 2021 and Forecast 2022 to 2032, By Distribution Channel

    7.1. Introduction / Key Findings

    7.2. Historical Market Size Value (US$ million) & Volume (MT) Analysis By Distribution Channel, 2017 to 2021

    7.3. Current and Future Market Size Value (US$ million) & Volume (MT) Analysis and Forecast By Distribution Channel, 2022 to 2032

        7.3.1. Online

        7.3.2. Offline

    7.4. Y-o-Y Growth Trend Analysis By Distribution Channel, 2017 to 2021

    7.5. Absolute $ Opportunity Analysis By Distribution Channel, 2022 to 2032

8. Global Analysis 2017 to 2021 and Forecast 2022 to 2032, By Region

    8.1. Introduction

    8.2. Historical Market Size Value (US$ million) & Volume (MT) Analysis By Region, 2017 to 2021

    8.3. Current Market Size Value (US$ million) & Volume (MT) Analysis and Forecast By Region, 2022 to 2032

        8.3.1. North America

        8.3.2. Latin America

        8.3.3. Europe

        8.3.4. East Asia

        8.3.5. South Asia

        8.3.6. Oceania

        8.3.7. Middle East and Africa (MEA)

    8.4. Market Attractiveness Analysis By Region

9. North America Analysis 2017 to 2021 and Forecast 2022 to 2032, By Country

    9.1. Historical Market Size Value (US$ million) & Volume (MT) Trend Analysis By Market Taxonomy, 2017 to 2021

    9.2. Market Size Value (US$ million) & Volume (MT) Forecast By Market Taxonomy, 2022 to 2032

        9.2.1. By Country

            9.2.1.1. The USA

            9.2.1.2. Canada

        9.2.2. By Type

        9.2.3. By Application

        9.2.4. By Distribution Channel

    9.3. Market Attractiveness Analysis

        9.3.1. By Country

        9.3.2. By Type

        9.3.3. By Application

        9.3.4. By Distribution Channel

    9.4. Key Takeaways

10. Latin America Analysis 2017 to 2021 and Forecast 2022 to 2032, By Country

    10.1. Historical Market Size Value (US$ million) & Volume (MT) Trend Analysis By Market Taxonomy, 2017 to 2021

    10.2. Market Size Value (US$ million) & Volume (MT) Forecast By Market Taxonomy, 2022 to 2032

        10.2.1. By Country

            10.2.1.1. Brazil

            10.2.1.2. Mexico

            10.2.1.3. Argentina

            10.2.1.4. Chile

            10.2.1.5. Peru

            10.2.1.6. Rest of Latin America

        10.2.2. By Type

        10.2.3. By Application

        10.2.4. By Distribution Channel

    10.3. Market Attractiveness Analysis

        10.3.1. By Country

        10.3.2. By Type

        10.3.3. By Application

        10.3.4. By Distribution Channel

    10.4. Key Takeaways

11. Europe Analysis 2017 to 2021 and Forecast 2022 to 2032, By Country

    11.1. Historical Market Size Value (US$ million) & Volume (MT) Trend Analysis By Market Taxonomy, 2017 to 2021

    11.2. Market Size Value (US$ million) & Volume (MT) Forecast By Market Taxonomy, 2022 to 2032

        11.2.1. By Country

            11.2.1.1. Germany

            11.2.1.2. Italy

            11.2.1.3. France

            11.2.1.4. The United Kingdom

            11.2.1.5. Spain

            11.2.1.6. Russia

            11.2.1.7. BENELUX

            11.2.1.8. Poland

            11.2.1.9. Nordic Countries

            11.2.1.10. Rest of Europe

        11.2.2. By Type

        11.2.3. By Application

        11.2.4. By Distribution Channel

    11.3. Market Attractiveness Analysis

        11.3.1. By Country

        11.3.2. By Type

        11.3.3. By Application

        11.3.4. By Distribution Channel

    11.4. Key Takeaways

12. East Asia Analysis 2017 to 2021 and Forecast 2022 to 2032, By Country

    12.1. Historical Market Size Value (US$ million) & Volume (MT) Trend Analysis By Market Taxonomy, 2017 to 2021

    12.2. Market Size Value (US$ million) & Volume (MT) Forecast By Market Taxonomy, 2022 to 2032

        12.2.1. By Country

            12.2.1.1. China

            12.2.1.2. Japan

            12.2.1.3. South Korea

        12.2.2. By Type

        12.2.3. By Application

        12.2.4. By Distribution Channel

    12.3. Market Attractiveness Analysis

        12.3.1. By Country

        12.3.2. By Type

        12.3.3. By Application

        12.3.4. By Distribution Channel

    12.4. Key Takeaways

13. South Asia Analysis 2017 to 2021 and Forecast 2022 to 2032, By Country

    13.1. Historical Market Size Value (US$ million) & Volume (MT) Trend Analysis By Market Taxonomy, 2017 to 2021

    13.2. Market Size Value (US$ million) & Volume (MT) Forecast By Market Taxonomy, 2022 to 2032

        13.2.1. By Country

            13.2.1.1. India

            13.2.1.2. Thailand

            13.2.1.3. Malaysia

            13.2.1.4. Indonesia

            13.2.1.5. Singapore

            13.2.1.6. Rest of South Asia

        13.2.2. By Type

        13.2.3. By Application

        13.2.4. By Distribution Channel

    13.3. Market Attractiveness Analysis

        13.3.1. By Country

        13.3.2. By Type

        13.3.3. By Application

        13.3.4. By Distribution Channel

    13.4. Key Takeaways

14. Oceania Analysis 2017 to 2021 and Forecast 2022 to 2032, By Country

    14.1. Historical Market Size Value (US$ million) & Volume (MT) Trend Analysis By Market Taxonomy, 2017 to 2021

    14.2. Market Size Value (US$ million) & Volume (MT) Forecast By Market Taxonomy, 2022 to 2032

        14.2.1. By Country

            14.2.1.1. Australia

            14.2.1.2. New Zealand

        14.2.2. By Type

        14.2.3. By Application

        14.2.4. By Distribution Channel

    14.3. Market Attractiveness Analysis

        14.3.1. By Country

        14.3.2. By Type

        14.3.3. By Application

        14.3.4. By Distribution Channel

    14.4. Key Takeaways

15. MEA Analysis 2017 to 2021 and Forecast 2022 to 2032, By Country

    15.1. Historical Market Size Value (US$ million) & Volume (MT) Trend Analysis By Market Taxonomy, 2017 to 2021

    15.2. Market Size Value (US$ million) & Volume (MT) Forecast By Market Taxonomy, 2022 to 2032

        15.2.1. By Country

            15.2.1.1. GCC Countries

            15.2.1.2. South Africa

            15.2.1.3. Central Africa

            15.2.1.4. North Africa

        15.2.2. By Type

        15.2.3. By Application

        15.2.4. By Distribution Channel

    15.3. Market Attractiveness Analysis

        15.3.1. By Country

        15.3.2. By Type

        15.3.3. By Application

        15.3.4. By Distribution Channel

    15.4. Key Takeaways

16. Key Countries Analysis

    16.1. The USA

        16.1.1. Pricing Analysis

        16.1.2. Market Share Analysis, 2022

            16.1.2.1. By Type

            16.1.2.2. By Application

            16.1.2.3. By Distribution Channel

    16.2. Canada

        16.2.1. Pricing Analysis

        16.2.2. Market Share Analysis, 2022

            16.2.2.1. By Type

            16.2.2.2. By Application

            16.2.2.3. By Distribution Channel

    16.3. Brazil

        16.3.1. Pricing Analysis

        16.3.2. Market Share Analysis, 2022

            16.3.2.1. By Type

            16.3.2.2. By Application

            16.3.2.3. By Distribution Channel

    16.4. Mexico

        16.4.1. Pricing Analysis

        16.4.2. Market Share Analysis, 2022

            16.4.2.1. By Type

            16.4.2.2. By Application

            16.4.2.3. By Distribution Channel

    16.5. Argentina

        16.5.1. Pricing Analysis

        16.5.2. Market Share Analysis, 2022

            16.5.2.1. By Type

            16.5.2.2. By Application

            16.5.2.3. By Distribution Channel

    16.6. Chile

        16.6.1. Pricing Analysis

        16.6.2. Market Share Analysis, 2022

            16.6.2.1. By Type

            16.6.2.2. By Application

            16.6.2.3. By Distribution Channel

    16.7. Peru

        16.7.1. Pricing Analysis

        16.7.2. Market Share Analysis, 2022

            16.7.2.1. By Type

            16.7.2.2. By Application

            16.7.2.3. By Distribution Channel

    16.8. Germany

        16.8.1. Pricing Analysis

        16.8.2. Market Share Analysis, 2022

            16.8.2.1. By Type

            16.8.2.2. By Application

            16.8.2.3. By Distribution Channel

    16.9. Italy

        16.9.1. Pricing Analysis

        16.9.2. Market Share Analysis, 2022

            16.9.2.1. By Type

            16.9.2.2. By Application

            16.9.2.3. By Distribution Channel

    16.10. France

        16.10.1. Pricing Analysis

        16.10.2. Market Share Analysis, 2022

            16.10.2.1. By Type

            16.10.2.2. By Application

            16.10.2.3. By Distribution Channel

    16.11. Spain

        16.11.1. Pricing Analysis

        16.11.2. Market Share Analysis, 2022

            16.11.2.1. By Type

            16.11.2.2. By Application

            16.11.2.3. By Distribution Channel

    16.12. The United Kingdom

        16.12.1. Pricing Analysis

        16.12.2. Market Share Analysis, 2022

            16.12.2.1. By Type

            16.12.2.2. By Application

            16.12.2.3. By Distribution Channel

    16.13. Russia

        16.13.1. Pricing Analysis

        16.13.2. Market Share Analysis, 2022

            16.13.2.1. By Type

            16.13.2.2. By Application

            16.13.2.3. By Distribution Channel

    16.14. Poland

        16.14.1. Pricing Analysis

        16.14.2. Market Share Analysis, 2022

            16.14.2.1. By Type

            16.14.2.2. By Application

            16.14.2.3. By Distribution Channel

    16.15. BENELUX

        16.15.1. Pricing Analysis

        16.15.2. Market Share Analysis, 2022

            16.15.2.1. By Type

            16.15.2.2. By Application

            16.15.2.3. By Distribution Channel

    16.16. Nordic Countries

        16.16.1. Pricing Analysis

        16.16.2. Market Share Analysis, 2022

            16.16.2.1. By Type

            16.16.2.2. By Application

            16.16.2.3. By Distribution Channel

    16.17. China

        16.17.1. Pricing Analysis

        16.17.2. Market Share Analysis, 2022

            16.17.2.1. By Type

            16.17.2.2. By Application

            16.17.2.3. By Distribution Channel

    16.18. Japan

        16.18.1. Pricing Analysis

        16.18.2. Market Share Analysis, 2022

            16.18.2.1. By Type

            16.18.2.2. By Application

            16.18.2.3. By Distribution Channel

    16.19. South Korea

        16.19.1. Pricing Analysis

        16.19.2. Market Share Analysis, 2022

            16.19.2.1. By Type

            16.19.2.2. By Application

            16.19.2.3. By Distribution Channel

    16.20. India

        16.20.1. Pricing Analysis

        16.20.2. Market Share Analysis, 2022

            16.20.2.1. By Type

            16.20.2.2. By Application

            16.20.2.3. By Distribution Channel

    16.21. Thailand

        16.21.1. Pricing Analysis

        16.21.2. Market Share Analysis, 2022

            16.21.2.1. By Type

            16.21.2.2. By Application

            16.21.2.3. By Distribution Channel

    16.22. Indonesia

        16.22.1. Pricing Analysis

        16.22.2. Market Share Analysis, 2022

            16.22.2.1. By Type

            16.22.2.2. By Application

            16.22.2.3. By Distribution Channel

    16.23. Malaysia

        16.23.1. Pricing Analysis

        16.23.2. Market Share Analysis, 2022

            16.23.2.1. By Type

            16.23.2.2. By Application

            16.23.2.3. By Distribution Channel

    16.24. Singapore

        16.24.1. Pricing Analysis

        16.24.2. Market Share Analysis, 2022

            16.24.2.1. By Type

            16.24.2.2. By Application

            16.24.2.3. By Distribution Channel

    16.25. Australia

        16.25.1. Pricing Analysis

        16.25.2. Market Share Analysis, 2022

            16.25.2.1. By Type

            16.25.2.2. By Application

            16.25.2.3. By Distribution Channel

    16.26. New Zealand

        16.26.1. Pricing Analysis

        16.26.2. Market Share Analysis, 2022

            16.26.2.1. By Type

            16.26.2.2. By Application

            16.26.2.3. By Distribution Channel

    16.27. GCC Countries

        16.27.1. Pricing Analysis

        16.27.2. Market Share Analysis, 2022

            16.27.2.1. By Type

            16.27.2.2. By Application

            16.27.2.3. By Distribution Channel

    16.28. South Africa

        16.28.1. Pricing Analysis

        16.28.2. Market Share Analysis, 2021

            16.28.2.1. By Type

            16.28.2.2. By Application

            16.28.2.3. By Distribution Channel

    16.29. North Africa

        16.29.1. Pricing Analysis

        16.29.2. Market Share Analysis, 2021

            16.29.2.1. By Type

            16.29.2.2. By Application

            16.29.2.3. By Distribution Channel

    16.30. Central Africa

        16.30.1. Pricing Analysis

        16.30.2. Market Share Analysis, 2021

            16.30.2.1. By Type

            16.30.2.2. By Application

            16.30.2.3. By Distribution Channel

17. Market Structure Analysis

    17.1. Competition Dashboard

    17.2. Competition Benchmarking

    17.3. Market Share Analysis of Top Players

        17.3.1. By Regional

        17.3.2. By Type

        17.3.3. By Application

        17.3.4. By Distribution Channel

18. Competition Analysis

    18.1. Competition Deep Dive

        18.1.1. DSM

            18.1.1.1. Overview

            18.1.1.2. Product Portfolio

            18.1.1.3. Profitability by Market Segments (Type /Application/Distribution Channel/Region)

            18.1.1.4. Sales Footprint

            18.1.1.5. Strategy Overview

                18.1.1.5.1. Marketing Strategy

                18.1.1.5.2. Product Strategy

                18.1.1.5.3. Channel Strategy

        18.1.2. Galactic

            18.1.2.1. Overview

            18.1.2.2. Product Portfolio

            18.1.2.3. Profitability by Market Segments (Type /Application/Distribution Channel/Region)

            18.1.2.4. Sales Footprint

            18.1.2.5. Strategy Overview

                18.1.2.5.1. Marketing Strategy

                18.1.2.5.2. Product Strategy

                18.1.2.5.3. Channel Strategy

        18.1.3. Shandong Freda Biotechnology

            18.1.3.1. Overview

            18.1.3.2. Product Portfolio

            18.1.3.3. Profitability by Market Segments (Type /Application/Distribution Channel/Region)

            18.1.3.4. Sales Footprint

            18.1.3.5. Strategy Overview

                18.1.3.5.1. Marketing Strategy

                18.1.3.5.2. Product Strategy

                18.1.3.5.3. Channel Strategy

        18.1.4. Siveele B.V.

            18.1.4.1. Overview

            18.1.4.2. Product Portfolio

            18.1.4.3. Profitability by Market Segments (Type /Application/Distribution Channel/Region)

            18.1.4.4. Sales Footprint

            18.1.4.5. Strategy Overview

                18.1.4.5.1. Marketing Strategy

                18.1.4.5.2. Product Strategy

                18.1.4.5.3. Channel Strategy

        18.1.5. DuPont

            18.1.5.1. Overview

            18.1.5.2. Product Portfolio

            18.1.5.3. Profitability by Market Segments (Type /Application/Distribution Channel/Region)

            18.1.5.4. Sales Footprint

            18.1.5.5. Strategy Overview

                18.1.5.5.1. Marketing Strategy

                18.1.5.5.2. Product Strategy

                18.1.5.5.3. Channel Strategy

        18.1.6. Handary S.A.

            18.1.6.1. Overview

            18.1.6.2. Product Portfolio

            18.1.6.3. Profitability by Market Segments (Type /Application/Distribution Channel/Region)

            18.1.6.4. Sales Footprint

            18.1.6.5. Strategy Overview

                18.1.6.5.1. Marketing Strategy

                18.1.6.5.2. Product Strategy

                18.1.6.5.3. Channel Strategy

        18.1.7. Cayman Chemical

            18.1.7.1. Overview

            18.1.7.2. Product Portfolio

            18.1.7.3. Profitability by Market Segments (Type /Application/Distribution Channel/Region)

            18.1.7.4. Sales Footprint

            18.1.7.5. Strategy Overview

                18.1.7.5.1. Marketing Strategy

                18.1.7.5.2. Product Strategy

                18.1.7.5.3. Channel Strategy

        18.1.8. Cayman Chemicals

            18.1.8.1. Overview

            18.1.8.2. Product Portfolio

            18.1.8.3. Profitability by Market Segments (Type /Application/Distribution Channel/Region)

            18.1.8.4. Sales Footprint

            18.1.8.5. Strategy Overview

                18.1.8.5.1. Marketing Strategy

                18.1.8.5.2. Product Strategy

                18.1.8.5.3. Channel Strategy

        18.1.9. Chihon Biotechnology

            18.1.9.1. Overview

            18.1.9.2. Product Portfolio

            18.1.9.3. Profitability by Market Segments (Type /Application/Distribution Channel/Region)

            18.1.9.4. Sales Footprint

            18.1.9.5. Strategy Overview

                18.1.9.5.1. Marketing Strategy

                18.1.9.5.2. Product Strategy

                18.1.9.5.3. Channel Strategy

        18.1.10. Amtech Biotech

            18.1.10.1. Overview

            18.1.10.2. Product Portfolio

            18.1.10.3. Profitability by Market Segments (Type /Application/Distribution Channel/Region)

            18.1.10.4. Sales Footprint

            18.1.10.5. Strategy Overview

                18.1.10.5.1. Marketing Strategy

                18.1.10.5.2. Product Strategy

                18.1.10.5.3. Channel Strategy

        18.1.11. Zhejiang Silver-Elephant Bioengineering

            18.1.11.1. Overview

            18.1.11.2. Product Portfolio

            18.1.11.3. Profitability by Market Segments (Type /Application/Distribution Channel/Region)

            18.1.11.4. Sales Footprint

            18.1.11.5. Strategy Overview

                18.1.11.5.1. Marketing Strategy

                18.1.11.5.2. Product Strategy

                18.1.11.5.3. Channel Strategy

        18.1.12. Mayasan Biotech

            18.1.12.1. Overview

            18.1.12.2. Product Portfolio

            18.1.12.3. Profitability by Market Segments (Type /Application/Distribution Channel/Region)

            18.1.12.4. Sales Footprint

            18.1.12.5. Strategy Overview

                18.1.12.5.1. Marketing Strategy

                18.1.12.5.2. Product Strategy

                18.1.12.5.3. Channel Strategy

19. Assumptions & Acronyms Used

20. Research Methodology

List of Tables

Table 1: Global Value (US$ million) Forecast by Region, 2017 to 2032

Table 2: Global Volume (MT) Forecast by Region, 2017 to 2032

Table 3: Global Value (US$ million) Forecast by Type, 2017 to 2032

Table 4: Global Volume (MT) Forecast by Type, 2017 to 2032

Table 5: Global Value (US$ million) Forecast by Application, 2017 to 2032

Table 6: Global Volume (MT) Forecast by Application, 2017 to 2032

Table 7: Global Value (US$ million) Forecast by Distribution Channel, 2017 to 2032

Table 8: Global Volume (MT) Forecast by Distribution Channel, 2017 to 2032

Table 9: North America Value (US$ million) Forecast by Country, 2017 to 2032

Table 10: North America Volume (MT) Forecast by Country, 2017 to 2032

Table 11: North America Value (US$ million) Forecast by Type, 2017 to 2032

Table 12: North America Volume (MT) Forecast by Type, 2017 to 2032

Table 13: North America Value (US$ million) Forecast by Application, 2017 to 2032

Table 14: North America Volume (MT) Forecast by Application, 2017 to 2032

Table 15: North America Value (US$ million) Forecast by Distribution Channel, 2017 to 2032

Table 16: North America Volume (MT) Forecast by Distribution Channel, 2017 to 2032

Table 17: Latin America Value (US$ million) Forecast by Country, 2017 to 2032

Table 18: Latin America Volume (MT) Forecast by Country, 2017 to 2032

Table 19: Latin America Value (US$ million) Forecast by Type, 2017 to 2032

Table 20: Latin America Volume (MT) Forecast by Type, 2017 to 2032

Table 21: Latin America Value (US$ million) Forecast by Application, 2017 to 2032

Table 22: Latin America Volume (MT) Forecast by Application, 2017 to 2032

Table 23: Latin America Value (US$ million) Forecast by Distribution Channel, 2017 to 2032

Table 24: Latin America Volume (MT) Forecast by Distribution Channel, 2017 to 2032

Table 25: Europe Value (US$ million) Forecast by Country, 2017 to 2032

Table 26: Europe Volume (MT) Forecast by Country, 2017 to 2032

Table 27: Europe Value (US$ million) Forecast by Type, 2017 to 2032

Table 28: Europe Volume (MT) Forecast by Type, 2017 to 2032

Table 29: Europe Value (US$ million) Forecast by Application, 2017 to 2032

Table 30: Europe Volume (MT) Forecast by Application, 2017 to 2032

Table 31: Europe Value (US$ million) Forecast by Distribution Channel, 2017 to 2032

Table 32: Europe Volume (MT) Forecast by Distribution Channel, 2017 to 2032

Table 33: East Asia Value (US$ million) Forecast by Country, 2017 to 2032

Table 34: East Asia Volume (MT) Forecast by Country, 2017 to 2032

Table 35: East Asia Value (US$ million) Forecast by Type, 2017 to 2032

Table 36: East Asia Volume (MT) Forecast by Type, 2017 to 2032

Table 37: East Asia Value (US$ million) Forecast by Application, 2017 to 2032

Table 38: East Asia Volume (MT) Forecast by Application, 2017 to 2032

Table 39: East Asia Value (US$ million) Forecast by Distribution Channel, 2017 to 2032

Table 40: East Asia Volume (MT) Forecast by Distribution Channel, 2017 to 2032

Table 41: South Asia Value (US$ million) Forecast by Country, 2017 to 2032

Table 42: South Asia Volume (MT) Forecast by Country, 2017 to 2032

Table 43: South Asia Value (US$ million) Forecast by Type, 2017 to 2032

Table 44: South Asia Volume (MT) Forecast by Type, 2017 to 2032

Table 45: South Asia Value (US$ million) Forecast by Application, 2017 to 2032

Table 46: South Asia Volume (MT) Forecast by Application, 2017 to 2032

Table 47: South Asia Value (US$ million) Forecast by Distribution Channel, 2017 to 2032

Table 48: South Asia Volume (MT) Forecast by Distribution Channel, 2017 to 2032

Table 49: Oceania Value (US$ million) Forecast by Country, 2017 to 2032

Table 50: Oceania Volume (MT) Forecast by Country, 2017 to 2032

Table 51: Oceania Value (US$ million) Forecast by Type, 2017 to 2032

Table 52: Oceania Volume (MT) Forecast by Type, 2017 to 2032

Table 53: Oceania Value (US$ million) Forecast by Application, 2017 to 2032

Table 54: Oceania Volume (MT) Forecast by Application, 2017 to 2032

Table 55: Oceania Value (US$ million) Forecast by Distribution Channel, 2017 to 2032

Table 56: Oceania Volume (MT) Forecast by Distribution Channel, 2017 to 2032

Table 57: MEA Value (US$ million) Forecast by Country, 2017 to 2032

Table 58: MEA Volume (MT) Forecast by Country, 2017 to 2032

Table 59: MEA Value (US$ million) Forecast by Type, 2017 to 2032

Table 60: MEA Volume (MT) Forecast by Type, 2017 to 2032

Table 61: MEA Value (US$ million) Forecast by Application, 2017 to 2032

Table 62: MEA Volume (MT) Forecast by Application, 2017 to 2032

Table 63: MEA Value (US$ million) Forecast by Distribution Channel, 2017 to 2032

Table 64: MEA Volume (MT) Forecast by Distribution Channel, 2017 to 2032

List of Charts

Figure 1: Global Value (US$ million) by Type, 2022 to 2032

Figure 2: Global Value (US$ million) by Application, 2022 to 2032

Figure 3: Global Value (US$ million) by Distribution Channel, 2022 to 2032

Figure 4: Global Value (US$ million) by Region, 2022 to 2032

Figure 5: Global Value (US$ million) Analysis by Region, 2017 to 2032

Figure 6: Global Volume (MT) Analysis by Region, 2017 to 2032

Figure 7: Global Value Share (%) and BPS Analysis by Region, 2022 to 2032

Figure 8: Global Y-o-Y Growth (%) Projections by Region, 2022 to 2032

Figure 9: Global Value (US$ million) Analysis by Type, 2017 to 2032

Figure 10: Global Volume (MT) Analysis by Type, 2017 to 2032

Figure 11: Global Value Share (%) and BPS Analysis by Type, 2022 to 2032

Figure 12: Global Y-o-Y Growth (%) Projections by Type, 2022 to 2032

Figure 13: Global Value (US$ million) Analysis by Application, 2017 to 2032

Figure 14: Global Volume (MT) Analysis by Application, 2017 to 2032

Figure 15: Global Value Share (%) and BPS Analysis by Application, 2022 to 2032

Figure 16: Global Y-o-Y Growth (%) Projections by Application, 2022 to 2032

Figure 17: Global Value (US$ million) Analysis by Distribution Channel, 2017 to 2032

Figure 18: Global Volume (MT) Analysis by Distribution Channel, 2017 to 2032

Figure 19: Global Value Share (%) and BPS Analysis by Distribution Channel, 2022 to 2032

Figure 20: Global Y-o-Y Growth (%) Projections by Distribution Channel, 2022 to 2032

Figure 21: Global Attractiveness by Type, 2022 to 2032

Figure 22: Global Attractiveness by Application, 2022 to 2032

Figure 23: Global Attractiveness by Distribution Channel, 2022 to 2032

Figure 24: Global Attractiveness by Region, 2022 to 2032

Figure 25: North America Value (US$ million) by Type, 2022 to 2032

Figure 26: North America Value (US$ million) by Application, 2022 to 2032

Figure 27: North America Value (US$ million) by Distribution Channel, 2022 to 2032

Figure 28: North America Value (US$ million) by Country, 2022 to 2032

Figure 29: North America Value (US$ million) Analysis by Country, 2017 to 2032

Figure 30: North America Volume (MT) Analysis by Country, 2017 to 2032

Figure 31: North America Value Share (%) and BPS Analysis by Country, 2022 to 2032

Figure 32: North America Y-o-Y Growth (%) Projections by Country, 2022 to 2032

Figure 33: North America Value (US$ million) Analysis by Type, 2017 to 2032

Figure 34: North America Volume (MT) Analysis by Type, 2017 to 2032

Figure 35: North America Value Share (%) and BPS Analysis by Type, 2022 to 2032

Figure 36: North America Y-o-Y Growth (%) Projections by Type, 2022 to 2032

Figure 37: North America Value (US$ million) Analysis by Application, 2017 to 2032

Figure 38: North America Volume (MT) Analysis by Application, 2017 to 2032

Figure 39: North America Value Share (%) and BPS Analysis by Application, 2022 to 2032

Figure 40: North America Y-o-Y Growth (%) Projections by Application, 2022 to 2032

Figure 41: North America Value (US$ million) Analysis by Distribution Channel, 2017 to 2032

Figure 42: North America Volume (MT) Analysis by Distribution Channel, 2017 to 2032

Figure 43: North America Value Share (%) and BPS Analysis by Distribution Channel, 2022 to 2032

Figure 44: North America Y-o-Y Growth (%) Projections by Distribution Channel, 2022 to 2032

Figure 45: North America Attractiveness by Type, 2022 to 2032

Figure 46: North America Attractiveness by Application, 2022 to 2032

Figure 47: North America Attractiveness by Distribution Channel, 2022 to 2032

Figure 48: North America Attractiveness by Country, 2022 to 2032

Figure 49: Latin America Value (US$ million) by Type, 2022 to 2032

Figure 50: Latin America Value (US$ million) by Application, 2022 to 2032

Figure 51: Latin America Value (US$ million) by Distribution Channel, 2022 to 2032

Figure 52: Latin America Value (US$ million) by Country, 2022 to 2032

Figure 53: Latin America Value (US$ million) Analysis by Country, 2017 to 2032

Figure 54: Latin America Volume (MT) Analysis by Country, 2017 to 2032

Figure 55: Latin America Value Share (%) and BPS Analysis by Country, 2022 to 2032

Figure 56: Latin America Y-o-Y Growth (%) Projections by Country, 2022 to 2032

Figure 57: Latin America Value (US$ million) Analysis by Type, 2017 to 2032

Figure 58: Latin America Volume (MT) Analysis by Type, 2017 to 2032

Figure 59: Latin America Value Share (%) and BPS Analysis by Type, 2022 to 2032

Figure 60: Latin America Y-o-Y Growth (%) Projections by Type, 2022 to 2032

Figure 61: Latin America Value (US$ million) Analysis by Application, 2017 to 2032

Figure 62: Latin America Volume (MT) Analysis by Application, 2017 to 2032

Figure 63: Latin America Value Share (%) and BPS Analysis by Application, 2022 to 2032

Figure 64: Latin America Y-o-Y Growth (%) Projections by Application, 2022 to 2032

Figure 65: Latin America Value (US$ million) Analysis by Distribution Channel, 2017 to 2032

Figure 66: Latin America Volume (MT) Analysis by Distribution Channel, 2017 to 2032

Figure 67: Latin America Value Share (%) and BPS Analysis by Distribution Channel, 2022 to 2032

Figure 68: Latin America Y-o-Y Growth (%) Projections by Distribution Channel, 2022 to 2032

Figure 69: Latin America Attractiveness by Type, 2022 to 2032

Figure 70: Latin America Attractiveness by Application, 2022 to 2032

Figure 71: Latin America Attractiveness by Distribution Channel, 2022 to 2032

Figure 72: Latin America Attractiveness by Country, 2022 to 2032

Figure 73: Europe Value (US$ million) by Type, 2022 to 2032

Figure 74: Europe Value (US$ million) by Application, 2022 to 2032

Figure 75: Europe Value (US$ million) by Distribution Channel, 2022 to 2032

Figure 76: Europe Value (US$ million) by Country, 2022 to 2032

Figure 77: Europe Value (US$ million) Analysis by Country, 2017 to 2032

Figure 78: Europe Volume (MT) Analysis by Country, 2017 to 2032

Figure 79: Europe Value Share (%) and BPS Analysis by Country, 2022 to 2032

Figure 80: Europe Y-o-Y Growth (%) Projections by Country, 2022 to 2032

Figure 81: Europe Value (US$ million) Analysis by Type, 2017 to 2032

Figure 82: Europe Volume (MT) Analysis by Type, 2017 to 2032

Figure 83: Europe Value Share (%) and BPS Analysis by Type, 2022 to 2032

Figure 84: Europe Y-o-Y Growth (%) Projections by Type, 2022 to 2032

Figure 85: Europe Value (US$ million) Analysis by Application, 2017 to 2032

Figure 86: Europe Volume (MT) Analysis by Application, 2017 to 2032

Figure 87: Europe Value Share (%) and BPS Analysis by Application, 2022 to 2032

Figure 88: Europe Y-o-Y Growth (%) Projections by Application, 2022 to 2032

Figure 89: Europe Value (US$ million) Analysis by Distribution Channel, 2017 to 2032

Figure 90: Europe Volume (MT) Analysis by Distribution Channel, 2017 to 2032

Figure 91: Europe Value Share (%) and BPS Analysis by Distribution Channel, 2022 to 2032

Figure 92: Europe Y-o-Y Growth (%) Projections by Distribution Channel, 2022 to 2032

Figure 93: Europe Attractiveness by Type, 2022 to 2032

Figure 94: Europe Attractiveness by Application, 2022 to 2032

Figure 95: Europe Attractiveness by Distribution Channel, 2022 to 2032

Figure 96: Europe Attractiveness by Country, 2022 to 2032

Figure 97: East Asia Value (US$ million) by Type, 2022 to 2032

Figure 98: East Asia Value (US$ million) by Application, 2022 to 2032

Figure 99: East Asia Value (US$ million) by Distribution Channel, 2022 to 2032

Figure 100: East Asia Value (US$ million) by Country, 2022 to 2032

Figure 101: East Asia Value (US$ million) Analysis by Country, 2017 to 2032

Figure 102: East Asia Volume (MT) Analysis by Country, 2017 to 2032

Figure 103: East Asia Value Share (%) and BPS Analysis by Country, 2022 to 2032

Figure 104: East Asia Y-o-Y Growth (%) Projections by Country, 2022 to 2032

Figure 105: East Asia Value (US$ million) Analysis by Type, 2017 to 2032

Figure 106: East Asia Volume (MT) Analysis by Type, 2017 to 2032

Figure 107: East Asia Value Share (%) and BPS Analysis by Type, 2022 to 2032

Figure 108: East Asia Y-o-Y Growth (%) Projections by Type, 2022 to 2032

Figure 109: East Asia Value (US$ million) Analysis by Application, 2017 to 2032

Figure 110: East Asia Volume (MT) Analysis by Application, 2017 to 2032

Figure 111: East Asia Value Share (%) and BPS Analysis by Application, 2022 to 2032

Figure 112: East Asia Y-o-Y Growth (%) Projections by Application, 2022 to 2032

Figure 113: East Asia Value (US$ million) Analysis by Distribution Channel, 2017 to 2032

Figure 114: East Asia Volume (MT) Analysis by Distribution Channel, 2017 to 2032

Figure 115: East Asia Value Share (%) and BPS Analysis by Distribution Channel, 2022 to 2032

Figure 116: East Asia Y-o-Y Growth (%) Projections by Distribution Channel, 2022 to 2032

Figure 117: East Asia Attractiveness by Type, 2022 to 2032

Figure 118: East Asia Attractiveness by Application, 2022 to 2032

Figure 119: East Asia Attractiveness by Distribution Channel, 2022 to 2032

Figure 120: East Asia Attractiveness by Country, 2022 to 2032

Figure 121: South Asia Value (US$ million) by Type, 2022 to 2032

Figure 122: South Asia Value (US$ million) by Application, 2022 to 2032

Figure 123: South Asia Value (US$ million) by Distribution Channel, 2022 to 2032

Figure 124: South Asia Value (US$ million) by Country, 2022 to 2032

Figure 125: South Asia Value (US$ million) Analysis by Country, 2017 to 2032

Figure 126: South Asia Volume (MT) Analysis by Country, 2017 to 2032

Figure 127: South Asia Value Share (%) and BPS Analysis by Country, 2022 to 2032

Figure 128: South Asia Y-o-Y Growth (%) Projections by Country, 2022 to 2032

Figure 129: South Asia Value (US$ million) Analysis by Type, 2017 to 2032

Figure 130: South Asia Volume (MT) Analysis by Type, 2017 to 2032

Figure 131: South Asia Value Share (%) and BPS Analysis by Type, 2022 to 2032

Figure 132: South Asia Y-o-Y Growth (%) Projections by Type, 2022 to 2032

Figure 133: South Asia Value (US$ million) Analysis by Application, 2017 to 2032

Figure 134: South Asia Volume (MT) Analysis by Application, 2017 to 2032

Figure 135: South Asia Value Share (%) and BPS Analysis by Application, 2022 to 2032

Figure 136: South Asia Y-o-Y Growth (%) Projections by Application, 2022 to 2032

Figure 137: South Asia Value (US$ million) Analysis by Distribution Channel, 2017 to 2032

Figure 138: South Asia Volume (MT) Analysis by Distribution Channel, 2017 to 2032

Figure 139: South Asia Value Share (%) and BPS Analysis by Distribution Channel, 2022 to 2032

Figure 140: South Asia Y-o-Y Growth (%) Projections by Distribution Channel, 2022 to 2032

Figure 141: South Asia Attractiveness by Type, 2022 to 2032

Figure 142: South Asia Attractiveness by Application, 2022 to 2032

Figure 143: South Asia Attractiveness by Distribution Channel, 2022 to 2032

Figure 144: South Asia Attractiveness by Country, 2022 to 2032

Figure 145: Oceania Value (US$ million) by Type, 2022 to 2032

Figure 146: Oceania Value (US$ million) by Application, 2022 to 2032

Figure 147: Oceania Value (US$ million) by Distribution Channel, 2022 to 2032

Figure 148: Oceania Value (US$ million) by Country, 2022 to 2032

Figure 149: Oceania Value (US$ million) Analysis by Country, 2017 to 2032

Figure 150: Oceania Volume (MT) Analysis by Country, 2017 to 2032

Figure 151: Oceania Value Share (%) and BPS Analysis by Country, 2022 to 2032

Figure 152: Oceania Y-o-Y Growth (%) Projections by Country, 2022 to 2032

Figure 153: Oceania Value (US$ million) Analysis by Type, 2017 to 2032

Figure 154: Oceania Volume (MT) Analysis by Type, 2017 to 2032

Figure 155: Oceania Value Share (%) and BPS Analysis by Type, 2022 to 2032

Figure 156: Oceania Y-o-Y Growth (%) Projections by Type, 2022 to 2032

Figure 157: Oceania Value (US$ million) Analysis by Application, 2017 to 2032

Figure 158: Oceania Volume (MT) Analysis by Application, 2017 to 2032

Figure 159: Oceania Value Share (%) and BPS Analysis by Application, 2022 to 2032

Figure 160: Oceania Y-o-Y Growth (%) Projections by Application, 2022 to 2032

Figure 161: Oceania Value (US$ million) Analysis by Distribution Channel, 2017 to 2032

Figure 162: Oceania Volume (MT) Analysis by Distribution Channel, 2017 to 2032

Figure 163: Oceania Value Share (%) and BPS Analysis by Distribution Channel, 2022 to 2032

Figure 164: Oceania Y-o-Y Growth (%) Projections by Distribution Channel, 2022 to 2032

Figure 165: Oceania Attractiveness by Type, 2022 to 2032

Figure 166: Oceania Attractiveness by Application, 2022 to 2032

Figure 167: Oceania Attractiveness by Distribution Channel, 2022 to 2032

Figure 168: Oceania Attractiveness by Country, 2022 to 2032

Figure 169: MEA Value (US$ million) by Type, 2022 to 2032

Figure 170: MEA Value (US$ million) by Application, 2022 to 2032

Figure 171: MEA Value (US$ million) by Distribution Channel, 2022 to 2032

Figure 172: MEA Value (US$ million) by Country, 2022 to 2032

Figure 173: MEA Value (US$ million) Analysis by Country, 2017 to 2032

Figure 174: MEA Volume (MT) Analysis by Country, 2017 to 2032

Figure 175: MEA Value Share (%) and BPS Analysis by Country, 2022 to 2032

Figure 176: MEA Y-o-Y Growth (%) Projections by Country, 2022 to 2032

Figure 177: MEA Value (US$ million) Analysis by Type, 2017 to 2032

Figure 178: MEA Volume (MT) Analysis by Type, 2017 to 2032

Figure 179: MEA Value Share (%) and BPS Analysis by Type, 2022 to 2032

Figure 180: MEA Y-o-Y Growth (%) Projections by Type, 2022 to 2032

Figure 181: MEA Value (US$ million) Analysis by Application, 2017 to 2032

Figure 182: MEA Volume (MT) Analysis by Application, 2017 to 2032

Figure 183: MEA Value Share (%) and BPS Analysis by Application, 2022 to 2032

Figure 184: MEA Y-o-Y Growth (%) Projections by Application, 2022 to 2032

Figure 185: MEA Value (US$ million) Analysis by Distribution Channel, 2017 to 2032

Figure 186: MEA Volume (MT) Analysis by Distribution Channel, 2017 to 2032

Figure 187: MEA Value Share (%) and BPS Analysis by Distribution Channel, 2022 to 2032

Figure 188: MEA Y-o-Y Growth (%) Projections by Distribution Channel, 2022 to 2032

Figure 189: MEA Attractiveness by Type, 2022 to 2032

Figure 190: MEA Attractiveness by Application, 2022 to 2032

Figure 191: MEA Attractiveness by Distribution Channel, 2022 to 2032

Figure 192: MEA Attractiveness by Country, 2022 to 2032

Recommendations

Food and Beverage

Sweetener Market

Published : March 2024

Food and Beverage

Food Additive Market

Published : January 2024

Food and Beverage

Natural Food Colors Market

Published : February 2023

Food and Beverage

Food Coating Ingredients Market

Published : June 2022

Explore Food and Beverage Insights

View Reports