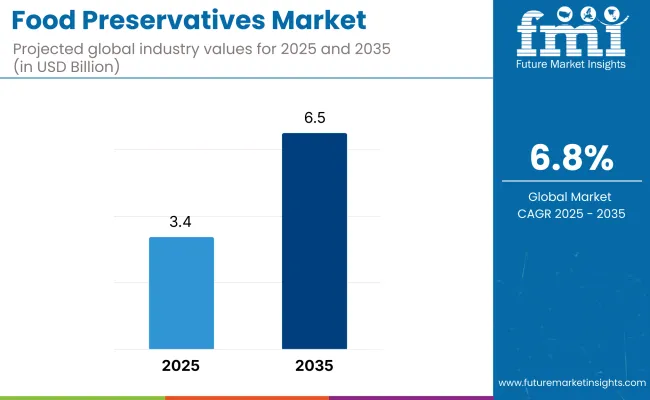
The global food preservatives market is estimated to be worth USD 3.4 billion by 2025 and is projected to reach a value of USD 6.5 billion by 2035, reflecting a CAGR of 6.8% over the assessment period 2025 to 2035.
The sector has been influenced by a confluence of rising urbanization, a shift in consumer dietary patterns towards packaged food, and heightened concerns about microbial contamination and food spoilage. This growth is being largely attributed to increasing demand for safe, shelf-stable, and minimally processed food, particularly in the context of expanding retail networks and frozen food penetration across developing economies.
The clean label preservatives segment is anticipated to hold the dominant share by 2025, accounting for 28.7% of the market. These natural-origin preservatives, often derived from herbs, plant extracts, or fermentation by-products, are being increasingly adopted in response to regulatory pushback against synthetic additives and the rise of "free-from" food product lines.
The influence of North America and Europe in steering clean label and natural preservation trends has been notable, though Asia Pacific is poised to witness the highest CAGR due to rising processed food consumption and a growing middle-class population.
According to data from the USA Food and Drug Administration (FDA), food safety regulations have significantly impacted preservative usage, with a clear shift towards GRAS (Generally Recognized As Safe) certified ingredients.
Meanwhile, manufacturers are also pushing for innovations that combine antimicrobial efficiency with sensory neutrality and functional benefits. For instance, Kerry Group, in its 2024 sustainability report, stated: "Our global portfolio of fermented-based clean label preservatives is expanding rapidly in response to demand for ingredient transparency and product integrity." - Kerry Clean Label Solutions, 2024.
Further bolstering the market outlook are the investments in preservation technologies such as encapsulation, controlled-release systems, and active packaging, which improve the efficacy and stability of preservatives.
In this scenario, companies like IFF Nutrition & Biosciences and BASF SE are focusing on R&D to support customized preservation strategies across multiple product categories including dairy, bakery, meat, and beverages. Regulatory harmonization across countries, enhanced traceability, and the emergence of blockchain in supply chain transparency are expected to further consolidate market growth over the next decade.
| Particular | Value CAGR |
|---|---|
| H1 (2024 to 2034) | 6.6% |
| H2 (2024 to 2034) | 7.0% |
| H1 (2025 to 2035) | 6.9% |
| H2 (2025 to 2035) | 7.5% |
The below table presents a comparative assessment of the variation in CAGR over six months for the base year (2024) and the current year (2025) for the global food preservatives industry. This analysis highlights critical shifts in performance and revenue realization patterns, providing stakeholders with insights into the iindustry's trajectory over the year. The first half of the year, or H1, spans from January to June. The second half, H2, includes the months from July to December.
In the first half (H1) of the decade from 2025 to 2035, the industry is projected to expand at a CAGR of 6.6%, followed by an accelerated growth rate of 7% in the second half (H2) of the same decade. Moving into the subsequent period, from H1 2025 to H2 2035, the CAGR is expected to increase to 6.9% in the first half and remain high at 7.5% in the second half.
In the first half (H1), the sector witnessed an increase of 40 BPS, driven by the rising demand for natural food preservatives and stricter regulations on synthetic additives. In the second half (H2), the industry recorded a 20 BPS increase, attributed to innovations in formulation technologies and expanding applications across processed food categories.
The first half of the year was influenced by rising consumer demand for preservative-free and clean-label food options, while the second half saw an increased focus on sustainable ingredient sourcing and formulation advancements. As the industry adapts to evolving consumer preferences and regulatory shifts, continuous innovation in preservation technologies will drive long-term growth in the global food preservatives industry.
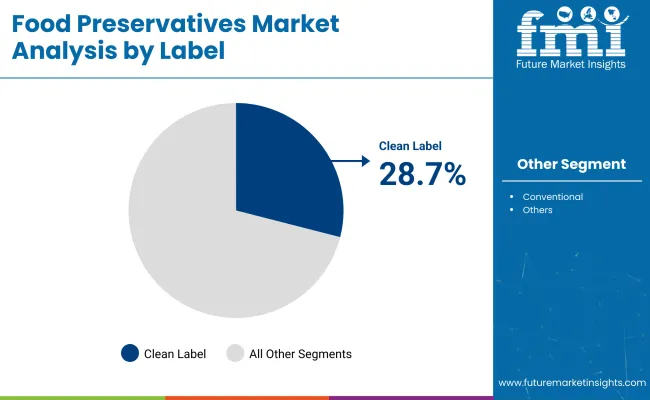
The clean label preservatives segment is projected to expand at a CAGR of 8.1% between 2025 and 2035, holding approximately 28.7% of the global food preservatives market in 2025. This segment has been experiencing outsized growth compared to synthetic alternatives, propelled by increased regulatory scrutiny and consumer preference for natural ingredients with transparent sourcing.
The rise in health-conscious consumption patterns has necessitated a significant pivot across the processed food and beverage industries. Clean label preservatives, often plant-based or fermentation-derived, are increasingly being favored for their ability to extend shelf life while aligning with ethical and environmental narratives.
Their adoption has been further strengthened by clean-label reformulations across bakery, dairy, meat, and beverage categories, where traditional additives have come under pressure. As trust and transparency become commercial imperatives, these preservatives are being positioned not only as safety enhancers but also as functional ingredients supporting label claims like “natural,” “organic,” or “non-GMO.”
The segment’s future will be shaped by continued innovations in formulation science, particularly the integration of antimicrobial peptides, polyphenol-rich extracts, and fermented ingredients. Strategic partnerships between food manufacturers and ingredient innovators will remain critical in translating clean-label preservation into scalable commercial success while meeting global regulatory standards.
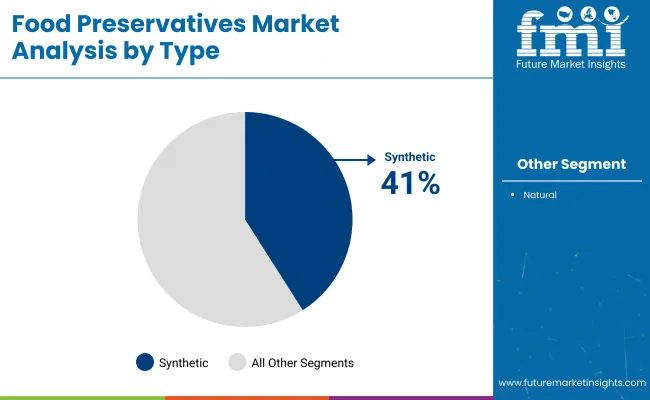
The synthetic preservatives segment is anticipated to grow at a slower but steady CAGR of 4.2% through 2035, accounting for over 41% of the total market share in 2025. This segment remains entrenched within high-volume, cost-sensitive applications in processed foods and beverages across developing regions where economic constraints outweigh clean-label considerations.
Despite ongoing public health discourse and evolving food safety regulations in North America and Europe, synthetic preservatives continue to serve a vital role in extending shelf life, preventing microbial growth, and ensuring supply chain efficiency.
Their functionality, stability under extreme processing conditions, and affordability have kept them relevant-especially in long-shelf-life categories like snacks, frozen meals, and ready-to-eat items. That said, the segment is witnessing growing bifurcation, with certain compounds being phased out under stricter regional bans while others are being reformulated to meet evolving toxicology standards.
Future competitiveness will depend on toxicological validation, improved perception through science-backed safety communication, and application in hybrid preservation models combining synthetic and natural agents.
Investment in next-generation synthetics with lower dosage efficacy and improved biodegradability may also offer a route to sustain relevance. For many global food players, synthetic preservatives continue to represent a necessary bridge between food safety assurance and cost optimization.
The global food preservatives sector is characterized by a fragmented competitive landscape, with a mix of regional and international players. Regional manufacturers play a crucial role in the industry, catering to the growing demand for natural, clean-label, and locally sourced preservatives. These companies are leveraging their proximity to raw material sources and evolving consumer preferences to strengthen their positions.
Across North America, regional producers focus on plant-based and fermentation-derived preservatives to meet the increasing regulatory scrutiny on synthetic additives. They emphasize sustainable production and localized distribution to gain a competitive edge. In Europe, smaller players are investing in organic and bio-based preservatives, capitalizing on the region's stringent food safety regulations and consumer demand for chemical-free alternatives.
Meanwhile, in Asia-Pacific, local manufacturers benefit from the region’s vast agricultural resources, offering naturally sourced preservatives at competitive prices. The high demand for convenience foods in this region has further accelerated the need for cost-effective preservation solutions.
In Latin America and the Middle East & Africa, regional players cater to traditional and ethnic food processing industries, providing preservative solutions suited to regional dietary preferences. The increasing consumption of processed and packaged foods has driven local companies to innovate with natural antimicrobial agents, leveraging botanical and spice extracts as preservatives.
Regional players continue to expand production capacities and collaborate with food processors to develop customized solutions. Their ability to adapt to key trends, regulatory changes, and consumer preferences positions them as key contributors to the evolving global food preservatives industry landscape.
Food preservatives producers follow a stringent industry characterized with changing regulations and dynamic consumer behavior. Many synthetic preservatives have fallen under intense regulatory scrutiny, especially in industries where authorities have banned or restricted additives such as BHA and BHT. The subsequent push for reformulation by companies, in light of regulatory pressure, translates to rising R&D costs. Meanwhile, consumer demand is increasingly trending toward “clean label” products, forcing manufacturers to look for natural substitutes.
Natural preservative sources, for example, plant extracts or fermenters, have their own supply chain vulnerabilities based on seasonality and changing agricultural yields. As the price and availability of agricultural products change, companies will have to adjust their suppliers and procurement levels, potentially causing price volatility or shortages that may render certain products inconsistent in quality and quantity, affecting product development and production continuity.
Overall, the preservatives industry faces challenges to balance the stringent regulatory requirements, higher costs, and lack of predictability of natural ingredients with consumer demand for healthier, cleaner products.
Strong price differentiation between synthetic and natural solutions in the food preservatives industry influences pricing strategies. Natural preservatives fit the clean-label trends but are premium-priced, as they cost more to produce and are seen to have additional health benefits. This often means that food manufacturers are even willing to pay 2-3 times more for natural options because it secures the desired "clean" image, even though they tend to not be as powerful as synthetic counterparts and therefore require higher usage levels.
Unlike synthetic preservatives, which employ a cost-plus pricing model that leverages lower production costs and economies of scale, particularly for bulk purchases to large bakeries and beverage companies.
Suppliers also used bundled pricing, combining preservatives with complementary additives like antioxidants or emulsifiers in a package deal at a discount compared with the separate purchase of the components. In addition, tiered pricing based on order size has become common, with larger discounts provided for high-volume contracts, and thus providing an incentive to maintain long-standing relationships with the large food producers.
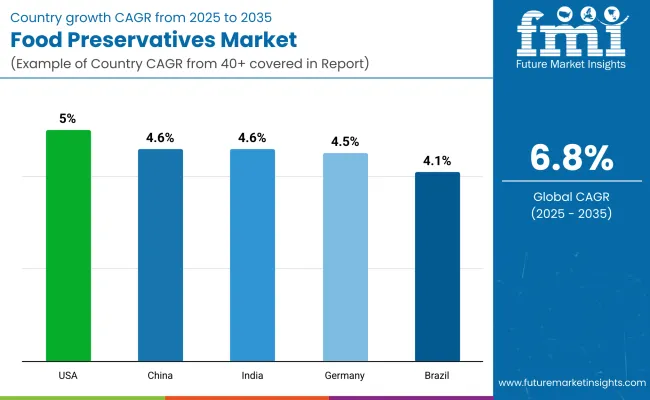
| Countries | Value (2035) |
|---|---|
| The USA | 5.0% |
| China | 4.67% |
| India | 4.62% |
| Germany | 4.5% |
| Brazil | 4.1% |
As per FMI, the United States is one of the leading contributors to the global industry of food preservatives, which is expanding at 5.0% CAGR. Rising intake of processed foods and convenience foods, which require additives to impart shelf life and safety, triggers demand for preservatives. Processed foods comprise almost 70% of the American diet, as quoted by the USDA, thus triggering demand for preservation methods.
A move towards natural and clean-label preservatives is transforming the industry with growing health awareness and FDA regulation of food. Kerry Group and Corbion are among the players investing in plant-based preservatives, including rosemary extract, vinegar, and cultured dextrose, to address consumer needs. The American food industry is also embracing fermentation-based preservation technologies like bacteriocins as a substitute for artificial additives.
Growth Drivers in the USA
| Key Drivers | Details |
|---|---|
| Increased consumption of processed foods | Processed foods constitute ~70% of American diet |
| Regulatory effect | FDA restrictions on synthetic preservatives |
| Increasing demand for natural alternatives | Appearance of plant-based preservatives such as vinegar and rosemary extract |
| Investment in fermentation-based technologies | Companies producing bacteriocins as substitutes |
According to a study by FMI, China is anticipated to see growth in its food preservative industry at a CAGR of 4.67% on the basis of urbanization and changing lifestyles. Urbanization is pushing the growth in the consumption of processed food, with sharper spikes being felt in urban agglomerations. Food safety regulations have consequently been tightened in China after food contamination scandals rocked the nation, leaving firms with a necessity to tone down artificial preservatives and instead explore traditional preservation techniques.
While synthetic preservatives still dominate with economic benefits, local giant firms are also investing in natural ones like tea polyphenols and plant-source antioxidants. Angel Yeast is one of the firms investing in fermentation preservation technology in a bid to fight rising consumers' demand for healthy food.
Growth Drivers in the China
| Key Drivers | Details |
|---|---|
| Rapid urbanization | Rising demand for convenience food and packaged foods |
| Rising regulation on food safety | Tightening restriction on the use of synthetic preservatives |
| Degree of demand for natural preservatives | Growth in use of tea polyphenols and plant antioxidants |
| Investment towards fermentation process | Domestic players concentrating on value-added preservation process |
India's food preservative industry is growing at a 4.62% CAGR with rising disposable incomes, urbanization, and demand for ready-to-eat foods. Multicultural cuisine needs multiple solutions for preservatives to cater to a variety of regional food.
Conventional preservation methods such as salt, spices, and fermentation are common in the industry, but commercially relevant natural preservatives are becoming the trend. Laws such as the food safety rules by FSSAI are imposing tighter regulations on artificial preservatives, and the industry is being compelled towards safer and natural preservatives. Turmeric and neem extracts are emerging as increasingly popular products in Indian markets.
Growth Drivers in the India
| Key Drivers | Details |
|---|---|
| Convenience food growth | Growing demand for processed and ready-to-use foods |
| Government regulations | FSSAI encouraging natural and safer preservatives |
| Natural preservation due to cultural preference | Higher use of turmeric, neem, and spice extracts |
| Price-sensitive market | Cost-effective preservation methods to be used for driving mass usage |
Germany's food preservation sector is based on high demand for natural ingredients and stringent EU regulations. Its food processing sector is very well established in dairy processing, bread production, and meat product processing, where the use of preservatives is the foundation of their process.
The European Food Safety Authority (EFSA) maintains tight controls on man-made preservatives, pushing the industry to shift towards natural preservatives like tocopherols (Vitamin E), rosemary extract, and vinegar.
Germany is the largest organic food industry in Europe, with more than €15 billion sales in 2022. Demand for clean-label spurs innovation of alternative preservation technologies, such as fermentative preservation and antimicrobial peptides. Increased demand for vegan and plant-based foods also fuels demand for natural preservatives.
Growth Drivers in the Germany
| Key Drivers | Details |
|---|---|
| Regulatory pressure | EU strict regulations, EFSA limits application of synthetic preservatives |
| Largest European organic food market | Organic food sales over €15 billion in 2022 |
| Meat industry change | Shift from nitrites to natural alternatives |
| Emerging plant food industry | Emerging demand for natural preservatives for plant foods |
It is the Latin America region's fastest-growing food preservative sector, driven by its humongous food processing industry that accounts for nearly 10% of GDP for Brazil. Food spoils quicker under the country's tropical and humid climatic conditions, so it becomes increasingly reliant on natural and artificial preservatives to extend shelf life.
Brazil is the world-leading nation in beef and chicken exportation, wherein natural preservatives such as nitrites and lactates are central to product preservation quality. Production of soft drinks, also on enormous scales, is done in Brazil with tremendous outputs creating natural preservatives demand, e.g., ascorbic acid and citric acid. Clean labeling trends generate a shift away from using artificial additives to plant-based preservation.
Growth Drivers in the Brazil
| Key Drivers | Details |
|---|---|
| Food processing industry is growing | Food and beverage industry contributes ~10% to GDP |
| Extremely high production of meat and dairy | Excessive use of nitrites, lactates, and sorbates |
| Climate-related preservation requirements | Hot and humid climatic conditions enable food to spoil quicker |
| Natural drink preservative growth | Ascorbic acid and citric acid enhanced usage |
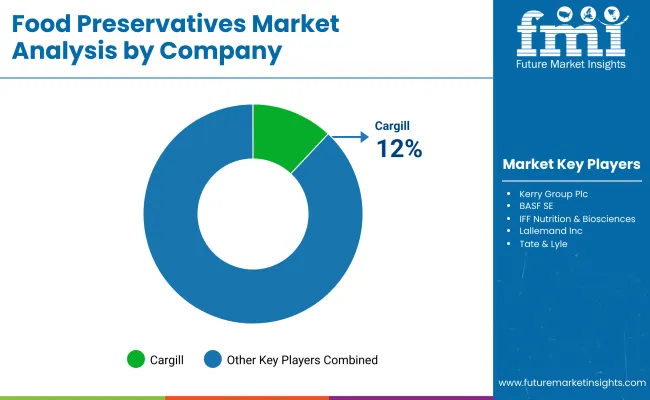
Cargill, Incorporated (12-16%)
A global leader in food ingredients, Cargill focuses on developing innovative, natural, and synthetic preservative solutions for multiple food categories.
Kerry Group Plc (10-14%)
Kerry Group is known for its expertise in natural preservation and antimicrobial systems, catering to the growing demand for clean-label food products.
BASF SE (8-12%)
BASF provides a diverse range of food preservation solutions, ensuring extended shelf life and food safety compliance.
IFF Nutrition & Biosciences (7-11%)
A key player in bio-based and fermentation-derived preservatives, focusing on sustainable and natural food preservation methods.
Lallemand Inc. (6-10%)
A leader in yeast and fermentation technology, Lallemand offers natural preservatives for various food and beverage applications.
Other Key Players (40-50% Combined)
The market is segmented into clean label and conventional preservatives.
The market is categorized as synthetic and natural preservatives.
The segmentation includes antioxidants, antimicrobial, and others.
The market is divided into meat & poultry products, bakery products, dairy products, beverages, snacks, and others.
The industry is segmented into North America, Latin America, Europe, Asia-Pacific, and the Middle East & Africa.
The market is projected to grow at a CAGR of 6.8% during the forecast period from 2025 to 2035.
By 2035, the market is anticipated to reach approximately USD 6.5 billion, driven by increasing demand for clean-label and natural preservatives.
The clean-label preservatives segment is expected to witness the fastest growth.
Key drivers include increasing demand for processed and convenience foods, regulatory restrictions on synthetic preservatives, rising health-consciousness, and advancements in natural preservation techniques.
The market is led by Cargill, Incorporated, Kerry Group Plc, BASF SE, IFF Nutrition & Biosciences, and Lallemand Inc.


Our Research Products

The "Full Research Suite" delivers actionable market intel, deep dives on markets or technologies, so clients act faster, cut risk, and unlock growth.

The Leaderboard benchmarks and ranks top vendors, classifying them as Established Leaders, Leading Challengers, or Disruptors & Challengers.

Locates where complements amplify value and substitutes erode it, forecasting net impact by horizon

We deliver granular, decision-grade intel: market sizing, 5-year forecasts, pricing, adoption, usage, revenue, and operational KPIs—plus competitor tracking, regulation, and value chains—across 60 countries broadly.

Spot the shifts before they hit your P&L. We track inflection points, adoption curves, pricing moves, and ecosystem plays to show where demand is heading, why it is changing, and what to do next across high-growth markets and disruptive tech

Real-time reads of user behavior. We track shifting priorities, perceptions of today’s and next-gen services, and provider experience, then pace how fast tech moves from trial to adoption, blending buyer, consumer, and channel inputs with social signals (#WhySwitch, #UX).

Partner with our analyst team to build a custom report designed around your business priorities. From analysing market trends to assessing competitors or crafting bespoke datasets, we tailor insights to your needs.
Supplier Intelligence
Discovery & Profiling
Capacity & Footprint
Performance & Risk
Compliance & Governance
Commercial Readiness
Who Supplies Whom
Scorecards & Shortlists
Playbooks & Docs
Category Intelligence
Definition & Scope
Demand & Use Cases
Cost Drivers
Market Structure
Supply Chain Map
Trade & Policy
Operating Norms
Deliverables
Buyer Intelligence
Account Basics
Spend & Scope
Procurement Model
Vendor Requirements
Terms & Policies
Entry Strategy
Pain Points & Triggers
Outputs
Pricing Analysis
Benchmarks
Trends
Should-Cost
Indexation
Landed Cost
Commercial Terms
Deliverables
Brand Analysis
Positioning & Value Prop
Share & Presence
Customer Evidence
Go-to-Market
Digital & Reputation
Compliance & Trust
KPIs & Gaps
Outputs
Full Research Suite comprises of:
Market outlook & trends analysis
Interviews & case studies
Strategic recommendations
Vendor profiles & capabilities analysis
5-year forecasts
8 regions and 60+ country-level data splits
Market segment data splits
12 months of continuous data updates
DELIVERED AS:
PDF EXCEL ONLINE
Natural Food Preservatives Market Size and Share Forecast Outlook 2025 to 2035
Natural Food and Beverage Preservatives Market Size and Share Forecast Outlook 2025 to 2035
Food & Beverage OEE Software Market Size and Share Forecast Outlook 2025 to 2035
Food Grade Crosslinked Polyvinylpolypyrrolidone (PVPP) Market Size and Share Forecast Outlook 2025 to 2035
Food Grade Cassia Gum Powder Market Size and Share Forecast Outlook 2025 to 2035
Food Grade Dry Film Lubricant Market Size and Share Forecast Outlook 2025 to 2035
Foodservice Equipment Market Analysis - Size, Share, and Forecast Outlook 2025 to 2035
Food Basket Market Forecast and Outlook 2025 to 2035
Food Grade Tremella Polysaccharide Market Size and Share Forecast Outlook 2025 to 2035
Food Sorting Machine Market Size and Share Forecast Outlook 2025 to 2035
Foodservice Paper Bag Market Size and Share Forecast Outlook 2025 to 2035
Food Stabilizers Market Size and Share Forecast Outlook 2025 to 2035
Food Packaging Film Market Size and Share Forecast Outlook 2025 to 2035
Food Certification Market Size and Share Forecast Outlook 2025 to 2035
Food Tray Market Size and Share Forecast Outlook 2025 to 2035
Food & Beverage Industrial Disinfection and Cleaning Market Size and Share Forecast Outlook 2025 to 2035
Food Technology Market Size and Share Forecast Outlook 2025 to 2035
Food Tourism Sector Market Size and Share Forecast Outlook 2025 to 2035
Food Processing Boiler Market Size and Share Forecast Outlook 2025 to 2035
Food Packaging Machines Market Size and Share Forecast Outlook 2025 to 2035

Thank you!
You will receive an email from our Business Development Manager. Please be sure to check your SPAM/JUNK folder too.
Chat With
MaRIA