

- Market Size (2026)
- USD 430.0 Mn
- Forecast (2036)
- USD 878.0 Mn
- CAGR (2026 to 2036)
- 7.4%
How big is the Nutrient Retention Additives Market in 2026?
USD 430.0 million in 2026 and USD 878.0 million by 2036 at a 7.4% CAGR.
Demand in the Nutrient Retention Additives Market is tied to the economics of animal production. Producers consider these additives when they can connect use to better retention of feed value through mixing, pelleting, storage, and farm delivery.
The source base keeps the market discussion grounded in livestock and feed-input pressure. FAOSTAT and FAO Livestock Systems frame the production base, while USDA ERS Feed Grains Database helps explain why feed-cost movement affects additive evaluation.
The operating issue for buyers is validation. A product may appear useful in controlled tests, but procurement teams need evidence for processing stability, nutrient availability, and premix compatibility before it becomes part of routine formulation. This keeps supplier selection focused on proof, service quality, and formulation support.
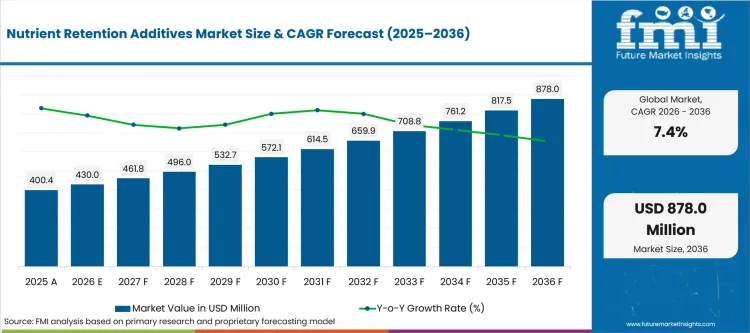
Key Takeaways for the Nutrient Retention Additives Market
- Demand for nutrient retention additives is led by feed-quality preservation and production efficiency, with manufacturers favoring products delivering measurable animal-performance outcomes.
- Dry formulations are anticipated to garner 38.2% share of form in 2026, helped by easier storage and transportation.
- Synthetic sources are expected to lead source with 27.6% share in 2026, backed by demand for consistent concentration and predictable availability.
- Budget constraints and distributor support represent primary barriers limiting scaled adoption.
- Competition centers on dsm-firmenich, BASF, Evonik Industries, Cargill, ADM, and Kemin Industries, with suppliers differentiating based on formulation evidence and technical assistance.
Analyst Perspective
“Commercial adoption depends on measurable nutrient preservation and processing stability under practical feed-manufacturing conditions. Nutrition teams favor suppliers pairing commercial trial evidence with formulation guidance and local technical assistance. Every additive needs to improve nutrient availability without weakening production efficiency or cost competitiveness.”
- Nandini Roy Choudhury, Principal Analyst at Future Market Insights.
How is the Nutrient Retention Additives Market segmented?
The Nutrient Retention Additives Market industry is segmented by Form, Source, Livestock, Function, and Region.
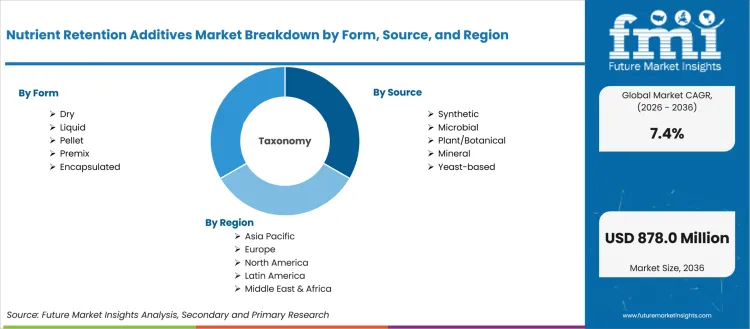
By form, the market covers Dry, Liquid, Pellet, Premix, and Encapsulated. By source, the market covers Synthetic, Microbial, Plant/Botanical, Mineral, and Yeast-based. By livestock, the market covers Poultry, Swine, Ruminants, Aquaculture, and Equine and pets. By function, the market covers Gut health, Growth performance, Immunity, Nutrient use, and Stress management. By region, the market covers North America, Europe, East Asia, South Asia, and Latin America.
Why does Dry carry weight within Form?
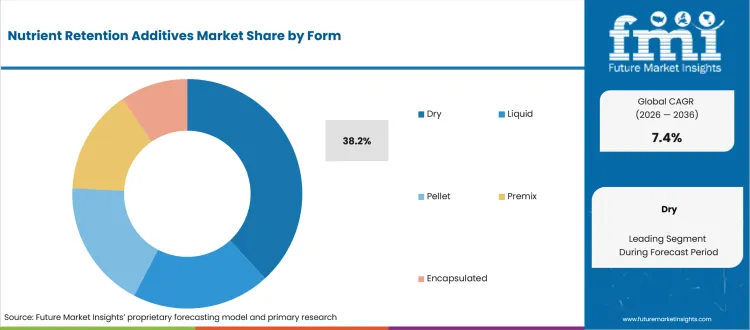
Dry demand within Form is shaped by how easily the additive can be handled in commercial feeding programs. Dry formats fit feed-mill practice because storage, dosing, premix blending, and transport are easier to manage across commercial batches.
- Dry accounts for 38.2% share within Form in 2026. The segment is valued at USD 152.9 million in 2025, USD 164.3 million in 2026, and USD 335.4 million by 2036. FAOSTAT provides the livestock and agricultural production baseline used to read demand.
- For procurement teams, the issue is handling reliability. Dry or blended formats need to move through storage, dosing, and feed-mill routines without creating extra mixing or inventory problems.
What keeps Poultry relevant in the Livestock category?
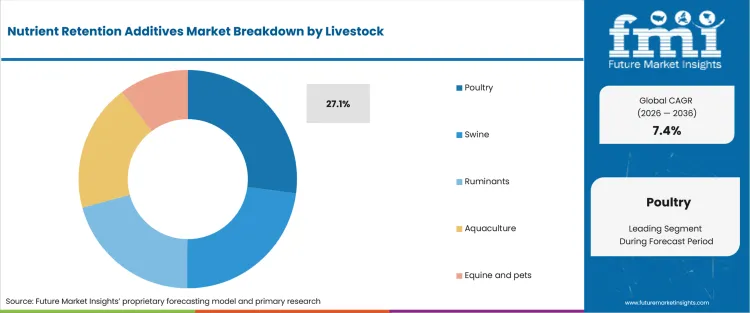
Poultry demand within Livestock is shaped by how easily the additive can be handled in commercial feeding programs. Poultry is closely watched because integrators track feed conversion, flock uniformity, gut challenge, and production-cycle economics at high frequency.
- Poultry accounts for 27.1% share within Livestock in 2026. The segment is valued at USD 108.5 million in 2025, USD 116.5 million in 2026, and USD 237.9 million by 2036. FAO Livestock Systems gives livestock-distribution and animal-production context for adoption.
- For nutrition teams, the issue is species-level proof. Poultry, swine, ruminant, or aquafeed programs need evidence that the additive response holds under normal diet and production pressure.
How do buyers evaluate Synthetic within Source?
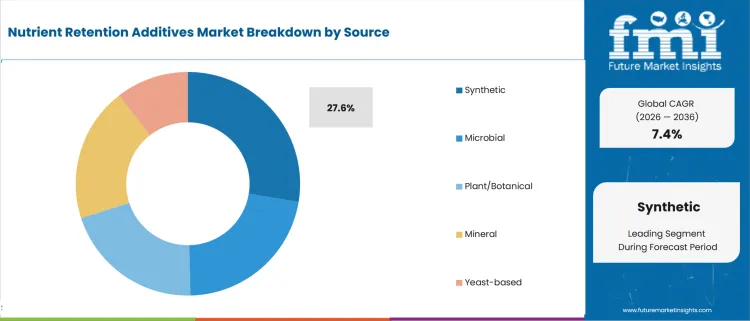
Synthetic demand within Source is shaped by how easily the additive can be handled in commercial feeding programs. Synthetic sources remain relevant where buyers need repeatable concentration, predictable availability, and tighter specification control.
- Synthetic accounts for 27.6% share within Source in 2026. The segment is valued at USD 110.5 million in 2025, USD 118.7 million in 2026, and USD 242.3 million by 2036. USDA ERS Feed Grains Database supports the feed-grain supply, use, and price context behind buyer economics.
- For buyers, the issue is supply and specification stability. Source choice affects concentration, batch consistency, pricing, and the ease of defending the additive in formulation review.
Where does Gut health fit within Function demand?
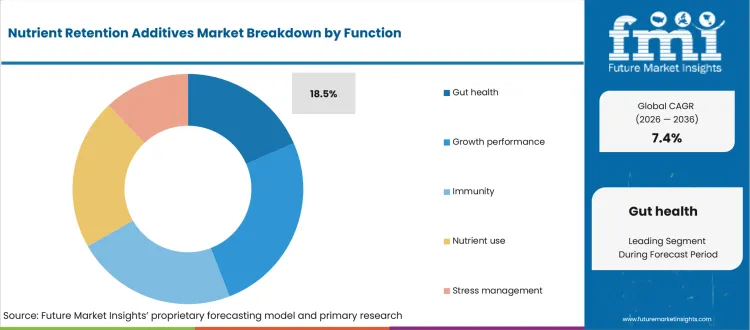
Gut health demand within Function is shaped by how easily the additive can be handled in commercial feeding programs. Gut-health use is tied to feed response, diet-change tolerance, and the need to keep animal performance stable under commercial conditions.
- Gut health accounts for 18.5% share within Function in 2026. The segment is valued at USD 74.1 million in 2025, USD 79.5 million in 2026, and USD 162.4 million by 2036. dsm-firmenich Animal Nutrition & Health provides the source context used for this demand view.
- For formulation teams, the issue is whether the claimed function can be measured. Products need trial evidence and usage guidance before they become part of repeat feed programs.
What explains the North America position within Region?
North America demand within Region is shaped by how easily the additive can be handled in commercial feeding programs. North America reflects integrated production systems, formal nutrition programs, and established technical-service expectations from suppliers.
- North America accounts for 22% share within Region in 2026. The segment is valued at USD 88.1 million in 2025, USD 94.6 million in 2026, and USD 193.2 million by 2036. Cargill feed additives provides the source context used for this demand view.
- For suppliers, the issue is service coverage. Regional demand becomes easier to capture when technical support, distributor reach, and local trial evidence are already in place.
What are the drivers, restraints, and opportunities in the Nutrient Retention Additives Market?
Near-term purchases are being shaped by the operating requirement, implementation constraint, and expansion route outlined below.
- The main driver is that feed efficiency, animal performance, protein demand, and input-cost discipline support demand. Buyers need a practical reason to approve spend, so demand improves where evidence can be linked to processing stability, nutrient availability, and premix compatibility.
- The main restraint is that budget pressure, uncertain farm economics, validation cost, and uneven technical support restrain adoption. Adoption slows when buyer teams cannot see the payback, safety boundary, service owner, or documentation path clearly enough for approval.
- The opportunity lies in precision nutrition, antibiotic-reduction programs, and species-specific additive support. Suppliers can use this route only when they bring practical evidence, local support, and a realistic implementation plan.
Demand is more defensible when the additive addresses a defined feed-program problem. FAOSTAT anchors the livestock and agricultural context, so adoption should be tied to farm economics and measurable response.
The profiled country rows reconcile to USD 430.0 million in 2026 and USD 878.0 million by 2036 at a 7.4% CAGR. This matters because a strong forecast still depends on whether producers can justify additive spend against feed cost and field performance.
Implementation friction comes from trial cost, formulation changes, processing stability, and responsibility for technical service after purchase. Suppliers with clear usage guidance and reliable local support are better positioned than suppliers that offer only product availability.
Which country CAGRs are profiled in the Nutrient Retention Additives Market?
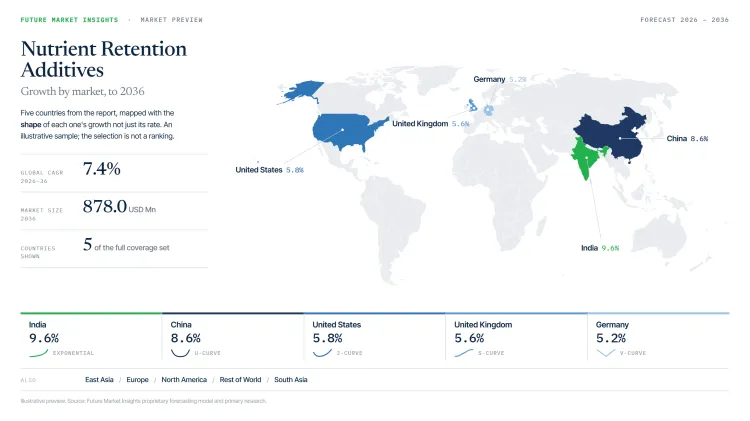
| Country | CAGR |
|---|---|
| United States | 5.84% |
| China | 8.64% |
| India | 9.64% |
| Germany | 5.24% |
| United Kingdom | 5.64% |
| Japan | 5.24% |
| South Korea | 6.84% |
| Rest of World | 8.04% |
How do country-level CAGRs compare in the Nutrient Retention Additives Market?
Country growth in the Nutrient Retention Additives Market should be read through livestock structure, feed-cost pressure, species mix, and the depth of local technical service. The same CAGR can reflect different adoption barriers, so executives should compare how each country validates product response under commercial diets.
- United States records USD 86.00 million in 2026, USD 151.7 million by 2036, and 5.84% CAGR. Integrator economics, feed-cost discipline, and formal nutrition programs make buyers strict about measurable farm response. Procurement teams therefore ask for trial data, dosage economics, and support that fits integrator decision cycles.
- China records USD 77.40 million in 2026, USD 177.2 million by 2036, and 8.64% CAGR. Large feed compounders and high-throughput production create demand for additives that can survive processing and deliver repeatable results. Suppliers need processing-stability evidence and technical support that can scale across large feed operations.
- India records USD 43.00 million in 2026, USD 107.9 million by 2036, and 9.64% CAGR. Poultry, dairy, and mixed livestock systems create demand, but price sensitivity and field support decide how quickly products move into routine use. Field support, affordability, and simple inclusion guidance will decide how quickly products move beyond trials.
- Germany records USD 34.40 million in 2026, USD 57.35 million by 2036, and 5.24% CAGR. Feed buyers weigh documentation, additive performance, and regulatory discipline before switching formulation programs. Supplier review is likely to focus on documentation, regulatory fit, and repeatable feed response.
- United Kingdom records USD 21.50 million in 2026, USD 37.23 million by 2036, and 5.64% CAGR. Demand is tied to farm economics, retail pressure around animal production practices, and the need for supplier-backed technical guidance. Buyers need technical guidance that connects additive use with farm economics and retail-chain expectations.
- Japan records USD 25.80 million in 2026, USD 43.01 million by 2036, and 5.24% CAGR. Compact and quality-conscious production systems require consistent feed response and dependable supplier documentation. Supplier confidence depends on stable quality, detailed usage guidance, and reliable distributor support.
- South Korea records USD 17.20 million in 2026, USD 33.34 million by 2036, and 6.84% CAGR. Dense livestock systems and feed-cost sensitivity make buyers look for quick evidence of response under local diet conditions. Buyers will look for local diet evidence and quick technical response when performance gaps appear.
- Rest of World records USD 124.7 million in 2026, USD 270.2 million by 2036, and 8.04% CAGR. Distributor-led adoption and mixed livestock systems make local technical service as important as product availability. Local service and distributor reach remain critical because livestock systems and feed practices vary widely.
Who are the notable companies in the Nutrient Retention Additives Market?
dsm-firmenich, BASF, Evonik Industries, Cargill, ADM, Kemin Industries, Novus International, Adisseo, IFF / Danisco Animal Nutrition & Health, and Alltech are the notable companies shaping this market.
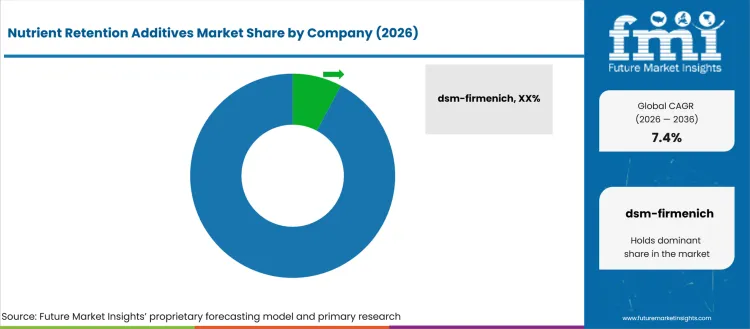
Competition is shaped by how well suppliers protect nutrient value through premix production, pelleting, storage, transport, and species-specific formulation. Buyers compare suppliers on vitamin, enzyme, amino acid, antioxidant, mineral, and premix capability rather than on a single additive claim.
- dsm-firmenich, BASF, Evonik Industries, Adisseo, and IFF / Danisco Animal Nutrition & Health are relevant where nutrient retention depends on vitamins, enzymes, amino acids, and digestibility programs. Their buyer value comes from technical documentation, matrix values, processing stability, and formulation guidance.
- Cargill, ADM, and Novus International matter where nutrient retention is built into wider premix, ration, and protein-production programs. These suppliers are often assessed on service coverage, supply reliability, and ability to help nutrition teams defend reformulation decisions.
- Kemin Industries and Alltech support the market where preservation, oxidative control, mineral nutrition, yeast products, or specialty additives affect retained value in feed. Their role is practical because nutrient loss often shows up after processing or storage, not at the time of purchase.
Competitive Benchmarking: Nutrient Retention Additives Market
| Company | Nutrient Stability Portfolio Fit | Formulation Support | Premix or Feed-Mill Reach | Geographic Footprint |
|---|---|---|---|---|
| dsm-firmenich | High | High | High | Global |
| BASF | High | High | Strong | Global |
| Evonik Industries | High | High | High | Global |
| Cargill | Strong | Strong | High | Global |
| ADM | Strong | Strong | High | Global |
| Kemin Industries | Strong | Strong | Strong | Global |
| Novus International | Strong | Strong | Strong | Global |
| Adisseo | Strong | Strong | Strong | Global |
| IFF / Danisco Animal Nutrition & Health | Strong | Strong | Strong | Global |
| Alltech | Medium | Strong | Strong | Global |
Source: Future Market Insights competitive analysis, 2026. Ratings reflect relative portfolio relevance, workflow or project fit, service capability, and geographic reach.
Key Players in the Nutrient Retention Additives Market
Vitamin, Enzyme, and Amino Acid Platform Suppliers
- dsm-firmenich
- BASF
- Evonik Industries
- Adisseo
- IFF / Danisco Animal Nutrition & Health
Premix and Integrated Nutrition Suppliers
- Cargill
- ADM
- Novus International
Specialty Stability and Mineral Nutrition Suppliers
- Kemin Industries
- Alltech
Nutrient Retention Additives Market - Report Scope
| Coverage field | Report scope |
|---|---|
| Market breakdown | Nutrient Retention Additives Market Breakdown Form, Source, Livestock, Function, Region |
| Market Definition | Commercial demand covered under Nutrient Retention Additives Market, including country demand, segment demand, and supplier-selection context |
| Regions Covered | East Asia, Europe, North America, Rest of World, South Asia |
| Countries Covered | United States, China, India, Germany, United Kingdom, Japan, South Korea, Rest of World |
| Key Companies Profiled | dsm-firmenich, BASF, Evonik Industries, Cargill, ADM, Kemin Industries, Novus International, Adisseo, IFF / Danisco Animal Nutrition & Health, and Alltech |
| Forecast Period | 2026 to 2036 |
| Approach | Global, country, and segment assessment using public source evidence and market context |
Nutrient Retention Additives Market - Research Methodology
| Method | Approach |
|---|---|
| Primary Research | The assessment covers buyer needs, supplier roles, country demand, and segment-level adoption patterns. |
| Desk Research | FAOSTAT; FAO Livestock Systems; USDA ERS Feed Grains Database. Official company portfolio, product, label, and press-release pages were reviewed where company names were used. |
| Market Sizing and Forecasting | Global, country, and segment values were assessed across demand pools, country adoption, segment share, and forecast-period growth. |
| Data Validation | Country totals, segment shares, and forecast values are presented on one reconciled base. |
Nutrient Retention Additives Market by Segments
Nutrient Retention Additives Market segmented by Form:
- Dry
- Liquid
- Pellet
- Premix
- Encapsulated
Nutrient Retention Additives Market segmented by Source:
- Synthetic
- Microbial
- Plant/Botanical
- Mineral
- Yeast-based
Nutrient Retention Additives Market segmented by Livestock:
- Poultry
- Swine
- Ruminants
- Aquaculture
- Equine and pets
Nutrient Retention Additives Market segmented by Function:
- Gut health
- Growth performance
- Immunity
- Nutrient use
- Stress management
Nutrient Retention Additives Market segmented by Region:
- North America
- Europe
- East Asia
- South Asia
- Latin America
Research Sources and Bibliography
- 1. FAOSTAT. Livestock, crop, food-balance, and agricultural production baseline.
- 2. FAO Livestock Systems. Livestock distribution and animal-production demand context.
- 3. USDA ERS Feed Grains Database. Feed grain supply, use, and price context for feed inputs.
- 4. dsm-firmenich Animal Nutrition & Health.
- 5. Cargill feed additives.
- 6. Evonik Animal Nutrition & Health.
- 7. ADM Animal Nutrition.
- 8. Adisseo animal nutrition.
- 9. IFF Danisco Animal Nutrition & Health.
- 10. Kemin Animal Nutrition & Health.
- 11. Alltech Mycosorb.
- 12. Novus International
- 13. BASF Natuphos E phytase.
- 14. Novonesis feed enzyme alliance announcement.
This Report Answers
- What is the expected global value of the Nutrient Retention Additives Market in 2026 and 2036?
- What CAGR is forecast for the Nutrient Retention Additives Market during the 2026 to 2036 period?
- Which country value and CAGR rows are included for Nutrient Retention Additives Market?
- Which segment groups and subsegments carry the higher 2026 shares?
- How do country values reconcile with the global 2026 and 2036 totals?
- Which public sources support the market, country, and segment context?
- Which named companies shape competition in the Nutrient Retention Additives Market?
- What adoption risk, procurement risk, or supplier-selection issue should executives watch?
- How does FMI size and forecast Nutrient Retention Additives Market across countries and segments?
- Which supplier or development signals affect executive decisions?
Frequently Asked Questions
Why should executives track the Nutrient Retention Additives Market?
Executives should track this market because additive use affects feed cost, animal performance, supplier dependence, and formulation risk. The value case is easier to defend when procurement can connect product use to field response and avoid broad nutrition claims.
What business problem does the Nutrient Retention Additives Market address?
The market addresses the need to improve better retention of feed value through mixing, pelleting, storage, and farm delivery while keeping additive spend under control. Buyers need proof that the product works in commercial diets, as well as in controlled demonstrations.
What should procurement leaders evaluate before selecting suppliers?
Procurement leaders should compare formulation fit, dosage economics, processing stability, species-specific evidence, distributor service, and documentation quality. Supplier selection should also check who supports trial work after the first purchase.
What can limit return on investment for buyers?
Return on investment can be limited by weak field evidence, high validation cost, inconsistent raw materials, and poor local technical support. Buyers can reduce this risk by using phased trials and measuring outcomes against feed-cost and performance targets.
How can suppliers build executive confidence?
Suppliers build confidence through field data, clear inclusion guidance, stable supply, and practical nutrition support. The buyer needs to see how the product performs in routine feeding programs before it becomes part of repeat procurement.
Preview the report firsthand - request a free sample
Get SampleGet the brochure for pricing and purchase details.
Get PDFTable of Content
- Key Takeaways
- Market Size and CAGR
- Top Growth Driver
- Fastest Growing Segment
- Leading Region
- Key Companies
- Emerging Opportunities
- Executive Summary
- Global Market Outlook
- Demand-side Trends
- Supply-side Trends
- Technology Roadmap Analysis
- Analysis and Recommendations
- Analyst Perspective (What is happening? Why now? What should investors know?)
- Key Questions Answered
- How large is the market?
- What is the CAGR?
- What are key trends?
- Which region dominates?
- Who are the leaders?
- Market Overview
- Market Coverage / Taxonomy
- Market Definition / Scope / Limitations
- Research Methodology
- Chapter Orientation
- Analytical Lens and Working Hypotheses
- Market Structure, Signals, and Trend Drivers
- Benchmarking and Cross-market Comparability
- Market Sizing, Forecasting, and Opportunity Mapping
- Research Design and Evidence Framework
- Desk Research Programme (Secondary Evidence)
- Expert Input and Fieldwork (Primary Evidence)
- Tooling, Models, and Reference Databases
- Data Engineering and Model Build
- Quality Assurance and Audit Trail
- Market Background
- Market Dynamics (Drivers, Restraints, Opportunity, Trends)
- Scenario Forecast (Optimistic, Likely, Conservative)
- Impact Analysis
- AI Impact
- Sustainability Impact
- Regulatory Impact
- Technology Impact
- Consumer / Buyer Analysis
- Purchase Drivers
- Adoption Barriers
- Buyer Journey
- Opportunity Map Analysis
- Product Life Cycle Analysis
- Supply Chain Analysis
- Investment Feasibility Matrix
- Value Chain Analysis
- PESTLE and Porter's Analysis
- Regulatory Landscape
- Regional Parent Market Outlook
- Production and Consumption Statistics
- Import and Export Statistics
- Global Market Analysis and Forecast, 2021 to 2036
- Historical Market Size Value (USD Million) Analysis, 2021 to 2025
- Current and Future Market Size Value (USD Million) Projections, 2026 to 2036
- Y-o-Y Growth Trend Analysis
- Absolute $ Opportunity Analysis
- Global Market Pricing Analysis, 2021 to 2036
- Global Market Analysis and Forecast, By Form, 2021 to 2036
- Introduction / Key Findings
- Historical Market Size Value (USD Million) Analysis By Form, 2021 to 2025
- Current and Future Market Size Value (USD Million) Analysis and Forecast By Form, 2026 to 2036
- Dry
- Liquid
- Pellet
- Premix
- Encapsulated
- Dry
- Y-o-Y Growth Trend Analysis By Form, 2021 to 2025
- Absolute $ Opportunity Analysis By Form, 2026 to 2036
- Global Market Analysis and Forecast, By Source, 2021 to 2036
- Introduction / Key Findings
- Historical Market Size Value (USD Million) Analysis By Source, 2021 to 2025
- Current and Future Market Size Value (USD Million) Analysis and Forecast By Source, 2026 to 2036
- Synthetic
- Microbial
- Plant/Botanical
- Mineral
- Yeast-based
- Synthetic
- Y-o-Y Growth Trend Analysis By Source, 2021 to 2025
- Absolute $ Opportunity Analysis By Source, 2026 to 2036
- Global Market Analysis and Forecast, By Livestock, 2021 to 2036
- Introduction / Key Findings
- Historical Market Size Value (USD Million) Analysis By Livestock, 2021 to 2025
- Current and Future Market Size Value (USD Million) Analysis and Forecast By Livestock, 2026 to 2036
- Poultry
- Swine
- Ruminants
- Aquaculture
- Equine and pets
- Poultry
- Y-o-Y Growth Trend Analysis By Livestock, 2021 to 2025
- Absolute $ Opportunity Analysis By Livestock, 2026 to 2036
- Global Market Analysis and Forecast, By Function, 2021 to 2036
- Introduction / Key Findings
- Historical Market Size Value (USD Million) Analysis By Function, 2021 to 2025
- Current and Future Market Size Value (USD Million) Analysis and Forecast By Function, 2026 to 2036
- Gut health
- Growth performance
- Immunity
- Nutrient use
- Stress management
- Gut health
- Y-o-Y Growth Trend Analysis By Function, 2021 to 2025
- Absolute $ Opportunity Analysis By Function, 2026 to 2036
- Global Market Analysis and Forecast, By Region, 2021 to 2036
- Introduction
- Historical Market Size Value (USD Million) Analysis By Region, 2021 to 2025
- Current Market Size Value (USD Million) Analysis and Forecast By Region, 2026 to 2036
- North America
- Latin America
- Western Europe
- Eastern Europe
- East Asia
- South Asia and Pacific
- Middle East & Africa
- Market Attractiveness Analysis By Region
- North America Market Analysis and Forecast, By Country, 2021 to 2036
- Historical Market Size Value (USD Million) Trend Analysis By Market Taxonomy, 2021 to 2025
- Market Size Value (USD Million) Forecast By Market Taxonomy, 2026 to 2036
- By Country
- USA
- Canada
- By Form
- By Source
- By Livestock
- By Function
- By Country
- Market Attractiveness Analysis
- By Country
- By Form
- By Source
- By Livestock
- By Function
- Key Takeaways
- Latin America Market Analysis and Forecast, By Country
- Historical Market Size Value (USD Million) Trend Analysis By Market Taxonomy, 2021 to 2025
- Market Size Value (USD Million) Forecast By Market Taxonomy, 2026 to 2036
- By Country
- Brazil
- Mexico
- Chile
- Rest of Latin America
- By Form
- By Source
- By Livestock
- By Function
- By Country
- Market Attractiveness Analysis
- By Country
- By Form
- By Source
- By Livestock
- By Function
- Key Takeaways
- Western Europe Market Analysis and Forecast, By Country
- Historical Market Size Value (USD Million) Trend Analysis By Market Taxonomy, 2021 to 2025
- Market Size Value (USD Million) Forecast By Market Taxonomy, 2026 to 2036
- By Country
- Germany
- UK
- Italy
- Spain
- France
- Nordic
- BENELUX
- Rest of Western Europe
- By Form
- By Source
- By Livestock
- By Function
- By Country
- Market Attractiveness Analysis
- By Country
- By Form
- By Source
- By Livestock
- By Function
- Key Takeaways
- Eastern Europe Market Analysis and Forecast, By Country
- Historical Market Size Value (USD Million) Trend Analysis By Market Taxonomy, 2021 to 2025
- Market Size Value (USD Million) Forecast By Market Taxonomy, 2026 to 2036
- By Country
- Russia
- Poland
- Hungary
- Balkan & Baltic
- Rest of Eastern Europe
- By Form
- By Source
- By Livestock
- By Function
- By Country
- Market Attractiveness Analysis
- By Country
- By Form
- By Source
- By Livestock
- By Function
- Key Takeaways
- East Asia Market Analysis and Forecast, By Country
- Historical Market Size Value (USD Million) Trend Analysis By Market Taxonomy, 2021 to 2025
- Market Size Value (USD Million) Forecast By Market Taxonomy, 2026 to 2036
- By Country
- China
- Japan
- South Korea
- By Form
- By Source
- By Livestock
- By Function
- By Country
- Market Attractiveness Analysis
- By Country
- By Form
- By Source
- By Livestock
- By Function
- Key Takeaways
- South Asia and Pacific Market Analysis and Forecast, By Country
- Historical Market Size Value (USD Million) Trend Analysis By Market Taxonomy, 2021 to 2025
- Market Size Value (USD Million) Forecast By Market Taxonomy, 2026 to 2036
- By Country
- India
- ASEAN
- Australia & New Zealand
- Rest of South Asia and Pacific
- By Form
- By Source
- By Livestock
- By Function
- By Country
- Market Attractiveness Analysis
- By Country
- By Form
- By Source
- By Livestock
- By Function
- Key Takeaways
- Middle East & Africa Market Analysis and Forecast, By Country
- Historical Market Size Value (USD Million) Trend Analysis By Market Taxonomy, 2021 to 2025
- Market Size Value (USD Million) Forecast By Market Taxonomy, 2026 to 2036
- By Country
- Kingdom of Saudi Arabia
- Other GCC Countries
- Türkiye
- South Africa
- Other African Union
- Rest of Middle East & Africa
- By Form
- By Source
- By Livestock
- By Function
- By Country
- Market Attractiveness Analysis
- By Country
- By Form
- By Source
- By Livestock
- By Function
- Key Takeaways
- Key Countries Market Analysis
- USA
- Pricing Analysis
- Market Share Analysis, 2025
- By Form
- By Source
- By Livestock
- By Function
- Canada
- Pricing Analysis
- Market Share Analysis, 2025
- By Form
- By Source
- By Livestock
- By Function
- Mexico
- Pricing Analysis
- Market Share Analysis, 2025
- By Form
- By Source
- By Livestock
- By Function
- Brazil
- Pricing Analysis
- Market Share Analysis, 2025
- By Form
- By Source
- By Livestock
- By Function
- Chile
- Pricing Analysis
- Market Share Analysis, 2025
- By Form
- By Source
- By Livestock
- By Function
- Germany
- Pricing Analysis
- Market Share Analysis, 2025
- By Form
- By Source
- By Livestock
- By Function
- UK
- Pricing Analysis
- Market Share Analysis, 2025
- By Form
- By Source
- By Livestock
- By Function
- Italy
- Pricing Analysis
- Market Share Analysis, 2025
- By Form
- By Source
- By Livestock
- By Function
- Spain
- Pricing Analysis
- Market Share Analysis, 2025
- By Form
- By Source
- By Livestock
- By Function
- France
- Pricing Analysis
- Market Share Analysis, 2025
- By Form
- By Source
- By Livestock
- By Function
- India
- Pricing Analysis
- Market Share Analysis, 2025
- By Form
- By Source
- By Livestock
- By Function
- ASEAN
- Pricing Analysis
- Market Share Analysis, 2025
- By Form
- By Source
- By Livestock
- By Function
- Australia & New Zealand
- Pricing Analysis
- Market Share Analysis, 2025
- By Form
- By Source
- By Livestock
- By Function
- China
- Pricing Analysis
- Market Share Analysis, 2025
- By Form
- By Source
- By Livestock
- By Function
- Japan
- Pricing Analysis
- Market Share Analysis, 2025
- By Form
- By Source
- By Livestock
- By Function
- South Korea
- Pricing Analysis
- Market Share Analysis, 2025
- By Form
- By Source
- By Livestock
- By Function
- Russia
- Pricing Analysis
- Market Share Analysis, 2025
- By Form
- By Source
- By Livestock
- By Function
- Poland
- Pricing Analysis
- Market Share Analysis, 2025
- By Form
- By Source
- By Livestock
- By Function
- Hungary
- Pricing Analysis
- Market Share Analysis, 2025
- By Form
- By Source
- By Livestock
- By Function
- Kingdom of Saudi Arabia
- Pricing Analysis
- Market Share Analysis, 2025
- By Form
- By Source
- By Livestock
- By Function
- Türkiye
- Pricing Analysis
- Market Share Analysis, 2025
- By Form
- By Source
- By Livestock
- By Function
- South Africa
- Pricing Analysis
- Market Share Analysis, 2025
- By Form
- By Source
- By Livestock
- By Function
- USA
- Market Structure Analysis
- Competition Dashboard
- Competition Benchmarking
- Market Share Analysis of Top Players
- By Regional
- By Form
- By Source
- By Livestock
- By Function
- Emerging Startups
- Innovation Benchmarking
- Competition Analysis
- Competition Deep Dive
- dsm-firmenich
- Overview
- Product Portfolio
- Profitability by Market Segments
- Sales Footprint
- Strategy Overview
- Marketing Strategy
- Product Strategy
- Channel Strategy
- BASF
- Evonik Industries
- Cargill
- ADM
- Kemin Industries
- Novus International
- Adisseo
- IFF / Danisco Animal Nutrition & Health
- Alltech
- dsm-firmenich
- Case Studies
- Success Stories
- Recent Developments
- Competition Deep Dive
- Assumptions & Acronyms Used


