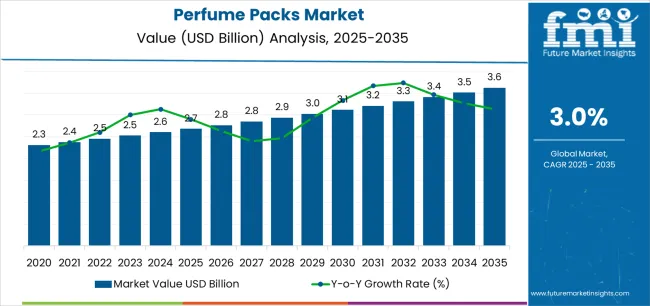
The Perfume Packs Market is estimated to be valued at USD 2.7 billion in 2025 and is projected to reach USD 3.6 billion by 2035, registering a compound annual growth rate (CAGR) of 3.0% over the forecast period.
The Perfume Packs market is experiencing steady growth driven by increasing consumer demand for premium and personalized fragrance experiences. The future outlook for this market is shaped by evolving consumer preferences, rising disposable incomes, and the growing importance of aesthetic appeal in packaging. The market is also influenced by the expansion of global beauty and personal care industries, with an emphasis on innovative, sustainable, and visually appealing packaging solutions.
Investments in design, material innovation, and production technologies are enhancing the functionality and luxury perception of perfume packs. Additionally, the rise of e-commerce and direct-to-consumer channels is increasing the need for secure, durable, and attractive packaging that maintains product integrity during transportation.
As consumers increasingly associate high-quality packaging with brand prestige, perfume manufacturers are focusing on distinctive designs and premium materials to capture attention and foster brand loyalty The market is poised for continued growth as fragrance consumption rises in both mature and emerging regions, supported by creative packaging solutions that combine style, sustainability, and convenience.
| Metric | Value |
|---|---|
| Perfume Packs Market Estimated Value in (2025 E) | USD 2.7 billion |
| Perfume Packs Market Forecast Value in (2035 F) | USD 3.6 billion |
| Forecast CAGR (2025 to 2035) | 3.0% |
The market is segmented by Material, Packaging Format, Capacity, and Application and region. By Material, the market is divided into Metal, Plastic, Paper & Paperboard, and Glass. In terms of Packaging Format, the market is classified into Bottles, Cans, Roll-Ons, Stick Packs, Boxes & Cartons, and Pouches. Based on Capacity, the market is segmented into 11 To 50 Ml, Less Than 10 Ml, 51 To 200 Ml, and Above 200 Ml. By Application, the market is divided into Eau De Parfum (EDP), Eau De Toilette (EDT), and Eau De Cologne. Regionally, the market is classified into North America, Latin America, Western Europe, Eastern Europe, Balkan & Baltic Countries, Russia & Belarus, Central Asia, East Asia, South Asia & Pacific, and the Middle East & Africa.
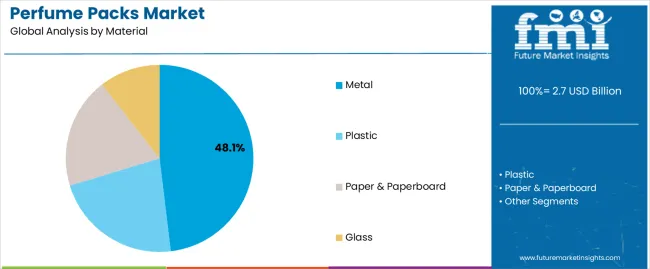
The metal material segment is projected to hold 48.1% of the Perfume Packs market revenue share in 2025, making it the leading material type. The dominance of metal is attributed to its durability, premium feel, and protective qualities, which enhance the perceived value of fragrances.
Metal packaging ensures product stability and prevents damage during shipping, which is critical for high-value perfumes. Additionally, metal allows for innovative designs, engraving, and finishing techniques that appeal to luxury consumers.
The growing consumer preference for sustainable and reusable packaging also supports the adoption of metal, as it can be recycled without compromising quality Manufacturers are increasingly leveraging metal to differentiate their offerings, elevate brand image, and create collectible packaging experiences, further reinforcing the growth of this segment.
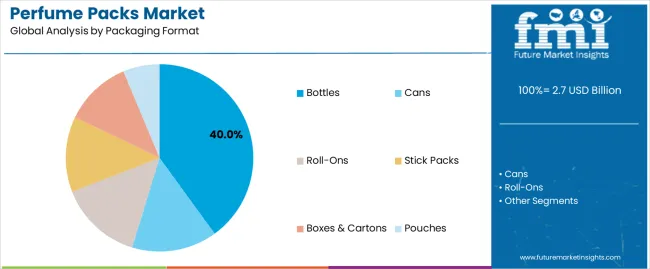
The bottles packaging format segment is expected to capture 40.0% of the Perfume Packs market revenue share in 2025, positioning it as the leading format. Bottles are preferred for their versatility, ease of use, and ability to showcase the fragrance through transparent or colored glass.
The format allows for precise dispensing, ensuring consumer convenience and minimizing product wastage. The visual appeal and premium perception associated with bottle packaging contribute significantly to brand positioning.
Furthermore, bottles can be paired with caps, sprays, or pumps, enabling creative designs that align with consumer expectations As fragrance brands continue to focus on delivering immersive and luxurious experiences, the adoption of bottles as the primary packaging format is expected to remain strong.
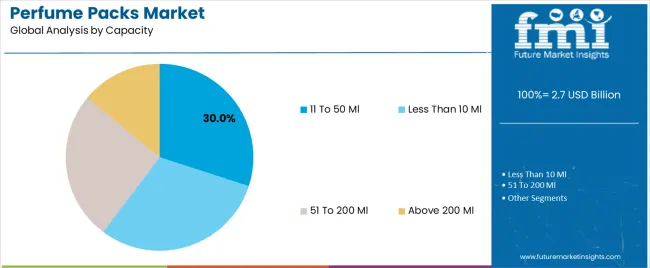
The 11 to 50 Ml capacity segment is anticipated to account for 30.0% of the Perfume Packs market revenue in 2025, making it the leading capacity range. This segment has grown due to consumer demand for portable and travel-friendly perfume options that can be conveniently carried in bags or purses.
The size balances usability and value, providing enough product for repeated use while maintaining affordability. Additionally, this capacity range supports trial purchases and gifting, which are key drivers in fragrance marketing.
Manufacturers favor this size as it allows for premium pricing while catering to convenience-seeking consumers The growth of the 11 to 50 Ml segment is further reinforced by lifestyle trends emphasizing mobility and on-the-go personal care, ensuring its continued dominance in the market.
The below table presents the expected CAGR for the global perfume packs market over several semi-annual periods spanning from 2025 to 2035. In the first half (H1) of the year from 2025 to 2035, the business is predicted to surge at a CAGR of 3.0%, followed by a slightly higher growth rate of 3.3% in the second half (H2) of the same year.
| Particular | Value CAGR |
|---|---|
| H1 | 3.0% (2025 to 2035) |
| H2 | 3.3% (2025 to 2035) |
| H1 | 3.1% (2025 to 2035) |
| H2 | 3.4% (2025 to 2035) |
Moving into the subsequent period, from H1 2025 to H2 2035, the CAGR is projected to increase slightly to 3.1% in the first half and slightly increase to 3.4% in the second half. In the first half (H1) the market witnessed an increase of 10 BPS while in the second half (H2), the market witnessed an increase of 10 BPS.
Growing Demand for Decorative Bottles to Drive Perfume Packs Market
Consumers are continuously seeking aesthetically attractive and uniquely designed packaging that enhances their fragrance purchase. Decorative bottles are often collected as a sense of luxury resonating with both high-end and mass-market consumers.
This trend is fueled by the growing desire for customized and personalized product packaging in order to create memories. To meet this desire of consumer’s manufacturers are offering personalized options as consumers are ready to pay more for scented and stylish bottles that give a premium look and feel.
This shift in consumer behavior resulted in the use of high-quality glass, crystal and precious metals that offer flexibility for customized bottle-shape designs, and engraving of their customers’ personal names or messages. This not only enhances the visibility but also helps in branding the product. This trend boosting sales of decorative perfume bottles is poised to boost sales of the perfume packs market.
Innovation in Sustainability to Drive the Market for Perfume Packs
Consumers are increasingly prioritizing and opting for sustainable packaging solutions for their purchases to reduce their ecological impact. Manufacturers to meet this demand of consumers are adopting sustainable packaging solutions such as recycling, biodegradable, and refillable options to reduce their carbon footprint.
Brands are using materials made from renewable sources like cornstarch or sugarcane and are offering refillable container options to reduce wastage and resource consumption. This shift towards sustainable products meeting consumer demands is also helping producers gain consumer loyalty and enhancing the brand's reputation.
Further integration of smart technologies such as QR codes and tags offers consumers real-time data of product origin and ingredients used for making the products this transparency helps build trust among customers boosting brand value to drive demand for the market.
Stringent Rules & Regulations May Pose Various Challenges
Stringent rules and regulations imposed by governments of various countries by considering the effects on individuals and the environment. These factors may pose challenges for cosmetics manufacturers including the perfumery segment such as increasing compliance complexity and costs for adopting higher standards of safety.
For instance, according to the data published by the Promotional Products Association International (PPAI), in December 2025, the FDA passed the Modernization of Cosmetics Regulation Act (MoCRA) which mandates high safety assessments and labelling requirements for all cosmetic products including perfumes.
This regulation mandates manufacturers to reformulate and redesign their packaging products with the addition of detailed ingredient lists and allergen warnings.
The global perfume packs industry recorded a CAGR of 2.6% during the historical period between 2020 and 2025. The growth of the perfume packs industry was positive as it reached a value of USD 2.7 billion in 2025 from USD 2.3 billion in 2020.
The perfume packs market-experienced growth from 2020 to 2025 with the rise in consumer demand for personalized and custom fragrances and their packaging. Brands to respond to this demand increased their focus on the creation of limited edition and seasonal collections of fragrances and their packaging. To further boost sales of their products brands with their collaboration strategy collaborates with the celebrities to attract diverse consumer segments.
Technological advancement in perfume packaging with the integration of smart solutions such as QR codes, and RFID tags in order to offer consumers real-time information about product ingredients, and the material used for making the product. This transparency with consumers helps producers gain trust and build loyalty.
Further expansion of E-commerce with consumer convenience and easy access to products coupled with increasing demand for customization and personalization of fragrance. The packaging consists of bottles, rollerballs, and solid compacts. Continuous innovation in sustainable materials for packaging to meet growing demand from consumers for sustainable packaging companies explored various materials such as biodegradable, plastics, recyclable glass and others.
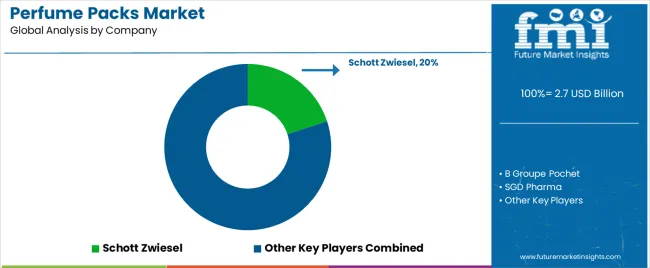
Tier 1 companies comprise market leaders with a market revenue of above USD 50 million capturing significant market share of 10% to 15% in global market. High production capacity and a wide product portfolio characterize these market leaders.
These market leaders are distinguished by their extensive expertise in manufacturing and reconditioning across multiple packaging formats and a broad geographical reach, underpinned by a robust consumer base.
They provide a wide range of series including recycling, and manufacturing utilizing the latest technology meeting regulatory standards providing the highest quality. Prominent companies within tier 1 include Aptar Group, Inc., Albea S.A., SGD Pharma, Gerresheimer AG, Stolzle Glass Group, and Heinz Glass.
Tier 2 companies include mid-size players with revenue of USD 20 to 50 million having presence in specific regions and highly influencing the local market. These are characterized by a strong presence overseas and strong market knowledge.
These market players have good technology and ensure regulatory compliance but may not have advanced technology and wide global reach. Prominent companies in tier 2 include Stolzle Glass Group, Quadpack Industries, Coverpla S.A., Vitro, S.A.B. de C.V., Swallowfield Plc, Libo Cosmetics Company, Ltd., Verescence France SASU, Fusion Packaging, HCP Packaging, SGB Packaging Group, Inc., Premi Spa, and APackaging Group.
Tier 3 includes the majority of small-scale companies operating at the local presence and serving niche markets having revenue below USD 20 million. These companies are notably oriented towards fulfilling local market demands and are consequently classified within the tier 3 share segment.
They are small-scale players and have limited geographical reach. Tier 3, within this context, is recognized as an unorganized market, denoting a sector characterized by a lack of extensive structure and formalization when compared to organized competitors.
The section below covers the industry analysis for the perfume packs market for different countries. Market demand analysis on key countries in several regions of the globe, including North America, Asia Pacific, Europe, and others, is provided. The United States is anticipated to remain at the forefront in North America, with a value share of 1.9% through 2035. In South Asia & Pacific, India is projected to witness a CAGR of 6.5% by 2035.
| Countries | Value CAGR (2025 to 2035) |
|---|---|
| USA | 1.9% |
| Canada | 1.6% |
| Germany | 1.4% |
| Spain | 2.1% |
| UK | 1.5% |
| China | 4.7% |
| India | 6.5% |
The German Cosmetic, Toiletry, Perfumery and Detergent Association (IKW) stated that the sales revenue of beauty and home care products rose to USD 2.7 billion in 2025 for the German market. IKW also stated that an increase of 8.6% reaching to USD 23.3 billion in domestic sales was observed and the export sales revenue grew by 8.1% to USD 13.6 billion.
IKW with the support of other organizations such as Cosmetics Europe and with technological support from Health & Media GmbH launched the COSMILE app in November 2025 with the European cosmetic ingredient database of almost 30,000 ingredients used for making of cosmetics in order to help consumers understand all the ingredients in their cosmetic brands that may or may not have allergic impacts on individual’s skin.
This launch of the COSMILE app is poised to drive the sales of perfume packs by enhancing confidence in consumers through increased transparency affecting the decision-making of the consumers. Further, it also ensures regulatory compliance and safety of the consumers gaining attraction from particular consumers with skin sensitivity. In addition to this manufacturers may leverage the data collected by this app to make informed decisions based on consumer purchases.
Trade Facilitation Office (TFO) Canada an organization published data estimating that the Canadian beauty and personal care market revenue in 2025 amounts to USD 8.29 with a growth rate of 1.8%. This growth is driven by the generational shift with young entrant consumers stepping into the market.
This young generation is attracted by e-commerce platforms that offer broader product selections including perfume packs with competitive prices attracting price-sensitive consumers. E-commerce offers an increase in accessibility and convenience allowing consumers to easily compare products and prices online boosting online sales. International Trade Administration (ITA) estimated that in Canada there were more than 2.7 million e-commerce users in 2025 accounting for more than 75% of the total Canadian population.
ITA also stated that this number is expected to grow to 77.6% by 2025. This growing online population in Canada coupled with advanced digital marketing and personalized recommendations helps e-commerce platforms retain their customers fueling market growth.
The section contains information about the leading segments in the industry. By packaging format, the primary packaging segment is estimated to grow at a CAGR of 2.6% throughout 2035. Additionally, the 52.7 to 200ml capacity perfume packs are projected to gain 2.7/3rd of the total market share by 2025.
| Material | Metal |
|---|---|
| Value Share (2035) | 48.2.7% |
The metal perfume packs dominate the perfume packs predicted for accounting 43.3% overall market share by 2025. The metal’s superior durability and premium aesthetic appeal are highly valued in the luxury fragrance sector boosting sales of premium perfume packs. Metal packaging offers versatile design possibilities that are visually appealing further enhancing the brand's identity.
| Application | Eau de Cologne |
|---|---|
| Value Share (2035) | 46.3% |
The Eau de Cologne fragrances is forecasted to reach a market valuation of USD 2.7 billion by 2025 gaining a 42.7.2% market share by 2025. Eau de Cologne due to its light, refreshing scent profile with low concentration of essential oils makes it ideal particularly for warmer climates and everyday wear. The rise in health and wellness trends boosted sales of Eau de Cologne fragrances for its less overpowering fragrances.
Key players operating in the perfume pack market are investing in the development of innovative sustainable solutions and also entering into partnerships. Key perfume packs providers have also been acquiring smaller players to grow their presence to further penetrate the perfume packs market across multiple regions.
Recent Industry Developments in the Perfume Packs Market
In terms of material, the industry is divided into plastic, paper & paperboard, metal, and glass.
In terms of application, the industry is segregated into primary packaging and secondary packaging. Further primary packaging is categorized as bottles, cans, roll-ons, and stick packs. Secondary packaging is divided into boxes & cartons, and pouches.
By capacity, the market is divided into less than 10 ml, 11 to 50 ml, 51 to 200 ml, and above 200 ml.
The market is classified by applications such as eau de parfum (EDP), eau de toilette (EDT), and eau de cologne.
Key countries of North America, Latin America, East Asia, South Asia & Pacific, Western Europe, Eastern Europe, and the Middle East & Africa have been covered in the report.
The global perfume packs market is estimated to be valued at USD 2.7 billion in 2025.
The market size for the perfume packs market is projected to reach USD 3.6 billion by 2035.
The perfume packs market is expected to grow at a 3.0% CAGR between 2025 and 2035.
The key product types in perfume packs market are metal, plastic, paper & paperboard and glass.
In terms of packaging format, bottles segment to command 40.0% share in the perfume packs market in 2025.


Full Research Suite comprises of:
Market outlook & trends analysis
Interviews & case studies
Strategic recommendations
Vendor profiles & capabilities analysis
5-year forecasts
8 regions and 60+ country-level data splits
Market segment data splits
12 months of continuous data updates
DELIVERED AS:
PDF EXCEL ONLINE
Analyzing Perfume Packs Market Share & Industry Leaders
Perfume Ingredients Chemicals Market Size and Share Forecast Outlook 2025 to 2035
Perfume Ingredient Chemicals Market Analysis - Size & Industry Trends 2025 to 2035
Perfume Filling Machine Market Report – Trends, Demand & Industry Forecast 2025-2035
Perfume Market Analysis by Product Type, Nature, End-use, Sales Channel, and Region through 2035
Perfume Bottle Market Growth & Trends Forecast 2024-2034
Market Share Distribution Among Pet Perfume Providers
Pet Perfume Market Trends & Insights 2024 to 2034
Hair Perfume Market Size and Share Forecast Outlook 2025 to 2035
Luxury Perfume Market
Mini Refillable Perfume Bottles Market Size and Share Forecast Outlook 2025 to 2035
Gel Packs Market Size and Share Forecast Outlook 2025 to 2035
Cold Packs Market Analysis - Size, Share, & Forecast Outlook 2025 to 2035
Portion Packs Market Insights – Growth & Demand 2024-2034
Daily Backpacks Market Size and Share Forecast Outlook 2025 to 2035
Hiking Backpacks Market Analysis - Trends, Growth & Forecast 2025 to 2035
PVC Blister Packs Market
Stretch Film Packs Market Insights on Type, Product, Application, Industry, and Region - 2025 to 2035
Portion Control Packs Market
Molded Fiber Wine Packs Market Size and Share Forecast Outlook 2025 to 2035

Thank you!
You will receive an email from our Business Development Manager. Please be sure to check your SPAM/JUNK folder too.
Chat With
MaRIA