The Polyurethane Precursor Market is estimated to be valued at USD 51.9 billion in 2025 and is projected to reach USD 87.1 billion by 2035, registering a compound annual growth rate (CAGR) of 5.3% over the forecast period.
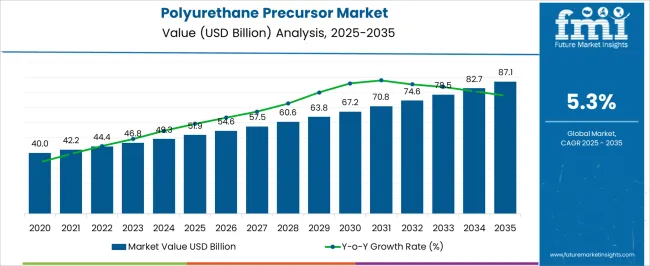
| Metric | Value |
|---|---|
| Polyurethane Precursor Market Estimated Value in (2025 E) | USD 51.9 billion |
| Polyurethane Precursor Market Forecast Value in (2035 F) | USD 87.1 billion |
| Forecast CAGR (2025 to 2035) | 5.3% |
The Polyurethane Precursor market is experiencing substantial growth, driven by the increasing demand for versatile polyurethane products across automotive, construction, and industrial sectors. Rising adoption of lightweight and durable materials in automotive applications is contributing to expanded use of polyurethane precursors. Technological advancements in chemical synthesis and formulation have enhanced the efficiency, performance, and functional properties of polyols and isocyanates, enabling the production of high-quality polyurethane derivatives for various applications.
Growing emphasis on sustainability and environmentally friendly materials has encouraged the development of bio-based precursors, further supporting market expansion. Increasing integration of polyurethane products in insulation, furniture, and packaging solutions is also fueling demand for high-performance precursors.
Regulatory initiatives promoting energy efficiency and waste reduction are further accelerating the adoption of polyurethane-based materials As industries continue to seek cost-effective, durable, and lightweight alternatives to traditional materials, the Polyurethane Precursor market is expected to maintain sustained growth, with innovation in chemical composition and application technologies driving future opportunities.
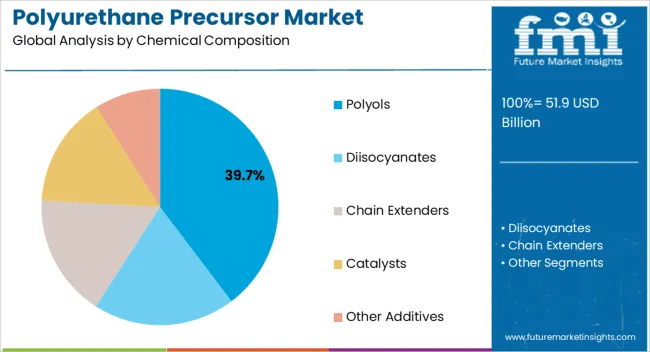
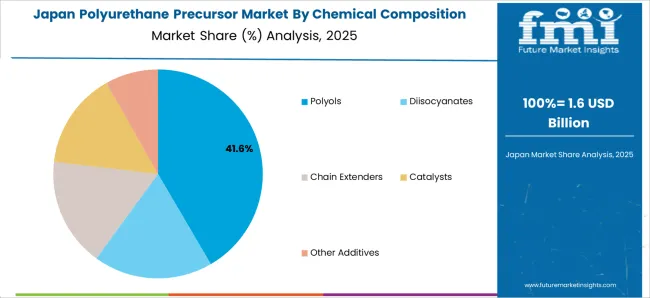
The polyols segment is projected to hold 39.7% of the market revenue in 2025, establishing it as the leading chemical composition. Growth is being driven by the segment’s versatility in producing a wide range of polyurethane products, including foams, elastomers, and coatings. Polyols provide the necessary flexibility, durability, and thermal stability required for high-performance applications, making them the preferred choice among manufacturers.
Advances in chemical synthesis and functionalization have improved product consistency, enabling precise control over physical and mechanical properties. The ability to tailor polyol formulations for specific applications, including high-load automotive components and flexible foam materials, enhances adoption.
Environmental considerations and the development of bio-based polyols are further expanding market potential As polyurethane-based solutions become increasingly integral to industrial and consumer applications, the polyols segment is expected to maintain its market leadership, supported by ongoing innovation and the growing demand for lightweight, durable, and sustainable materials.
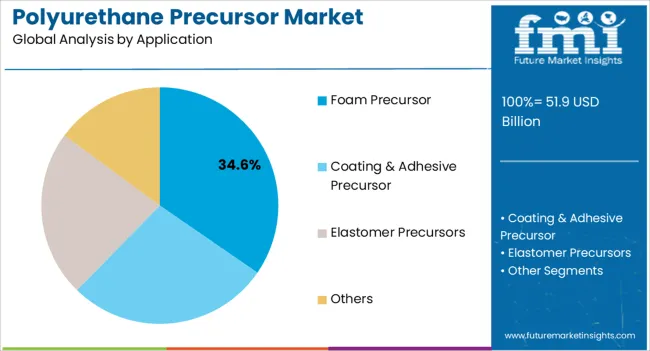
The foam precursor application segment is anticipated to account for 34.6% of the market revenue in 2025, making it the largest application category. Growth in this segment is being driven by the rising demand for flexible and rigid polyurethane foams across automotive seating, insulation, furniture, and packaging sectors. Polyurethane foams provide thermal insulation, lightweight characteristics, and durability, which are critical for enhancing energy efficiency and product longevity.
Technological advancements in foam formulation and production processes have improved performance consistency, enabling applications in diverse industries. Regulatory standards emphasizing energy efficiency, fire resistance, and sustainability are further accelerating adoption.
The ability to customize foam properties such as density, resilience, and cushioning via precursor chemistry enhances their suitability for specialized industrial and commercial applications As demand for high-performance, lightweight, and eco-friendly materials continues to grow, foam precursor applications are expected to remain a key driver of market expansion and revenue growth.
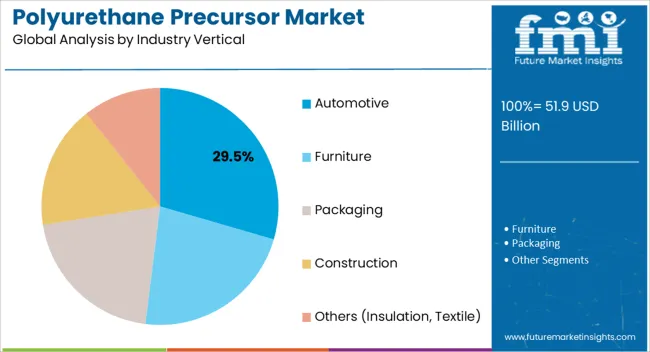
The automotive segment is projected to hold 29.5% of the Polyurethane Precursor market revenue in 2025, establishing it as the leading industry vertical. Growth is being driven by increasing utilization of polyurethane-based materials in seating, interior components, insulation, and lightweight structural elements. The automotive sector is prioritizing energy efficiency, weight reduction, and passenger comfort, all of which are enhanced by polyurethane products derived from high-quality precursors.
Polyurethane precursors enable the production of foams, coatings, and elastomers that meet stringent safety, durability, and performance standards required in modern vehicles. Innovations in chemical composition, including bio-based polyols and high-performance additives, have further strengthened adoption in automotive applications.
As automotive manufacturers continue to adopt lightweight, sustainable, and high-performance materials, the sector is expected to remain a primary driver of the Polyurethane Precursor market The segment’s growth is also supported by expanding production volumes and increasing replacement of conventional materials with polyurethane-based solutions, reinforcing its dominant position in the market.
From 2020 to 2025, the global market experienced a CAGR of 4.7%, reaching a market size of USD 46,518.2 million in 2025.
During the historical period, market witnessed a sluggish growth as automobile industry was completely on halt as a result of pandemic. As the automotive industry is the key consuming industry for polyurethane related products, the market also witnessed less demand.
As the pandemic curve started to flatten in year 2024 to 2025, the market bounced back to the growth path. The market grew at a tremendous growth rate during the recovery phase and surge in demand was witnessed.
Looking ahead, the global industry is anticipated to rise at a CAGR of 5.6% from 2025 to 2035. During the projected time period, the market size is expected to reach USD 80,216.2 million.
During the projected timeframe, the market is anticipated to witness a significant growth owing to the increased demand from the end use industries including construction, packaging, automotive and others. Countries of East Asia and South Asia Pacific, are expected to grow at a tremendous growth rate over the forecast period, owing to the considerable factors such as growing population, expansion of the end use industries, availability of raw materials, workforce, favorable manufacturing conditions and so on.
| Country | The United States |
|---|---|
| Market Size (USD million) by End of Forecast Period (2035) | USD 11,727.6 million |
| CAGR % 2025 to End of Forecast (2035) | 4.8% |
The industry in the United States is expected to reach around USD 11,727.6 million by 2035, expanding at a CAGR of 4.8%. The USA market has experienced substantial growth in recent years.
The expansion of automotive industry is expected to drive the demand for polyurethane precursors and related products in the USA The United States has one of the largest automotive industry. As the industry continues to grow, the demand for polyurethane-base products will witness a significant upswing.
Polyurethane foam, coatings, elastomers all are used in vehicles for their exceptional qualities. Hence, the growth of the automotive industry is a key driving factor for the polyurethane precursor market.
| Country | India |
|---|---|
| Market Size (USD million) by End of Forecast Period (2035) | USD 3,593.7 million |
| CAGR % 2025 to End of Forecast (2035) | 5.9% |
The industry in India is expected to touch USD 3,593.7 million, expanding at a CAGR of 5.9% during the forecast period. The Indian Polyurethane Industry is gaining significant traction from the expansion of the end use industries. India’s booming construction, furniture and automotive industries are boosting the sales of polyurethane products, which is benefitting the precursors market, as they are crucial for the production of polyurethane.
The Indian Packaging Industry is also leveraging the polyurethane foams and other products for cushioning and protective packaging, which is driving the demand. In conclusion, the expansion of the end use industries is transforming the polyurethane industry.
| Country | China |
|---|---|
| Market Size (USD million) by End of Forecast Period (2035) | USD 20,214.5 million |
| CAGR % 2025 to End of Forecast (2035) | 4.3% |
With a projected market value of USD 20,214.5 million and a CAGR of 4.3%, the industry in China is poised for significant growth in the coming years. This growth can be attributed to the remarkable expansion of the packaging industry driven by population growth, urbanization, e-commerce, and evolving consumer preferences.
The growing e-commerce industry, rising need for protective packaging, is driving the demand for rigid and flexible polyurethane foams. This surge in demand is directly impacting the polyurethane precursor market.
Furthermore, the flexibility of packaging foams provide extra advantage for customized packaging. Polyurethane foam are flexible, durable, lightweight and provide excellent protection to the products. Hence, the growing consumption of these foams in packaging industry will ramp up the sales of polyurethane precursors.
| Country | Japan |
|---|---|
| Market Size (USD million) by End of Forecast Period (2035) | USD 3,176.6 million |
| CAGR % 2025 to End of Forecast (2035) | 4.6% |
The industry in Japan is estimated to reach a market share of USD 3,176.6 million by 2035, thriving at a CAGR of 4.6%. Japan is known for its technological advancements, where it leads the global market. The automotive industry in Japan is key industry consuming the polyurethane related products including the foams, coatings, adhesives, elastomers and others.
Also, the construction industry provide an extra advantage to growth of the market. Increasing usage of polyurethane products in construction industry in the form of coatings, insulation materials, sealants and so on. Is expected to drive the market growth.
| Country | Germany |
|---|---|
| Market Size (USD million) by End of Forecast Period (2035) | USD 4,527.4 million |
| CAGR % 2025 to End of Forecast (2035) | 5.1% |
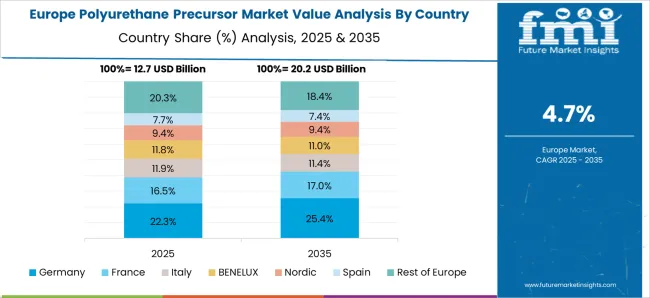
Germany's Polyurethane Precursor industry is projected to achieve a market share of USD 4,527.4 million, with a CAGR of 5.1% throughout the forecast period. Country’s strong focus on research & development, technological advancements, sustainable manufacturing practices all are the factors are transforming the polyurethane precursors market.
Growing use of polyurethane-based materials in textile industry, in bedding, furniture industry and automotive industry, are driving the demand for polyurethane precursors.
The Foam Precursor segment is expected to dominate the industry with a CAGR of 5.8% from 2025 to 2035. Foam precursor is the dominating application for the market and holds approximately more than 60% of the total market share for the year 2025.
Foam precursors are used in the production of polyurethane foams, and these foams are widely used in various end use industries. Generally these foams come under two broad categories, flexible and rigid.
Flexible foams are used in bedding, cushions, upholstery, furniture, automotive seating and others, while rigid foams are used in construction industry for insulation, sealants, roofing and so on.
Polyurethane foams are knowns for their versatility. They are lightweight, durable and thermally insulated. As they offer exception properties, they are heavily used in packaging, automotive, furniture and construction industry.
Automotive industry is one of the force, driving the growth of the market. Automakers are putting emphasis on making vehicle lightweight. In order to achieve the lightweight vehicles, usage of plastics in automotive parts is the key pointer, while focus is also on using lightweight materials in seating, rims, and other components. Polyurethane foams are extensively used in automotive seating, door panels, dashboards, headrests and others.
Apart from the polyurethane foams, polyurethane based coatings, adhesives are also being used in automotive industry. As the consumption of polyurethane based products increases, so does the need of polyurethane precursors.
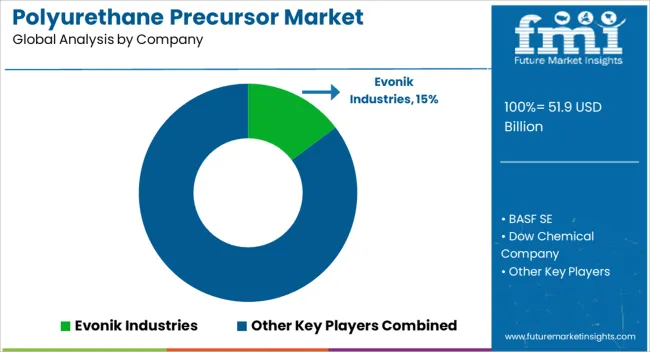
The polyurethane precursor market is highly competitive in nature as market has presence of some of the big key market participants, who are quite active in the market.
Players such as BASF SE, Dow Inc., Covestro AG, Evonik Industries and others are dominating the market. Market players are staying ahead in the competition by adopting certain growth strategies.
Key Strategies Adopted by the Players
Research and Development
Key market participants are intensively focused on research and development activities. A significant amount of revenue is devoted for research and development activity. This help key players to stay ahead in competition as this open up new doors for the launch of new and innovative products.
Collaboration and Mergers
Collaborations and mergers, are another set of growth strategies, where key players are strategically collaborating with other market participants to capture the market share and increase their reach to different set of consumer base. Mergers activities helps in gaining extra edge over other players, as it enhances their global position and also helps in strengthening the product portfolio.
New Product Development and Launch
Key market participants are focusing on the development of the new products which can cater the customization. In this market, market players are launching new products in the market.
Circular Economy and Sustainability
This is one of the crucial factors, where key players are continuously striving to achieve the sustainability goals. Key players are actively involved in achieving the sustainability goals and putting efforts in circular economy.
The recycling and reuse of polyurethane based products and closing the loop is under the limelight and key market participants are focusing on such practices and collaborating with associations.
Production Capacity Expansion and Geographic Reach
To capitalize on new opportunities, key players in the industry prioritize expanding their market presence and geographic reach. They actively seek out untapped regions, establish robust distribution networks, and engage in strategic collaborations with local partners. This strategic approach enables them to enter new markets, access a wider customer base, and harness the growth potential of diverse regions. Key players are also focused on the expansion of their production capacities to cater the growing demand.
Key Players in the Market
The global polyurethane precursor market is estimated to be valued at USD 51.9 billion in 2025.
The market size for the polyurethane precursor market is projected to reach USD 87.1 billion by 2035.
The polyurethane precursor market is expected to grow at a 5.3% CAGR between 2025 and 2035.
The key product types in polyurethane precursor market are polyols, _polyether polyols, _polyester polyols, _polycarbonate polyols, _others, diisocyanates, _toluene diisocyanate (tdi), _methylene diphenyl diisocyanate (mdi), chain extenders, catalysts and other additives.
In terms of application, foam precursor segment to command 34.6% share in the polyurethane precursor market in 2025.


Full Research Suite comprises of:
Market outlook & trends analysis
Interviews & case studies
Strategic recommendations
Vendor profiles & capabilities analysis
5-year forecasts
8 regions and 60+ country-level data splits
Market segment data splits
12 months of continuous data updates
DELIVERED AS:
PDF EXCEL ONLINE
Polyurethane (PU) Adhesives Market Size and Share Forecast Outlook 2025 to 2035
Polyurethane Catalyst Market Size and Share Forecast Outlook 2025 to 2035
Polyurethane Adhesives Market Trends 2025 to 2035
Polyurethane Foam Market Size & Trends 2025 to 2035
Polyurethane Resins Paints & Coatings Market Growth – Trends & Forecast 2025 to 2035
Market Share Breakdown of Leading Polyurethane Dispersions Manufacturers
Polyurethane Coating Market Growth – Trends & Forecast 2024-2034
Polyurethane Composites Market
Spray Polyurethane Foam Market Size and Share Forecast Outlook 2025 to 2035
Waterborne Polyurethane Dispersions Market Size and Share Forecast Outlook 2025 to 2035
Soft Touch Polyurethane Coatings Market Trends 2025 to 2035
NAD Precursor Supplements Market Size and Share Forecast Outlook 2025 to 2035
Thrombus Precursor Protein Market
Trisilylamine (TSA) Precursor Market Size and Share Forecast Outlook 2025 to 2035
High-k and ALD or CVD Metal Precursor Market Size and Share Forecast Outlook 2025 to 2035
High Performance Carbon Fiber Precursor Market Size and Share Forecast Outlook 2025 to 2035
Bio-Polyamide, Specialty Polyamide & Precursors Market Growth – Trends & Forecast 2025 to 2035

Thank you!
You will receive an email from our Business Development Manager. Please be sure to check your SPAM/JUNK folder too.
Chat With
MaRIA