
- Market Size (2026)
- USD 58,986.7 Mn
- Forecast (2036)
- USD 103,659.8 Mn
- CAGR (2026 to 2036)
- 5.8%
How big is Polyurethane Foam Market in 2026?
Between 2026 and 2036, polyurethane foam posts a 5.8% CAGR. Demand of USD 55,753.0 million in 2025 rises to USD 58,986.7 million (estimated) for 2026 and USD 103,659.8 million (projected) by 2036.
Polyurethane foam sales come to USD 58,986.7 million in 2026, up from USD 55,753.0 million in 2025. A recently updated FMI study expects a 5.8% CAGR through 2036, taking the market to USD 103,659.8 million.
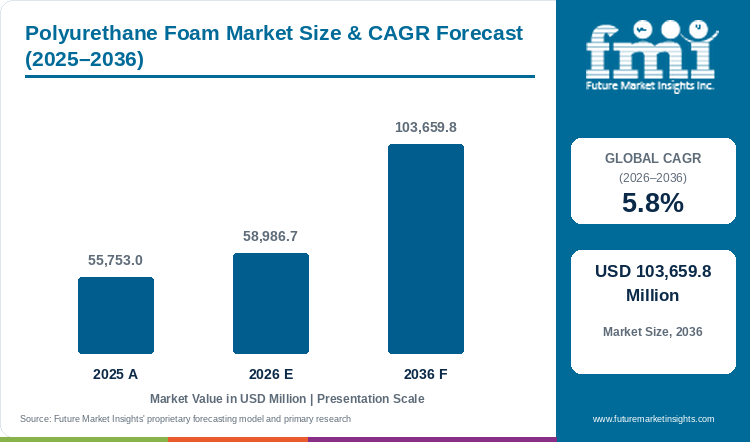
Flexible foam carries 48.6% of 2026 product sales, with furniture and bedding at an estimated 29.4% of end use, and fixed mattress and sofa replacement cycles hold the overall CAGR at 5.8%. Every foam grade starts from polyol, yet the polyols market expands at only a 3.6% CAGR from 2026 to 2036. Foam converters will therefore add value faster than polyol suppliers. Foamable thermoplastic compounds compete with rigid polyurethane board for insulation panel orders, and the foamable resin compounds market posts a 7.3% CAGR over the same years. Heat insulation holds about 31.6% (estimated) of application sales, so rigid board makers will meet the faster rival on each panel tender.
Supply-side forces shaping market growth come from isocyanate plants. In December 2025, Mitsui Chemicals said Kumho Mitsui Chemicals will take the Yeosu MDI plant from 610,000 to 710,000 tons a year on a tentative schedule of February 2026 to May 2027.[1] The 100,000 extra Yeosu tons will soften contract talks for rigid board and spray system makers in East Asia.
However, European converters will face higher landed costs on imported isocyanate. Buyers who split MDI contracts between two regions will absorb fewer price resets.
Key Market Trends & Insights
- Product type: flexible foam carries 48.6% of 2026 sales. Covestro raised TDI capacity at the Shanghai integrated site from 310 to 370 kilotonnes a year, a feedstock used mainly in flexible foam for furniture, mattresses and car seats.[2]
- Density: medium-density grades take 42.3%, high-density grades an estimated 33.4% and low-density grades about 24.3%.
- Application: heat insulation holds an estimated 31.6%, and automotive interior follows at about 21.4%.
- End-use industry: furniture and bedding lead at an estimated 29.4%, and construction comes next at roughly 26.7%.
Regional Highlights
- The United States posts the fastest rate in FMI country data, a 6.0% CAGR from 2026 to 2036.
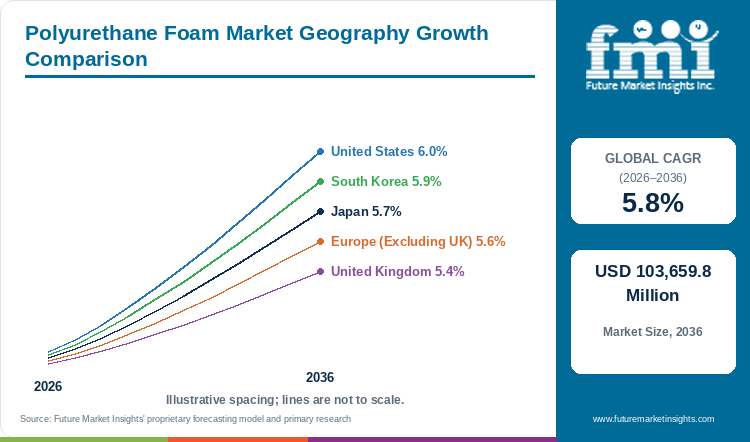
- South Korea follows on a 5.9% CAGR, Japan on 5.7% and Europe excluding the UK at 5.6%, and the United Kingdom is slowest of the five at 5.4%.
- The UK Department for Energy Security and Net Zero launched the Warm Homes Plan on 20 January 2026, with upgrades for up to 5 million homes.[3]
Market Size & Forecast
Table 1: Market Size and Forecast for the Polyurethane Foam Market (USD million and percentage), 2025 to 2036
| Metric | Value |
|---|---|
| 2025 Market Size | USD 55,753.0 million |
| Estimated Market Size in 2026 | USD 58,986.7 million |
| Projected Market Size by 2036 | USD 103,659.8 million |
| CAGR, 2026 to 2036 | 5.8% |
| Added Revenue, 2026 to 2036 | USD 44,673.1 million |
| Market Expansion Multiple | 1.8x |
Polyurethane foam keeps a 5.8% CAGR from 2026 to 2036, held down by mature furniture and bedding volumes. Thermoplastic foams bid for the same insulation and packaging jobs, and the foamable resin compounds market grows 1.5 points faster, on a 7.3% CAGR over the same years. Polyurethane foam will therefore cede part of the new insulation and packaging volume to thermoplastic grades. FMI tracks spray systems in the separate spray polyurethane foam market, and spray grades take an estimated 13.2% of 2026 polyurethane foam sales by product type, with retrofit work on older homes and roofs adding orders. Isocyanate and polyol costs in the polyurethane precursor market will pass straight into converter margins.
Isocyanate and Polyol Capacity Shifts Behind Foam Supply
Feedstock capacity moved toward Asia and the US Gulf Coast between mid-2025 and late 2026. Covestro completed a TDI expansion at the Shanghai site on schedule, taking capacity from 310 to 370 kilotonnes a year, European Rubber Journal reported in February 2026.[2] BASF said in September 2026 that the USD 1 billion Geismar MDI expansion was entering final commissioning.[4] The same release named a land parcel in Dahej, Gujarat, for a possible MDI complex.[4] Dow, by contrast, set shutdowns of the Böhlen cracker and Schkopau chlor-alkali and vinyl assets in Germany for the fourth quarter of 2027.[5] Producer results at Huntsman and Covestro diverged in 2026. Huntsman reported a 4% gain in polyurethanes sales volume for the first quarter of 2026 and a 6% fall in average selling prices.[6] Covestro posted first-half 2026 EBITDA of €669 million on higher selling prices and substantially lower raw material prices, Nasdaq reported.[7] Asian and US tonnage will keep MDI well supplied, and European foamers will pay import freight on more MDI tonnage.
Table 2: Isocyanate and Polyol Supply Indicators for the Polyurethane Foam Market (tonnes, USD, EUR and percentage), mixed reporting years from 2025 to 2026
| Indicator | Data Point | Relevance | Source |
|---|---|---|---|
| Kumho Mitsui Yeosu MDI capacity, planned | 610,000 to 710,000 tons a year | Added MDI for insulation board and automotive foam in East Asia. | [1] |
| Yeosu build schedule, tentative | February 2026 to May 2027 | Timing of new Korean tonnage. | [1] |
| Covestro Shanghai TDI capacity | 310 to 370 kilotonnes a year | More TDI close to flexible foam plants in Asia Pacific. | [2] |
| BASF Geismar MDI expansion, September 2026 | USD 1 billion, final commissioning | New MDI supply for North American foamers. | [4] |
| Dow Böhlen and Schkopau shutdowns | Fourth quarter of 2027 | Upstream capacity leaves Germany. | [5] |
| Huntsman polyurethanes, first quarter 2026 | Volume up 4%, average selling prices down 6% | Softer MDI pricing for foam buyers. | [6] |
| Dow Industrial Intermediates and Infrastructure, second quarter 2026 | Local price up 15%, volume down 2% | Producer pricing firmed as volume slipped. | [8] |
| Covestro EBITDA, first half 2026 | €669 million, up 64.4% | Wider producer margins on lower raw material prices. | [7] |
Analyst Perspective
“New MDI and TDI capacity in Korea, China and the United States gives foam converters a chance to lock in multi-year isocyanate contracts on better terms than European rivals can get. I see the clearest opportunity in insulation board and spray systems for retrofit programs in the UK and the US, and in low-emission flexible foam for bedding makers that want bio-attributed polyols.”
- Nikhil Kaitwade, Principal Consultant, Future Market Insights.
How is the Polyurethane Foam Market segmented?
Product type, density, application and end-use industry divide the polyurethane foam market, with region as a fifth lens. Flexible foam leads product type at 48.6% in 2026, medium density leads density at 42.3%, heat insulation leads application at an estimated 31.6% and furniture and bedding lead end use at an estimated 29.4%.
By product type: rigid foam, flexible foam, and spray foam.
By density: high density, medium density, and low density.
By application: sound insulation, heat insulation, electricity installations, industrial roof insulation, sports equipment, and automotive interior.
By end-use industry: furniture and bedding, construction, electronics, packaging, footwear, automotive, and others.
By region, six blocks: North America and Europe as the mature pair, East Asia with South Asia Pacific, Latin America, and MEA (Middle East and Africa).
Why does flexible foam lead product type sales?
Flexible grades hold 48.6% within product type for 2026, with rigid and spray foam behind.
Table 3: Product Type Share for the Polyurethane Foam Market (percentage share), 2026
| Product Type | Estimated Share (2026) |
|---|---|
| Flexible Foam | 48.6% |
| Rigid Foam | 38.2% |
| Spray Foam | 13.2% |
| Total | 100.0% |
Table 4: Product Type Leadership and Market Growth for the Polyurethane Foam Market (segment and CAGR percentage), 2026 to 2036
| Metric | Value |
|---|---|
| Global CAGR (2026 to 2036) | 5.8% |
| Leading Segment | Flexible Foam |
Flexible foam outsells rigid board on the strength of mattress, sofa and car seat volumes. FMI shows flexible grades at 48.6% of product type sales. Rigid foam follows at an estimated 38.2%, and spray foam takes about 13.2%. Covestro tied the Shanghai TDI expansion to rising customer demand across Asia Pacific.[2] Extra TDI close to Chinese bedding plants will keep slabstock costs in check. Rigid foam, at 38.2%, will narrow the gap to flexible foam as insulation codes tighten in Europe and North America.
- Spray foam will gain in retrofit work on older homes and roofs.
- Covestro also runs TDI plants in Dormagen, Germany, and Baytown, Texas.[2]
Why does medium density lead density sales?
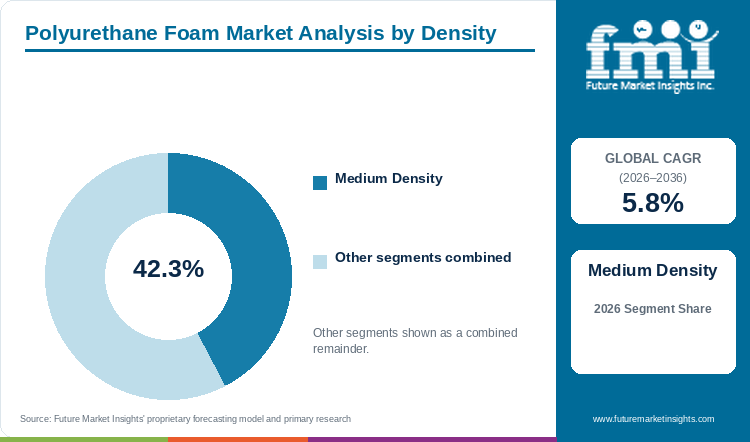
Medium-density foam takes 42.3% of density sales in 2026, and high- and low-density grades share the remainder.
Table 5: Density Share for the Polyurethane Foam Market (percentage share), 2026
| Density | Estimated Share (2026) |
|---|---|
| Medium Density | 42.3% |
| High Density | 33.4% |
| Low Density | 24.3% |
| Total | 100.0% |
A sofa maker choosing a cushion core will weigh comfort, weight and foam cost, and medium density meets all three for most seats. Medium-density grades account for 42.3% of density sales, according to FMI. High-density foam ranks second with an estimated 33.4%, and mattresses and seats with heavier loads will keep that grade in demand. Low-density grades take about 24.3% across packaging and light cushioning. Huntsman reported first-quarter 2026 polyurethanes volume gains mainly in the Americas and Europe.[6] Bedding makers will move part of each range to high density as buyers ask for longer-lasting mattresses.
- Low-density foam will hold a cost role in protective packaging.
- High-density grades will gain in automotive seating and premium bedding.
Why does heat insulation lead application sales?
Heat insulation tops the application split for 2026 at about 31.6% (estimated), and automotive interior ranks second.
Table 6: Application Share for the Polyurethane Foam Market (percentage share), 2026
| Application | Estimated Share (2026) |
|---|---|
| Heat Insulation | 31.6% |
| Automotive Interior | 21.4% |
| Sound Insulation | 16.8% |
| Industrial Roof Insulation | 13.5% |
| Electricity Installations | 9.2% |
| Sports Equipment | 7.5% |
| Total | 100.0% |
Wall, floor and roof insulation feature among the upgrades listed under UK government schemes, DESNZ said in January 2026.[3] UK retrofit money keeps heat insulation the largest application, with an estimated 31.6% of sales. Automotive interior comes second at about 21.4%, and sound insulation adds roughly 16.8%. Industrial roof insulation takes an estimated 13.5%, electricity installations about 9.2% and sports equipment about 7.5%. Heat insulation will widen the lead as building codes raise thermal targets.
- Sound insulation will grow with electric vehicle cabins and quieter appliances.
- Low-income households in the UK could receive support covering the full cost of insulation.[3]
Why do furniture and bedding lead end-use sales?
Furniture and bedding take an estimated 29.4% of end-use sales in 2026, with construction close behind.
Table 7: End-Use Industry Share for the Polyurethane Foam Market (percentage share), 2026
| End-Use Industry | Estimated Share (2026) |
|---|---|
| Furniture and Bedding | 29.4% |
| Construction | 26.7% |
| Automotive | 17.3% |
| Packaging | 9.8% |
| Electronics | 7.1% |
| Footwear | 5.2% |
| Others | 4.5% |
| Total | 100.0% |
About 29.4% (estimated) of polyurethane foam goes into furniture and bedding, a narrow margin over construction at an estimated 26.7%. Mattress and sofa replacement runs on a steady cycle, and building demand swings with housing starts. Japan recorded 740,667 housing starts in 2025, down 6.5% and a 62-year low, Jiji Press reported from land ministry data.[9] Automotive takes an estimated 17.3%, packaging 9.8%, electronics 7.1%, footwear 5.2% and others 4.5%. Seat foam recovery in the recycled polyurethanes from seating foams in EU vehicles segment will add a circular stream to automotive supply. Construction, at 26.7%, will close on furniture and bedding as the Warm Homes Plan and North American retrofits scale.
- Packaging foam will follow e-commerce volumes and electronics shipping.
- Footwear will keep a 5.2% base in midsoles and insoles.
What are the drivers, restraints, and opportunities in the Polyurethane Foam Market?
Demand for polyurethane foam gains from public retrofit funding, insulation codes and new isocyanate capacity in Asia and the United States. Growth of the polyurethane foam market meets headwinds from European feedstock closures, conflict-related supply loss and sharp price resets by producers.
- Driver: Home retrofit funding and tighter thermal rules raise demand for rigid and spray insulation.
- Restraint: Upstream closures in Europe and conflict disruption make isocyanate costs swing.
- Opportunity: Recycled and lower-emission feedstock opens premium foam grades.
Retrofit Budgets Put Insulation Foam into Older Homes
Sales of insulation foam gain as Europe retrofits buildings with insulation, FMI finds. The UK Warm Homes Plan carries £15 billion of public investment, the government said on 20 January 2026.[3] The plan aims to bring up to a million families out of fuel poverty by 2030.[3] Insulation installers will buy more board and spray systems as grant rounds open, and the polyurethane composites market will gain from Warm Homes Plan building upgrades.
Conflict Disruption and Price Resets Unsettle Feedstock Costs
Isocyanate supply shocks like the 2026 Middle East conflict losses will keep testing foam converters through the decade. Key challenges faced by manufacturers include sudden swings in isocyanate supply and price. Dow said second-quarter 2026 volume fell 2% in Industrial Intermediates and Infrastructure, driven by lower volumes in Polyurethanes and Construction Chemicals, including impacts from the Middle East conflict.[8] Local price in the same segment rose 15% year over year.[8] Huntsman chief executive Peter Huntsman said the company immediately increased prices across all products and regions to protect margins.[6] Foam converters on spot buying will absorb the Huntsman price increases first and pass them to furniture and insulation customers later.
Recycled and Lower-Emission Feedstock Opens Premium Grades
Lower-carbon feedstock will unlock value across the supply chain and give foam producers a route to premium pricing. Sales potential is expected to emerge from foams made with recycled or lower-carbon raw materials. Mitsui Chemicals said the Yeosu expansion will use recycling facilities added in 2024 to cut greenhouse gas emissions per unit produced.[1] Bedding brands and carmakers will pay a premium for foam with a lower carbon footprint. Producers offering bio-attributed polyols will gain first orders from European furniture groups.
Which country CAGRs are profiled in the polyurethane foam market?
Table 8: Country CAGR Comparison for the Polyurethane Foam Market (CAGR percentage), 2026 to 2036
| Country | CAGR |
|---|---|
| United States | 6.0% |
| South Korea | 5.9% |
| Japan | 5.7% |
| Europe (Excluding UK) | 5.6% |
| United Kingdom | 5.4% |
How do country-level CAGRs compare in the polyurethane foam market?
Country CAGRs cluster between 5.4% and 6.0%, around the 5.8% global CAGR. FMI puts the United States and South Korea above the global CAGR at 6.0% and 5.9% from 2026 to 2036. Japan follows at a 5.7% CAGR. Europe excluding the UK records a 5.6% CAGR. The United Kingdom comes fifth, on a 5.4% CAGR. The United States and South Korea also host the newest MDI capacity, at Geismar and Yeosu.
- United States growth pairs new Gulf Coast MDI with insulation codes.
- South Korea adds MDI tonnage for automotive and flame-retardant insulation.
- Japan grows on cars and electronics against weak housing starts.
- Europe excluding the UK faces upstream closures and higher energy costs.
- The United Kingdom relies on public retrofit funding for insulation sales.
Full report country CAGRs cover: six regional blocks, namely North America, Europe, East Asia, Middle East and Africa, South Asia Pacific, and Latin America.
Country-wise Analysis
United States Polyurethane Foam Market Outlook (2026 to 2036)
At 6.0% from 2026 to 2036, the American CAGR is the top rate in the country table. BASF said in September 2026 that the USD 1 billion expansion of MDI output at Geismar, Louisiana, had entered final commissioning.[4] Local isocyanate will cut import exposure for spray foam blenders and insulation board plants. Huntsman reported polyurethanes volume gains led by the Americas and Europe in the first quarter of 2026.[6] Builders will keep spray foam on new homes and roof retrofits.
Key takeaway: Gulf Coast MDI gives American foamers the shortest supply chain among the five profiled countries.
South Korea Polyurethane Foam Market Outlook (2026 to 2036)
Mitsui Chemicals linked the Yeosu MDI expansion to growing demand for automotive materials and high-performance MDI for flame-retardant insulation.[1] Korean carmakers and panel builders operate next to the Yeosu plant. Capacity will reach 710,000 tons a year once the work finishes, on a tentative date of May 2027.[1] Korean sales expand on a 5.9% CAGR from 2026 to 2036, and export foam for regional car plants will add to home demand.
Key takeaway: Korean converters will buy MDI from a full-capacity local plant and ship foam parts to car factories across Asia.
Japan Polyurethane Foam Market Outlook (2026 to 2036)
Housing starts at a 62-year low give Japan a weak building base for foam. Starts fell 6.5% in 2025 to 740,667 units, Jiji Press reported from land ministry figures.[9] An April law revision delayed starts for wooden homes with energy-saving features, the same report said.[9] Japan still grows at a 5.7% CAGR from 2026 to 2036. Car seating, electronics cushioning and acoustic parts will carry more of Japanese demand than construction.
Key takeaway: Japanese growth will lean on automotive and electronics foam until housing starts recover.
Europe (Excluding UK) Polyurethane Foam Market Outlook (2026 to 2036)
Continental Europe runs just under the 5.8% global CAGR with 5.6% from 2026 to 2036. Dow announced in July 2025 the shutdown of three upstream European assets and said the region continues to face difficult market dynamics.[5] About 800 Dow roles will be affected.[5] Huntsman saw some improvement in Europe in the first quarter of 2026.[6] Foamers in Germany, Italy and Poland will source more isocyanate from Asian and Middle Eastern plants. EU energy-efficiency rules will keep insulation board orders coming.
Key takeaway: Continental foamers will gain steady insulation orders but carry higher feedstock risk as upstream plants close.
United Kingdom Polyurethane Foam Market Outlook (2026 to 2036)
Last of the five profiled countries, Britain posts a 5.4% CAGR from 2026 to 2036. The Warm Homes Plan will roll upgrades out to up to 5 million homes with £15 billion of public money, DESNZ said in January 2026.[3] Insulation board, spray foam and draught proofing will gain from each funding round. UK converters will keep importing isocyanate and polyol, so landed cost will track European and Asian prices. Installers with accredited crews will take most Warm Homes Plan work.
Key takeaway: Warm Homes Plan grant timing will set British insulation foam sales through 2036.
Who are the notable companies in the Polyurethane Foam Market?
Dow Inc., BASF SE, Covestro, Rogers Corporation, UFP Technologies, Inc., Tosoh Corporation, Armacell GmbH, Foamcraft, Inc., FoamPartner Group and Future Foam, Inc. form the core competitive set in polyurethane foam.
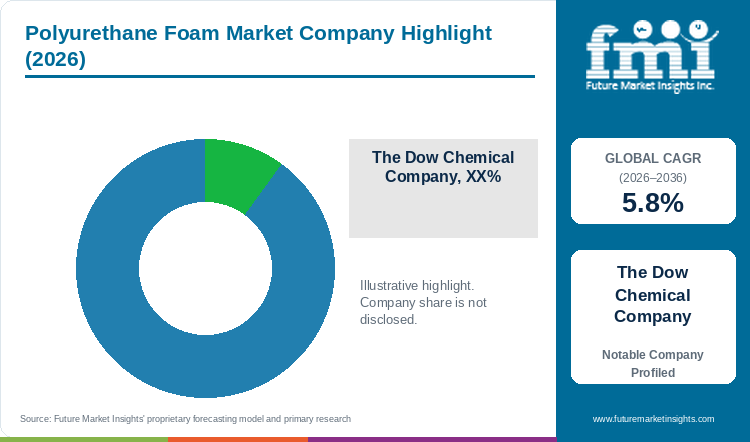
Four named leaders, Dow, BASF, Covestro and Rogers, front a long tail of smaller foamers. FMI assigns Dow Inc. 16% to 18% of the market, BASF SE 14% to 16% and Covestro 12% to 14%. Rogers Corporation holds 8% to 10%, and other companies take 42% to 50% between them. Covestro raised Shanghai TDI capacity to 370 kilotonnes a year.[2] BASF moved the Geismar MDI expansion into final commissioning.[4] Dow set German upstream shutdowns for late 2027.[5]
- Share leaders: Dow Inc., BASF SE, Covestro, and Rogers Corporation.
- Technical and insulation foam suppliers: UFP Technologies, Inc., Tosoh Corporation, Armacell GmbH, and FoamPartner Group.
- Comfort foam suppliers: Foamcraft, Inc. and Future Foam, Inc.
Competitive Benchmarking: Polyurethane Foam Market
Table 9: Competitive Benchmarking for the Polyurethane Foam Market (qualitative documentation ratings), 2026
| Company | Capacity Additions | Results Disclosure | Europe Restructuring | Asia Footprint |
|---|---|---|---|---|
| Dow Inc. | Low | High | High | Low |
| BASF SE | High | Medium | Low | Medium |
| Covestro | High | High | Low | High |
| Huntsman | Low | High | Low | Medium |
| Mitsui Chemicals | High | Medium | Low | High |
Key Developments in the Polyurethane Foam Market
- In January 2026, Covestro AG completed a debottlenecking project at its toluene diisocyanate production facility at the Covestro Integrated Site Shanghai in the Shanghai Chemical Industry Park. The project raised annual TDI capacity from 310,000 to 370,000 metric tonnes, a 20.0% increase, to strengthen supply reliability for furniture, mattress, and automotive customers across Asia Pacific [1].
- In December 2025, Mitsui Chemicals, Inc. announced that its affiliate Kumho Mitsui Chemicals, Inc. will increase MDI production capacity at the Yeosu plant in Jeollanam, South Korea from 610,000 to 710,000 tonnes per year. Construction is scheduled to begin in February 2026, with completion targeted for May 2027, addressing rising demand for automotive materials and high-performance flame-retardant insulation materials [2].
- In July 2025, Dow Inc. announced the board-approved shutdown of three upstream European manufacturing assets, including an ethylene cracker in Böhlen, Germany and chlor-alkali and vinyl assets in Schkopau, Germany, as part of a broader effort to right-size regional capacity and improve European profitability. Shutdown activities are expected to begin in mid-2026 and complete by end-2027, affecting approximately 800 roles [3].
Key Players in the Polyurethane Foam Market
Share Leaders
- Dow Inc.
- BASF SE
- Covestro
- Rogers Corporation
Technical and Insulation Foam Suppliers
- UFP Technologies, Inc.
- Tosoh Corporation
- Armacell GmbH
- FoamPartner Group
Comfort Foam Suppliers
- Foamcraft, Inc.
- Future Foam, Inc.
Polyurethane Foam Market - Report Scope
Table 10: Report Scope for the Polyurethane Foam Market (coverage fields and definitions), 2026 to 2036
| Coverage field | Report scope |
|---|---|
| Market breakdown | Product type; density; application; end-use industry; region |
| Quantitative units | USD million |
| Market definition | Polyurethane foam market covering rigid, flexible and spray foam in high, medium and low densities for insulation, automotive, furniture and bedding, packaging, electronics, footwear and other uses. |
| Regions covered | North America; Latin America; Europe; South Asia Pacific; East Asia; Middle East and Africa |
| Countries covered | United States; South Korea; Japan; Europe (Excluding UK); United Kingdom |
| Key companies profiled | Dow Inc., BASF SE, Covestro, Rogers Corporation, UFP Technologies, Inc., Tosoh Corporation, Armacell GmbH, Foamcraft, Inc., FoamPartner Group, Future Foam, Inc. |
| Forecast period | 2026 to 2036 |
Polyurethane Foam Market - Research Methodology
Table 11: Research Methodology for the Polyurethane Foam Market (research methods and approach), 2026 edition
| Method | Approach |
|---|---|
| Data Sources | Quarterly producer results, plant capacity releases, UK and Japanese government data and trade press from May 2025 onward. |
| Desk Research | Desk work tracked MDI, TDI and polyol capacity moves, upstream closures, producer quarterly results and retrofit programs. |
| Market Sizing and Forecasting | Sizing starts from the 2025 base of USD 55,753.0 million and the 5.8% CAGR from 2026 to 2036. |
| Data Validation | Capacity and price figures were matched across producer releases from the same reporting period. |
Polyurethane Foam Market by Segments
Polyurethane Foam Market segmented by Product Type:
- Rigid Foam
- Flexible Foam
- Spray Foam
Polyurethane Foam Market segmented by Density:
- High Density
- Medium Density
- Low Density
Polyurethane Foam Market segmented by Application:
- Sound Insulation
- Heat Insulation
- Electricity Installations
- Industrial Roof Insulation
- Sports Equipment
- Automotive Interior
Polyurethane Foam Market segmented by End-Use Industry:
- Furniture and Bedding
- Construction
- Electronics
- Packaging
- Footwear
- Automotive
- Others
Polyurethane Foam Market by Region
- North America
- Latin America
- Europe
- South Asia Pacific
- East Asia
- Middle East and Africa
Research Sources and Bibliography
- [1] Covestro AG. (2026). Covestro Expands TDI Production Capacity in China. https://www.marketscreener.com/news/covestro-expands-tdi-production-capacity-in-china-ce7e5bdcd880f125
- [2] Mitsui Chemicals, Inc. (2025). Kumho Mitsui Chemicals to Increase Capacity of MDI Production Facilities. https://jp.mitsuichemicals.com/en/release/2025/2025_1215_1/index.htm
- [3] Dow Inc. (2025). Dow will shut down three upstream European assets in response to structural challenges in the region. https://corporate.dow.com/en-us/news/press-releases/dow-will-shut-down-three-upstream-european-assets-in-response-to.html
- [4] BASF SE. (2026, September 21). BASF evaluates MDI investment in India. https://www.basf.com/global/en/media/news-releases/2026/09/p-26-166
- [5] Dow. (2025, July 7). Dow will shut down three upstream European assets in response to structural challenges in the region. https://corporate.dow.com/en-us/news/press-releases/dow-will-shut-down-three-upstream-european-assets-in-response-to.html
- [6] Huntsman Corporation. (2026, April 30). Huntsman Announces First Quarter 2026 Earnings. https://www.huntsman.com/news/media-releases/detail/623/huntsman-announces-first-quarter-2026-earnings
- [7] Nasdaq (RTTNews). (2026, August 1). Covestro Posts HY Profit; Lifts FY26 EBITDA Outlook. https://nasdaq.com/articles/covestro-posts-hy-profit-lifts-fy26-ebitda-outlook
- [8] Dow. (2026, July 23). Dow reports second quarter 2026 results. https://investors.dow.com/en/news/news-details/2026/Dow-reports-second-quarter-2026-results/default.aspx
- [9] Nippon.com (Jiji Press). (2026, January 30). Japan Housing Starts Fall to 62-Year Low in 2025. https://www.nippon.com/en/news/yjj2026013001015
This bibliography is provided for reader reference. The full report contains the complete reference list and detailed citations.
This Report Answers
- What will polyurethane foam sales reach in 2026 and 2036?
- What CAGR will the market record from 2026 to 2036?
- Which product type and density grade will hold the largest shares?
- Which applications and end users will drive foam volumes?
- Which countries will grow fastest over the decade?
- Which producers will shape isocyanate and polyol supply through 2036?
Table of Content
- Key Takeaways
- Market Size and CAGR
- Top Growth Driver
- Fastest Growing Segment
- Leading Region
- Key Companies
- Emerging Opportunities
- Executive Summary
- Global Market Outlook
- Demand-side Trends
- Supply-side Trends
- Technology Roadmap Analysis
- Analysis and Recommendations
- Analyst Perspective (What is happening? Why now? What should investors know?)
- Key Questions Answered
- How large is the market?
- What is the CAGR?
- What are key trends?
- Which region dominates?
- Who are the leaders?
Read More...
- Market Overview
- Market Coverage / Taxonomy
- Market Definition / Scope / Limitations
- Research Methodology
- Chapter Orientation
- Analytical Lens and Working Hypotheses
- Market Structure, Signals, and Trend Drivers
- Benchmarking and Cross-market Comparability
- Market Sizing, Forecasting, and Opportunity Mapping
- Research Design and Evidence Framework
- Desk Research Programme (Secondary Evidence)
- Expert Input and Fieldwork (Primary Evidence)
- Tooling, Models, and Reference Databases
- Data Engineering and Model Build
- Quality Assurance and Audit Trail
- Market Background
- Market Dynamics (Drivers, Restraints, Opportunity, Trends)
- Scenario Forecast (Optimistic, Likely, Conservative)
- Impact Analysis
- AI Impact
- Sustainability Impact
- Regulatory Impact
- Technology Impact
- Consumer / Buyer Analysis
- Purchase Drivers
- Adoption Barriers
- Buyer Journey
- Opportunity Map Analysis
- Product Life Cycle Analysis
- Supply Chain Analysis
- Investment Feasibility Matrix
- Value Chain Analysis
- PESTLE and Porter's Analysis
- Regulatory Landscape
- Regional Parent Market Outlook
- Production and Consumption Statistics
- Import and Export Statistics
- Global Market Analysis and Forecast, 2021 to 2036
- Historical Market Size Value (USD Million) Analysis, 2021 to 2025
- Current and Future Market Size Value (USD Million) Projections, 2026 to 2036
- Y-o-Y Growth Trend Analysis
- Absolute $ Opportunity Analysis
- Global Market Pricing Analysis, 2021 to 2036
- Global Market Analysis and Forecast, By Product Type, 2021 to 2036
- Introduction / Key Findings
- Historical Market Size Value (USD Million) Analysis By Product Type, 2021 to 2025
- Current and Future Market Size Value (USD Million) Analysis and Forecast By Product Type, 2026 to 2036
- Rigid Foam
- Flexible Foam
- Spray Foam
- Y-o-Y Growth Trend Analysis By Product Type, 2021 to 2025
- Absolute $ Opportunity Analysis By Product Type, 2026 to 2036
- Global Market Analysis and Forecast, By Density, 2021 to 2036
- Introduction / Key Findings
- Historical Market Size Value (USD Million) Analysis By Density, 2021 to 2025
- Current and Future Market Size Value (USD Million) Analysis and Forecast By Density, 2026 to 2036
- High Density
- Medium Density
- Low Density
- Y-o-Y Growth Trend Analysis By Density, 2021 to 2025
- Absolute $ Opportunity Analysis By Density, 2026 to 2036
- Global Market Analysis and Forecast, By Application, 2021 to 2036
- Introduction / Key Findings
- Historical Market Size Value (USD Million) Analysis By Application, 2021 to 2025
- Current and Future Market Size Value (USD Million) Analysis and Forecast By Application, 2026 to 2036
- Sound Insulation
- Heat Insulation
- Electricity Installations
- Industrial Roof Insulation
- Sports Equipment
- Automotive Interior
- Y-o-Y Growth Trend Analysis By Application, 2021 to 2025
- Absolute $ Opportunity Analysis By Application, 2026 to 2036
- Global Market Analysis and Forecast, By End-Use Industry, 2021 to 2036
- Introduction / Key Findings
- Historical Market Size Value (USD Million) Analysis By End-Use Industry, 2021 to 2025
- Current and Future Market Size Value (USD Million) Analysis and Forecast By End-Use Industry, 2026 to 2036
- Furniture and Bedding
- Construction
- Electronics
- Packaging
- Footwear
- Automotive
- Others
- Y-o-Y Growth Trend Analysis By End-Use Industry, 2021 to 2025
- Absolute $ Opportunity Analysis By End-Use Industry, 2026 to 2036
- Global Market Analysis and Forecast, By Region, 2021 to 2036
- Introduction
- Historical Market Size Value (USD Million) Analysis By Region, 2021 to 2025
- Current Market Size Value (USD Million) Analysis and Forecast By Region, 2026 to 2036
- North America
- Latin America
- Europe
- East Asia
- Middle East and Africa
- Market Attractiveness Analysis By Region
- North America Market Analysis and Forecast, By Country, 2021 to 2036
- Historical Market Size Value (USD Million) Trend Analysis By Market Taxonomy, 2021 to 2025
- Market Size Value (USD Million) Forecast By Market Taxonomy, 2026 to 2036
- By Country
- By Product Type
- By Density
- By Application
- By End-Use Industry
- Market Attractiveness Analysis
- By Country
- By Product Type
- By Density
- By Application
- By End-Use Industry
- Key Takeaways
- Latin America Market Analysis and Forecast, By Country
- Historical Market Size Value (USD Million) Trend Analysis By Market Taxonomy, 2021 to 2025
- Market Size Value (USD Million) Forecast By Market Taxonomy, 2026 to 2036
- By Country
- By Product Type
- By Density
- By Application
- By End-Use Industry
- Market Attractiveness Analysis
- By Country
- By Product Type
- By Density
- By Application
- By End-Use Industry
- Key Takeaways
- Europe Market Analysis and Forecast, By Country
- Historical Market Size Value (USD Million) Trend Analysis By Market Taxonomy, 2021 to 2025
- Market Size Value (USD Million) Forecast By Market Taxonomy, 2026 to 2036
- By Country
- South Asia Pacific
- By Product Type
- By Density
- By Application
- By End-Use Industry
- By Country
- Market Attractiveness Analysis
- By Country
- By Product Type
- By Density
- By Application
- By End-Use Industry
- Key Takeaways
- East Asia Market Analysis and Forecast, By Country
- Historical Market Size Value (USD Million) Trend Analysis By Market Taxonomy, 2021 to 2025
- Market Size Value (USD Million) Forecast By Market Taxonomy, 2026 to 2036
- By Country
- By Product Type
- By Density
- By Application
- By End-Use Industry
- Market Attractiveness Analysis
- By Country
- By Product Type
- By Density
- By Application
- By End-Use Industry
- Key Takeaways
- Middle East and Africa Market Analysis and Forecast, By Country
- Historical Market Size Value (USD Million) Trend Analysis By Market Taxonomy, 2021 to 2025
- Market Size Value (USD Million) Forecast By Market Taxonomy, 2026 to 2036
- By Country
- By Product Type
- By Density
- By Application
- By End-Use Industry
- Market Attractiveness Analysis
- By Country
- By Product Type
- By Density
- By Application
- By End-Use Industry
- Key Takeaways
- Key Countries Market Analysis
- United States
- Pricing Analysis
- Market Share Analysis, 2025
- By Product Type
- By Density
- By Application
- By End-Use Industry
- South Korea
- Pricing Analysis
- Market Share Analysis, 2025
- By Product Type
- By Density
- By Application
- By End-Use Industry
- Japan
- Pricing Analysis
- Market Share Analysis, 2025
- By Product Type
- By Density
- By Application
- By End-Use Industry
- Europe (Excluding UK)
- Pricing Analysis
- Market Share Analysis, 2025
- By Product Type
- By Density
- By Application
- By End-Use Industry
- United Kingdom
- Pricing Analysis
- Market Share Analysis, 2025
- By Product Type
- By Density
- By Application
- By End-Use Industry
- United States
- Market Structure Analysis
- Competition Dashboard
- Competition Benchmarking
- Market Share Analysis of Top Players
- By Regional
- By Product Type
- By Density
- By Application
- By End-Use Industry
- Emerging Startups
- Innovation Benchmarking
- Competition Analysis
- Competition Deep Dive
- Dow Inc.
- Overview
- Product Portfolio
- Profitability by Market Segments
- Sales Footprint
- Strategy Overview
- Marketing Strategy
- Product Strategy
- Channel Strategy
- BASF SE
- Covestro
- Huntsman
- Mitsui Chemicals
- Rogers Corporation
- UFP Technologies, Inc.
- Tosoh Corporation
- Armacell GmbH
- FoamPartner Group
- Foamcraft, Inc.
- Future Foam, Inc.
- Dow Inc.
- Case Studies
- Success Stories
- Recent Developments
- Competition Deep Dive
- Assumptions & Acronyms Used
List of Tables
- Table 1: Global Market Value (USD Million) Forecast by Region, 2021 to 2036
- Table 2: Global Market Value (USD Million) Forecast by Product Type, 2021 to 2036
- Table 3: Global Market Value (USD Million) Forecast by Density, 2021 to 2036
- Table 4: Global Market Value (USD Million) Forecast by Application, 2021 to 2036
- Table 5: Global Market Value (USD Million) Forecast by End-Use Industry, 2021 to 2036
- Table 6: North America Market Value (USD Million) Forecast by Country, 2021 to 2036
- Table 7: North America Market Value (USD Million) Forecast by Product Type, 2021 to 2036
- Table 8: North America Market Value (USD Million) Forecast by Density, 2021 to 2036
- Table 9: North America Market Value (USD Million) Forecast by Application, 2021 to 2036
- Table 10: North America Market Value (USD Million) Forecast by End-Use Industry, 2021 to 2036
- Table 11: Latin America Market Value (USD Million) Forecast by Country, 2021 to 2036
- Table 12: Latin America Market Value (USD Million) Forecast by Product Type, 2021 to 2036
- Table 13: Latin America Market Value (USD Million) Forecast by Density, 2021 to 2036
- Table 14: Latin America Market Value (USD Million) Forecast by Application, 2021 to 2036
- Table 15: Latin America Market Value (USD Million) Forecast by End-Use Industry, 2021 to 2036
- Table 16: Europe Market Value (USD Million) Forecast by Country, 2021 to 2036
- Table 17: Europe Market Value (USD Million) Forecast by Product Type, 2021 to 2036
- Table 18: Europe Market Value (USD Million) Forecast by Density, 2021 to 2036
- Table 19: Europe Market Value (USD Million) Forecast by Application, 2021 to 2036
- Table 20: Europe Market Value (USD Million) Forecast by End-Use Industry, 2021 to 2036
- Table 21: East Asia Market Value (USD Million) Forecast by Country, 2021 to 2036
- Table 22: East Asia Market Value (USD Million) Forecast by Product Type, 2021 to 2036
- Table 23: East Asia Market Value (USD Million) Forecast by Density, 2021 to 2036
- Table 24: East Asia Market Value (USD Million) Forecast by Application, 2021 to 2036
- Table 25: East Asia Market Value (USD Million) Forecast by End-Use Industry, 2021 to 2036
- Table 26: Middle East and Africa Market Value (USD Million) Forecast by Country, 2021 to 2036
- Table 27: Middle East and Africa Market Value (USD Million) Forecast by Product Type, 2021 to 2036
- Table 28: Middle East and Africa Market Value (USD Million) Forecast by Density, 2021 to 2036
- Table 29: Middle East and Africa Market Value (USD Million) Forecast by Application, 2021 to 2036
- Table 30: Middle East and Africa Market Value (USD Million) Forecast by End-Use Industry, 2021 to 2036
List of Figures
- Figure 1: Global Market Pricing Analysis
- Figure 2: Global Market Value (USD Million) Forecast 2021-2036
- Figure 3: Global Market Value Share and BPS Analysis by Product Type, 2026 and 2036
- Figure 4: Global Market Y-o-Y Growth Comparison by Product Type, 2026-2036
- Figure 5: Global Market Attractiveness Analysis by Product Type
- Figure 6: Global Market Value Share and BPS Analysis by Density, 2026 and 2036
- Figure 7: Global Market Y-o-Y Growth Comparison by Density, 2026-2036
- Figure 8: Global Market Attractiveness Analysis by Density
- Figure 9: Global Market Value Share and BPS Analysis by Application, 2026 and 2036
- Figure 10: Global Market Y-o-Y Growth Comparison by Application, 2026-2036
- Figure 11: Global Market Attractiveness Analysis by Application
- Figure 12: Global Market Value Share and BPS Analysis by End-Use Industry, 2026 and 2036
- Figure 13: Global Market Y-o-Y Growth Comparison by End-Use Industry, 2026-2036
- Figure 14: Global Market Attractiveness Analysis by End-Use Industry
- Figure 15: Global Market Value (USD Million) Share and BPS Analysis by Region, 2026 and 2036
- Figure 16: Global Market Y-o-Y Growth Comparison by Region, 2026-2036
- Figure 17: Global Market Attractiveness Analysis by Region
- Figure 18: North America Market Incremental Dollar Opportunity, 2026-2036
- Figure 19: Latin America Market Incremental Dollar Opportunity, 2026-2036
- Figure 20: Europe Market Incremental Dollar Opportunity, 2026-2036
- Figure 21: East Asia Market Incremental Dollar Opportunity, 2026-2036
- Figure 22: Middle East and Africa Market Incremental Dollar Opportunity, 2026-2036
- Figure 23: North America Market Value Share and BPS Analysis by Country, 2026 and 2036
- Figure 24: North America Market Value Share and BPS Analysis by Product Type, 2026 and 2036
- Figure 25: North America Market Y-o-Y Growth Comparison by Product Type, 2026-2036
- Figure 26: North America Market Attractiveness Analysis by Product Type
- Figure 27: North America Market Value Share and BPS Analysis by Density, 2026 and 2036
- Figure 28: North America Market Y-o-Y Growth Comparison by Density, 2026-2036
- Figure 29: North America Market Attractiveness Analysis by Density
- Figure 30: North America Market Value Share and BPS Analysis by Application, 2026 and 2036
- Figure 31: North America Market Y-o-Y Growth Comparison by Application, 2026-2036
- Figure 32: North America Market Attractiveness Analysis by Application
- Figure 33: North America Market Value Share and BPS Analysis by End-Use Industry, 2026 and 2036
- Figure 34: North America Market Y-o-Y Growth Comparison by End-Use Industry, 2026-2036
- Figure 35: North America Market Attractiveness Analysis by End-Use Industry
- Figure 36: Latin America Market Value Share and BPS Analysis by Country, 2026 and 2036
- Figure 37: Latin America Market Value Share and BPS Analysis by Product Type, 2026 and 2036
- Figure 38: Latin America Market Y-o-Y Growth Comparison by Product Type, 2026-2036
- Figure 39: Latin America Market Attractiveness Analysis by Product Type
- Figure 40: Latin America Market Value Share and BPS Analysis by Density, 2026 and 2036
- Figure 41: Latin America Market Y-o-Y Growth Comparison by Density, 2026-2036
- Figure 42: Latin America Market Attractiveness Analysis by Density
- Figure 43: Latin America Market Value Share and BPS Analysis by Application, 2026 and 2036
- Figure 44: Latin America Market Y-o-Y Growth Comparison by Application, 2026-2036
- Figure 45: Latin America Market Attractiveness Analysis by Application
- Figure 46: Latin America Market Value Share and BPS Analysis by End-Use Industry, 2026 and 2036
- Figure 47: Latin America Market Y-o-Y Growth Comparison by End-Use Industry, 2026-2036
- Figure 48: Latin America Market Attractiveness Analysis by End-Use Industry
- Figure 49: Europe Market Value Share and BPS Analysis by Country, 2026 and 2036
- Figure 50: Europe Market Value Share and BPS Analysis by Product Type, 2026 and 2036
- Figure 51: Europe Market Y-o-Y Growth Comparison by Product Type, 2026-2036
- Figure 52: Europe Market Attractiveness Analysis by Product Type
- Figure 53: Europe Market Value Share and BPS Analysis by Density, 2026 and 2036
- Figure 54: Europe Market Y-o-Y Growth Comparison by Density, 2026-2036
- Figure 55: Europe Market Attractiveness Analysis by Density
- Figure 56: Europe Market Value Share and BPS Analysis by Application, 2026 and 2036
- Figure 57: Europe Market Y-o-Y Growth Comparison by Application, 2026-2036
- Figure 58: Europe Market Attractiveness Analysis by Application
- Figure 59: Europe Market Value Share and BPS Analysis by End-Use Industry, 2026 and 2036
- Figure 60: Europe Market Y-o-Y Growth Comparison by End-Use Industry, 2026-2036
- Figure 61: Europe Market Attractiveness Analysis by End-Use Industry
- Figure 62: East Asia Market Value Share and BPS Analysis by Country, 2026 and 2036
- Figure 63: East Asia Market Value Share and BPS Analysis by Product Type, 2026 and 2036
- Figure 64: East Asia Market Y-o-Y Growth Comparison by Product Type, 2026-2036
- Figure 65: East Asia Market Attractiveness Analysis by Product Type
- Figure 66: East Asia Market Value Share and BPS Analysis by Density, 2026 and 2036
- Figure 67: East Asia Market Y-o-Y Growth Comparison by Density, 2026-2036
- Figure 68: East Asia Market Attractiveness Analysis by Density
- Figure 69: East Asia Market Value Share and BPS Analysis by Application, 2026 and 2036
- Figure 70: East Asia Market Y-o-Y Growth Comparison by Application, 2026-2036
- Figure 71: East Asia Market Attractiveness Analysis by Application
- Figure 72: East Asia Market Value Share and BPS Analysis by End-Use Industry, 2026 and 2036
- Figure 73: East Asia Market Y-o-Y Growth Comparison by End-Use Industry, 2026-2036
- Figure 74: East Asia Market Attractiveness Analysis by End-Use Industry
- Figure 75: Middle East and Africa Market Value Share and BPS Analysis by Country, 2026 and 2036
- Figure 76: Middle East and Africa Market Value Share and BPS Analysis by Product Type, 2026 and 2036
- Figure 77: Middle East and Africa Market Y-o-Y Growth Comparison by Product Type, 2026-2036
- Figure 78: Middle East and Africa Market Attractiveness Analysis by Product Type
- Figure 79: Middle East and Africa Market Value Share and BPS Analysis by Density, 2026 and 2036
- Figure 80: Middle East and Africa Market Y-o-Y Growth Comparison by Density, 2026-2036
- Figure 81: Middle East and Africa Market Attractiveness Analysis by Density
- Figure 82: Middle East and Africa Market Value Share and BPS Analysis by Application, 2026 and 2036
- Figure 83: Middle East and Africa Market Y-o-Y Growth Comparison by Application, 2026-2036
- Figure 84: Middle East and Africa Market Attractiveness Analysis by Application
- Figure 85: Middle East and Africa Market Value Share and BPS Analysis by End-Use Industry, 2026 and 2036
- Figure 86: Middle East and Africa Market Y-o-Y Growth Comparison by End-Use Industry, 2026-2036
- Figure 87: Middle East and Africa Market Attractiveness Analysis by End-Use Industry
- Figure 88: Global Market - Tier Structure Analysis
- Figure 89: Global Market - Company Share Analysis
Frequently Asked Questions
What is the size of the polyurethane foam market in 2026?
The 2026 estimate will be USD 58,986.7 million, rising to USD 103,659.8 million by 2036, FMI projects.
How fast will the polyurethane foam market grow?
The CAGR will be 5.8% between 2026 and 2036. Insulation retrofits and new isocyanate capacity will support that rate.
Which product type will lead in 2026?
Flexible foam will take 48.6% of product type sales, with rigid foam second.
Which density grade will hold the largest share?
Medium-density foam will account for 42.3% of density sales in 2026.
Which country will post the fastest growth?
United States sales will grow fastest, at a 6.0% CAGR, with South Korea next at 5.9%.
Which companies will hold the largest shares?
Dow will keep 16% to 18% in the FMI company split. BASF will hold 14% to 16%, with Covestro on 12% to 14% and Rogers on 8% to 10%.
Preview the report firsthand - request a free sample
Get SampleGet the brochure for pricing and purchase details.
Get PDF
