
- Market Size (2026)
- USD 392.8 Mn
- Forecast (2036)
- USD 554.1 Mn
- CAGR (2026 to 2036)
- 3.5%
How big is the Quinoline Market in 2026?
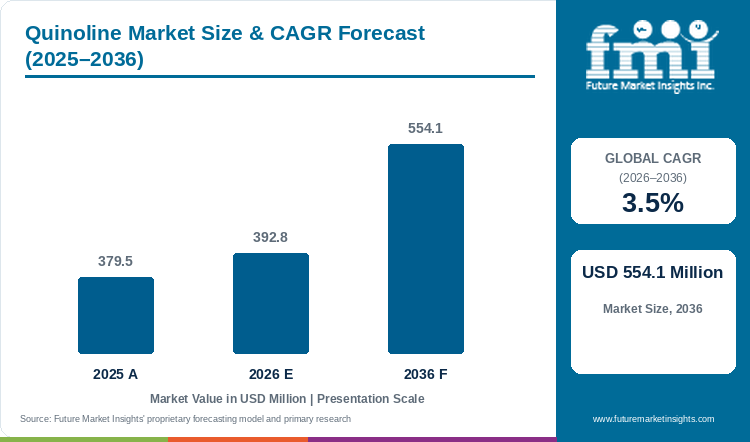
The global quinoline market is estimated at USD 392.8 million in 2026, compared with USD 379.5 million in 2025, and is forecast to reach USD 554.1 million by 2036, expanding at a CAGR of 3.5% from 2026 to 2036.
Demand for quinoline is driven by synthesis routes that use the base chemical and is expanding to manufacturers of corrosion inhibitors and dyes. In an April 2026 data release, the US Environmental Protection Agency reported that Aceto imported 35,274 pounds of quinoline. The company identified its use as a reactant in corrosion inhibitor manufacturing across 25 to fewer than 100 industrial sites. Similarly, a March 2026 German federal textile procurement guide set a maximum limit of 50 milligrams per kilogram for quinoline in finished products. This regulation requires dye suppliers to manage carryover and conduct testing, adding to their service requirements without increasing the physical volume of quinoline sold.
Product specifications also play a major role in the market. Thermo Fisher Scientific labels its quinoline as 99 percent pure, but the gas chromatography acceptance limit is at least 98.5 percent. This means buyers must review the specific test limits and analytical records rather than relying only on the product name. According to analysis by FMI, the cost of removing residual quinoline and maintaining the required documentation can influence supplier choice just as much as the initial purchase price.
Market Size & Forecast
Table 1: Quinoline Market Size and Forecast (USD million and CAGR percentage), 2025 to 2036
| Market size and forecast | Value |
|---|---|
| 2025 Value | USD 379.5 million |
| Estimated market size in 2026 | USD 392.8 million |
| Projected market size by 2036 | USD 554.1 million |
| CAGR (2026-2036) | 3.5% |
| Added revenue, 2026 to 2036 | USD 161.3 million |
Key Market Trends & Insights
- Material with purity up to 99.0% is estimated to account for 63.4% of quinoline demand by purity in 2026, because for most buyers a specific impurity matters more than a small difference in total assay.
- Pharmaceutical synthesis is expected to hold 33.8% of demand by application in 2026, and only routes that buy the parent chemical count toward it.
- Industrial formulators give quinoline an outlet beyond pharmaceutical work. Aceto reported importing 35,274 pounds in 2023 for use as a reactant in corrosion-inhibitor manufacture, at 25 to fewer than 100 industrial sites. [1]
- Residual limits are reaching dye customers. Germany's March 2026 federal textile procurement guide limits quinoline in finished products to 50 mg/kg, [2] so carry-over control and testing add to the cost of serving them.
- The test limit matters as much as the product name. Thermo Fisher Scientific's nominal 99% quinoline has a gas-chromatography acceptance limit of at least 98.5%, [3] so a synthesis customer approves material on its analytical record.
- Local stock decides small orders. TCI offers same-day dispatch from Hyderabad stock against 10 to 12 working days for items held in Japan, [4] which favors suppliers that hold material close to laboratories.
Regional Highlights
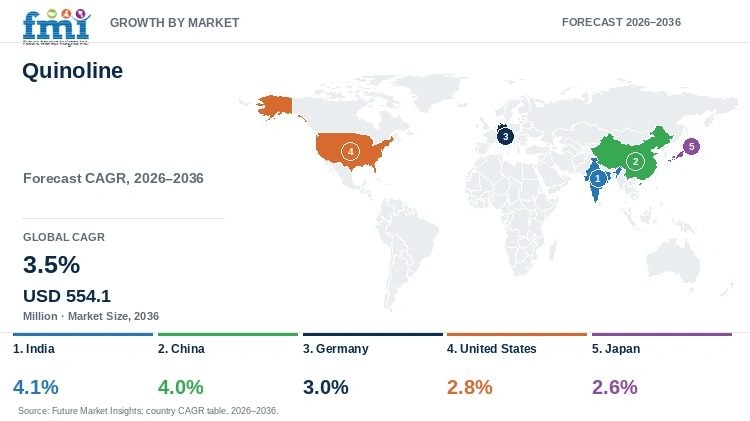
- India is likely to grow at a 4.1% CAGR during the forecast period, followed by China at 4.0%, Germany at 3.0%, the United States at 2.8% and Japan at 2.6%.
Analyst Perspective
“Quinoline demand depends on synthesis routes that consume the parent chemical. Clear impurity limits and comparable batch certificates help suppliers retain orders as customers assess reaction performance and the cost of removing residues from the products they make.”
- Nikhil Kaitwade, Principal Consultant, FMI
How is the Quinoline Market segmented?
The Quinoline Market is segmented by purity, application and region.
- By Purity: Purity up to 99.0% and Purity above 99.0%.
- By Application: Dyes, Metallurgical, Pharmaceutical Synthesis, Pesticides, Cosmetics, Food Additive and Others. Cosmetics and Food Additive are restricted application review categories and do not imply permission for direct addition of parent quinoline.
- By Region: North America, Latin America, Western Europe, Eastern Europe, East Asia, South Asia and Pacific, and Middle East and Africa.
Why is Purity up to 99.0% the Leading Purity Grade in the Quinoline Market?
Material with purity up to 99.0% accounts for an estimated 63.4% of quinoline demand by purity in 2026, equal to about USD 249.0 million, as per FMI's analysis.
Table 2: Purity Share for the Quinoline Market (percentage share of revenue), 2026
| Segment | Share (2026) |
|---|---|
| Purity up to 99.0% | 63.4% |
| Other segments combined | 36.6% |
Thermo Fisher Scientific's specification gives a gas-chromatography acceptance limit of at least 98.5% for its nominal 99.0% quinoline. [3] The product name identifies the offer, while the test limit sets the basis on which material is accepted.
The larger category serves processes in which the material meets the reaction requirement, or in which later purification removes the relevant residual constituents. A particular impurity often matters more than a small difference in assay, and the commercial question is whether the material performs in that process and whether the next batch can be judged on the same basis.
However, material in this category does not suit every reaction, and some customers need a tighter specification before processing begins. A higher assay earns its cost only where it addresses a relevant impurity or reduces the purification required.
Suppliers best placed to retain these orders state the analytical method, provide a usable batch certificate and keep the impurities that matter to the selected reaction within the agreed limits.
Why is Pharmaceutical Synthesis the Leading Application in the Quinoline Market?
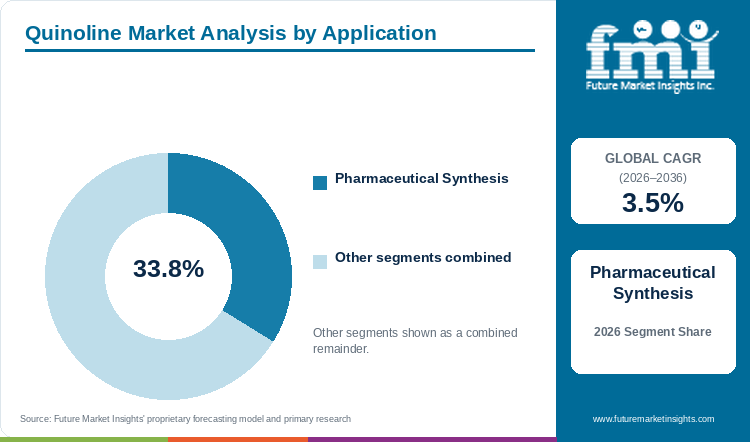
Pharmaceutical synthesis is estimated to hold 33.8% of quinoline demand by application in 2026, as per FMI's analysis.
Table 3: Application Share for the Quinoline Market (percentage share of revenue), 2026
| Segment | Share (2026) |
|---|---|
| Pharmaceutical synthesis | 33.8% |
| Other segments combined | 66.2% |
Demand arises when the selected manufacturing route uses parent quinoline as a starting material or another specified input. A process developer may compare several routes to a target molecule before choosing one, and only a route that buys quinoline contributes to this market.
The supplier's role continues after route selection. The customer needs an impurity profile suited to the next conversion step and documents that allow a change in the input material to be assessed, and Loba Chemie's safety data sheet, which names laboratory chemicals and the manufacture of substances as uses, [5] describes the synthesis setting.
However, a quinoline structure in a medicine does not show that merchant quinoline was consumed, because a different route can assemble the same structure without the purchased compound. Growth in pharmaceutical sales does not carry directly into the quinoline forecast.
Suppliers best placed support the actual consumption step, maintain the required impurity profile and provide comparable material as the customer moves from development quantities to repeat orders.
What are the Key Drivers, Restraints and Opportunities in the Quinoline Market?
The quinoline market is expected to grow from USD 392.8 million in 2026 to USD 554.1 million by 2036, which adds USD 161.3 million over the forecast period. Selected synthesis routes support demand, while impurity sensitivity and application limits restrict the uses that can be counted, and supplier opportunities follow the needs of those processes.
Driver: processes that consume parent quinoline. Once a useful synthesis route establishes the chemical as an input, production supports recurring purchases to a defined specification, including preparation of intermediates and other specialist chemical products. The individual chemical step decides whether quinoline is actually consumed.
Restraint: impurity sensitivity and application limits. A higher nominal assay adds cost without removing the constituent that causes a reaction or purification problem. Food and consumer claims need separate care, because the FDA records quinoline as no longer FEMA GRAS, [6] and a finished colorant or other derivative has its own chemical and commercial identity.
Opportunity: material for development and repeat synthesis. Smaller users need suitable quantities, clear specifications and a certificate they can use to interpret their results, and Loba Chemie's safety data sheet identifies the chemical and its synthesis uses. [5] Suppliers that carry that clarity into later orders can serve customers as their requirements grow.
The strongest opportunity lies with suppliers that know which part of a process uses quinoline and can deliver material within the limits set for that step. A successful laboratory result can lead to more orders, but it does not guarantee a production route or industrial volume.
How do Use Restrictions and Analytical Specifications Influence Demand?
The rules and documents that apply to quinoline serve different purposes. A substance record defines the chemical and its application limits, a supplier specification describes the material on offer, and environmental guidance answers a further question and has to be read within its stated scope.
Substance identity and intended use
Quinoline has CAS number 91-22-5, and Loba Chemie's safety documentation names laboratory chemicals and the manufacture of substances as relevant uses. [5] The parent identity and intended use have to stay clear when a customer compares quinoline with similarly named derivatives.
Food status and permitted uses
The FDA's quinoline entry records that the substance is no longer FEMA GRAS and refers to a 2015 determination. [6] The September 2026 update to the page is not a new policy change. Older flavoring descriptions cannot support an assumption of unrestricted food use, and a proposed application needs its own lawful basis.
Analytical acceptance and environmental guidance
Thermo Fisher Scientific's specification pairs a nominal purity description with a stated chromatographic limit. [3] That is an acceptance criterion for the product offered and does not show that it suits every synthesis route. Canada's federal environmental quality guideline has a distinct role as well: an ambient guideline is not a plant discharge permit. [7] Neither document should be read beyond the question it answers.
The effect on demand is a narrower and more clearly defined application base. Suppliers improve their position when they identify the chemical, describe the test basis and keep use claims within the relevant documents, and the purchase can then be judged against the actual process.
What Technical and Operational Constraints Affect Quinoline Supply?
The main constraints lie in chemical preparation, reaction performance and continuity between orders, and meeting a nominal assay does not remove the need to examine each of them.
The first is preparation. Environment and Climate Change Canada links quinoline to compounds that come from coal, [7] which makes purification and identification relevant to a prepared offer. Buying the defined parent chemical is different from buying a coal-tar fraction, whose wider composition lies outside this market.
The second is residual constituents. An impurity can affect the intended reaction or survive downstream purification, and a higher assay helps only where it addresses that problem. Thermo Fisher Scientific's stated gas-chromatography limit shows why the acceptance criterion has to be read with the nominal product description. [3]
The third is continuity. A development result shows how one material performed under the conditions used, while a production user needs later quantities to stay within the range on which the process was set. Comparable test criteria and notice of material changes let the customer judge that continuity.
These constraints favor suppliers that can explain their specification and maintain the material characteristics the customer relies on. They also limit the value of comparing price or assay before the reaction requirement is known.
Where are the Commercial Opportunities for Quinoline Suppliers?
The opportunities lie in moving suitable material from development work into repeat consumption, avoiding unnecessary purification and supporting smaller orders with usable documents.
The first is continuity through development. A customer may begin with a small quantity while comparing routes and need more if one route proceeds, and a supplier that keeps the specified product available can support that step. The opportunity depends on the route continuing to use parent quinoline, because successful research alone does not set future volume.
The second is process economics. Where the analytical record shows that lower-purity material meets the reaction requirement, a customer can avoid paying for a higher assay that adds no practical benefit. Where one impurity creates extra purification work, a tighter specification may be worth its cost, and the commercial value follows the problem solved.
The third is documented supply for evaluation. Smaller users may need limited quantities for a defined programme, including industrial investigations of corrosion inhibitors, [1] and a clear identity, an interpretable certificate and consistent follow-on material make a useful offer even when the work does not lead to a large order.
Dyes and pigments are a related field, but sales of finished colorants stay outside the parent quinoline total. Suppliers have a firmer basis for an order when they know whether quinoline enters the synthesis itself and what specification that step needs.
Quinoline Market by Country (2026 to 2036)
Table 4: Country Growth Outlook for the Quinoline Market (CAGR percentage), 2026 to 2036
| Country | CAGR (2026-2036) |
|---|---|
| India | 4.1% |
| China | 4.0% |
| Germany | 3.0% |
| United States | 2.8% |
| Japan | 2.6% |
What supports quinoline demand in India?
India is likely to grow at a 4.1% CAGR during the forecast period, the highest rate among the countries analysed.
Loba Chemie's Indian product documentation names laboratory use and the manufacture of substances, [5] and TCI dispatches quinoline on the same day from Hyderabad stock. [4] Local stock is an advantage for time-sensitive synthesis orders. The disadvantage is for material that is not held locally, which takes 10 to 12 working days to arrive from Japan.
Repeatable synthesis purchases are the likely source of growth, and pharmaceutical growth counts only where it creates an identifiable need for parent quinoline. Larger orders will depend on the customer knowing which residual constituents affect its process.
What determines the quinoline opportunity in China?
China is likely to grow at a 4.0% CAGR during the forecast period.
Handan Huida reports producing quinoline at its coal-chemical operation in Hebei. [8] A domestic source is an advantage for Chinese synthesis buyers placing repeat orders. The disadvantage is that quinoline's link to compounds that come from coal [7] makes purification and clear identification relevant, and it does not show the quality of an individual offer.
The outlook follows prepared quinoline linked to actual downstream consumption. Wider growth in chemical output supports it only where the selected process uses the parent substance.
What is supporting quinoline purchases in Germany?
Germany is likely to grow at a 3.0% CAGR during the forecast period.
The March 2026 federal textile procurement guide sets a ceiling of 50 mg/kg for quinoline in finished products. [2] A defined limit is an advantage for dye suppliers with testing records, since it gives them a clear target. The disadvantage is that control of carry-over and testing add to the cost of serving those customers.
Specialised synthesis and development work is the other source of demand, where the impurity profile has to fit the process. Thermo Fisher Scientific's specification, which separates a nominal purity name from a detailed acceptance limit, [3] supports an informed incoming-material check, and suppliers compete by giving customers a stable analytical basis for evaluating and reordering material.
What shapes quinoline demand in the United States?
The United States is likely to grow at a 2.8% CAGR during the forecast period.
Aceto's 2023 reporting identifies quinoline as a reactant in corrosion-inhibitor manufacture at 25 to fewer than 100 industrial sites. [1] The spread of users is an advantage, because it supports supply to several industrial formulators. The disadvantage is the food boundary: the FDA records quinoline as no longer FEMA GRAS under a 2015 determination, [6] so older flavoring descriptions cannot support a demand forecast.
Laboratory and industrial purchases for a suitable synthesis process keep a separate commercial role. Suppliers serving them need specific use descriptions and a clear parent identity, particularly where catalog entries include historical synonyms or are compared with finished derivatives.
What supports quinoline demand in Japan?
Japan is likely to grow at a 2.6% CAGR during the forecast period, the lowest rate among the countries analysed.
TCI lists 500 g quinoline packs for same-day dispatch from its Saitama warehouse. [9] Local stock helps laboratories obtain small orders quickly, which is an advantage for domestic distribution alongside bulk chemical supply. The disadvantage is that a development programme may finish without creating recurring industrial consumption.
The forecast therefore stays tied to actual use of parent quinoline and not to research activity alone. A supplier specification gives a basis for comparing later quantities with the material used in the first experiment, [3] and continuity matters even when the order is small.
Who are the notable companies in the Quinoline Market?
The companies differ by the products they offer and the channels through which customers buy them. Merck, Thermo Fisher Scientific, Tokyo Chemical Industry, Loba Chemie and Spectrum Chemical give identifiable commercial access to quinoline, and their roles are compared at the product level, not as evidence of equal manufacturing capacity.
Merck sells quinoline under its Sigma-Aldrich chemical offer, and Thermo Fisher Scientific sells a nominal 99.0% catalog product with a defined analytical acceptance criterion. [3] These offers serve laboratory and development purchases, where customers need a specified chemical and the documents that describe it.
Tokyo Chemical Industry sells quinoline as Q0011, [4] and Loba Chemie sells quinoline for synthesis under product 05542, with safety documentation that names laboratory and substance manufacture uses. [5] Spectrum Chemical lists a TCI-branded quinoline item, which is an additional sales channel for an identified product and not a separate quinoline plant. A customer seeking industrial quantities still has to establish the available specification and supply arrangement directly.
The companies best placed to retain customers keep the offered product and its analytical basis clear through repeat orders. No single revenue-share leader is identified.
Key Developments in the Quinoline Market
- In September 2026, the FDA updated its quinoline database page, which continues to record the substance as no longer FEMA GRAS under a 2015 determination; the update is not a new policy. [6]
- In April 2026, the EPA's 2024 Chemical Data Reporting release recorded Aceto's 2023 quinoline imports and their use in corrosion-inhibitor manufacture. [1]
- In March 2026, Germany's federal textile procurement guide set a ceiling of 50 mg/kg for quinoline in finished products. [2]
- In July 2025, Loba Chemie revised its quinoline safety data sheet, which names laboratory chemicals and the manufacture of substances as uses. [5]
Key Players in the Quinoline Market
- Merck
- Thermo Fisher Scientific
- Tokyo Chemical Industry
- Loba Chemie
- Spectrum Chemical
Quinoline Market Report Scope
Table 5: Report Scope for the Quinoline Market (coverage fields and definitions), 2026 to 2036
| Coverage Field | Report Scope |
|---|---|
| Market Breakdown | Purity (Purity up to 99.0%, Purity above 99.0%); Application (Dyes, Metallurgical, Pharmaceutical Synthesis, Pesticides, Cosmetics, Food Additive, Others) |
| Quantitative Units | Revenue in USD million and CAGR from 2026 to 2036 |
| Market Definition | Commercial parent quinoline, CAS 91-22-5, bought for defined synthesis, laboratory and industrial processes, including laboratory-channel purchases. It excludes the full sales of medicines and colorants that contain a quinoline structure, coal-tar mixtures as a whole and unsupported direct food or cosmetic addition. |
| Regions Covered | North America, Latin America, Western Europe, Eastern Europe, East Asia, South Asia and Pacific, Middle East and Africa |
| Countries Covered | India, China, Germany, United States and Japan |
| Key Companies Covered | Merck, Thermo Fisher Scientific, Tokyo Chemical Industry, Loba Chemie and Spectrum Chemical |
| Forecast Period | 2026 to 2036 (with 2025 historical baseline) |
| Approach | Combined primary interviews, secondary literature analysis, and top-down data triangulation |
Quinoline Market - Research Methodology
The market assessment combines primary interviews with industry participants and secondary research drawn from company disclosures, trade data and industry publications. Market size is built from supply-side and demand-side estimates and validated top-down, and segment shares and competitive positioning are checked through data triangulation before publication.
Quinoline Market by Segments
By Purity
- Purity up to 99.0%
- Purity above 99.0%
By Application
- Dyes
- Metallurgical
- Pharmaceutical Synthesis
- Pesticides
- Cosmetics
- Food Additive
- Others
By Region
- North America
- United States
- Canada
- Latin America
- Brazil
- Mexico
- Argentina
- Chile
- Western Europe
- Germany
- France
- United Kingdom
- Italy
- Spain
- Benelux
- Nordics
- Eastern Europe
- Poland
- Czech Republic
- Romania
- Hungary
- East Asia
- China
- Japan
- South Korea
- South Asia and Pacific
- India
- ASEAN
- Australia and New Zealand
- Middle East and Africa
- GCC Countries
- South Africa
- Turkiye
- Israel
Research Sources and Bibliography
- [1] U.S. Environmental Protection Agency. 2024 Chemical Data Reporting public database, April 2026 release: quinoline manufacture/import and industrial processing records. April 2026.
- [2] German Federal Government. Guide to sustainable textile procurement by the federal administration, updated third edition. March 2026.
- [3] Thermo Fisher Scientific. Product Specification: Quinoline, 99%. 2026.
- [4] Tokyo Chemical Industry (India). Quinoline Q0011: Indian stock and dispatch terms (product page). n.d.
- [5] Loba Chemie. Quinoline for Synthesis: Safety Data Sheet (revised July 2025). 2025.
- [6] U.S. Food and Drug Administration. Substances Added to Food: Quinoline--NLFG (database entry, updated September 2026). 2026.
- [7] Environment and Climate Change Canada. Federal environmental quality guidelines - Quinoline. 2020.
- [8] Handan Huida Chemical. Company profile: coal-tar processing and quinoline production in Hebei. n.d.
- [9] Tokyo Chemical Industry. Quinoline Q0011: Japanese stock and dispatch terms (product page). n.d.
Table of Content
Table of Content
- Key Takeaways
- Market Size and CAGR
- Top Growth Driver
- Fastest Growing Segment
- Leading Region
- Key Companies
- Emerging Opportunities
- Executive Summary
- Global Market Outlook
- Demand-side Trends
- Supply-side Trends
- Technology Roadmap Analysis
- Analysis and Recommendations
- Analyst Perspective (What is happening? Why now? What should investors know?)
- Key Questions Answered
- How large is the market?
- What is the CAGR?
- What are key trends?
- Which region dominates?
- Who are the leaders?
Read More...
- Market Overview
- Market Coverage / Taxonomy
- Market Definition / Scope / Limitations
- Research Methodology
- Chapter Orientation
- Analytical Lens and Working Hypotheses
- Market Structure, Signals, and Trend Drivers
- Benchmarking and Cross-market Comparability
- Market Sizing, Forecasting, and Opportunity Mapping
- Research Design and Evidence Framework
- Desk Research Programme (Secondary Evidence)
- Expert Input and Fieldwork (Primary Evidence)
- Tooling, Models, and Reference Databases
- Data Engineering and Model Build
- Quality Assurance and Audit Trail
- Market Background
- Market Dynamics (Drivers, Restraints, Opportunity, Trends)
- Scenario Forecast (Optimistic, Likely, Conservative)
- Impact Analysis
- AI Impact
- Sustainability Impact
- Regulatory Impact
- Technology Impact
- Consumer / Buyer Analysis
- Purchase Drivers
- Adoption Barriers
- Buyer Journey
- Opportunity Map Analysis
- Product Life Cycle Analysis
- Supply Chain Analysis
- Investment Feasibility Matrix
- Value Chain Analysis
- PESTLE and Porter's Analysis
- Regulatory Landscape
- Regional Parent Market Outlook
- Production and Consumption Statistics
- Import and Export Statistics
- Global Market Analysis and Forecast, 2021 to 2036
- Historical Market Size Value (USD Million) Analysis, 2021 to 2025
- Current and Future Market Size Value (USD Million) Projections, 2026 to 2036
- Y-o-Y Growth Trend Analysis
- Absolute $ Opportunity Analysis
- Global Market Pricing Analysis, 2021 to 2036
- Global Market Analysis and Forecast, By Purity, 2021 to 2036
- Introduction / Key Findings
- Historical Market Size Value (USD Million) Analysis By Purity, 2021 to 2025
- Current and Future Market Size Value (USD Million) Analysis and Forecast By Purity, 2026 to 2036
- Purity up to 99.0%
- Purity above 99.0%
- Y-o-Y Growth Trend Analysis By Purity, 2021 to 2025
- Absolute $ Opportunity Analysis By Purity, 2026 to 2036
- Global Market Analysis and Forecast, By Application, 2021 to 2036
- Introduction / Key Findings
- Historical Market Size Value (USD Million) Analysis By Application, 2021 to 2025
- Current and Future Market Size Value (USD Million) Analysis and Forecast By Application, 2026 to 2036
- Dyes
- Metallurgical
- Pharmaceutical Synthesis
- Pesticides
- Cosmetics
- Food Additive
- Others
- Y-o-Y Growth Trend Analysis By Application, 2021 to 2025
- Absolute $ Opportunity Analysis By Application, 2026 to 2036
- Global Market Analysis and Forecast, By Region, 2021 to 2036
- Introduction
- Historical Market Size Value (USD Million) Analysis By Region, 2021 to 2025
- Current Market Size Value (USD Million) Analysis and Forecast By Region, 2026 to 2036
- North America
- Latin America
- Western Europe
- Eastern Europe
- East Asia
- South Asia and Pacific
- Middle East and Africa
- Market Attractiveness Analysis By Region
- North America Market Analysis and Forecast, By Country, 2021 to 2036
- Historical Market Size Value (USD Million) Trend Analysis By Market Taxonomy, 2021 to 2025
- Market Size Value (USD Million) Forecast By Market Taxonomy, 2026 to 2036
- By Country
- United States
- Canada
- By Purity
- By Application
- By Country
- Market Attractiveness Analysis
- By Country
- By Purity
- By Application
- Key Takeaways
- Latin America Market Analysis and Forecast, By Country
- Historical Market Size Value (USD Million) Trend Analysis By Market Taxonomy, 2021 to 2025
- Market Size Value (USD Million) Forecast By Market Taxonomy, 2026 to 2036
- By Country
- Brazil
- Mexico
- Argentina
- Chile
- By Purity
- By Application
- By Country
- Market Attractiveness Analysis
- By Country
- By Purity
- By Application
- Key Takeaways
- Western Europe Market Analysis and Forecast, By Country
- Historical Market Size Value (USD Million) Trend Analysis By Market Taxonomy, 2021 to 2025
- Market Size Value (USD Million) Forecast By Market Taxonomy, 2026 to 2036
- By Country
- Germany
- France
- United Kingdom
- Italy
- Spain
- Benelux
- Nordics
- By Purity
- By Application
- By Country
- Market Attractiveness Analysis
- By Country
- By Purity
- By Application
- Key Takeaways
- Eastern Europe Market Analysis and Forecast, By Country
- Historical Market Size Value (USD Million) Trend Analysis By Market Taxonomy, 2021 to 2025
- Market Size Value (USD Million) Forecast By Market Taxonomy, 2026 to 2036
- By Country
- Poland
- Czech Republic
- Romania
- Hungary
- By Purity
- By Application
- By Country
- Market Attractiveness Analysis
- By Country
- By Purity
- By Application
- Key Takeaways
- East Asia Market Analysis and Forecast, By Country
- Historical Market Size Value (USD Million) Trend Analysis By Market Taxonomy, 2021 to 2025
- Market Size Value (USD Million) Forecast By Market Taxonomy, 2026 to 2036
- By Country
- China
- Japan
- South Korea
- By Purity
- By Application
- By Country
- Market Attractiveness Analysis
- By Country
- By Purity
- By Application
- Key Takeaways
- South Asia and Pacific Market Analysis and Forecast, By Country
- Historical Market Size Value (USD Million) Trend Analysis By Market Taxonomy, 2021 to 2025
- Market Size Value (USD Million) Forecast By Market Taxonomy, 2026 to 2036
- By Country
- India
- ASEAN
- Australia and New Zealand
- By Purity
- By Application
- By Country
- Market Attractiveness Analysis
- By Country
- By Purity
- By Application
- Key Takeaways
- Middle East and Africa Market Analysis and Forecast, By Country
- Historical Market Size Value (USD Million) Trend Analysis By Market Taxonomy, 2021 to 2025
- Market Size Value (USD Million) Forecast By Market Taxonomy, 2026 to 2036
- By Country
- GCC Countries
- South Africa
- Turkiye
- Israel
- By Purity
- By Application
- By Country
- Market Attractiveness Analysis
- By Country
- By Purity
- By Application
- Key Takeaways
- Key Countries Market Analysis
- United States
- Pricing Analysis
- Market Share Analysis, 2025
- By Purity
- By Application
- Canada
- Pricing Analysis
- Market Share Analysis, 2025
- By Purity
- By Application
- Mexico
- Pricing Analysis
- Market Share Analysis, 2025
- By Purity
- By Application
- Brazil
- Pricing Analysis
- Market Share Analysis, 2025
- By Purity
- By Application
- Chile
- Pricing Analysis
- Market Share Analysis, 2025
- By Purity
- By Application
- Germany
- Pricing Analysis
- Market Share Analysis, 2025
- By Purity
- By Application
- United Kingdom
- Pricing Analysis
- Market Share Analysis, 2025
- By Purity
- By Application
- Italy
- Pricing Analysis
- Market Share Analysis, 2025
- By Purity
- By Application
- Spain
- Pricing Analysis
- Market Share Analysis, 2025
- By Purity
- By Application
- France
- Pricing Analysis
- Market Share Analysis, 2025
- By Purity
- By Application
- India
- Pricing Analysis
- Market Share Analysis, 2025
- By Purity
- By Application
- ASEAN
- Pricing Analysis
- Market Share Analysis, 2025
- By Purity
- By Application
- Australia and New Zealand
- Pricing Analysis
- Market Share Analysis, 2025
- By Purity
- By Application
- China
- Pricing Analysis
- Market Share Analysis, 2025
- By Purity
- By Application
- Japan
- Pricing Analysis
- Market Share Analysis, 2025
- By Purity
- By Application
- South Korea
- Pricing Analysis
- Market Share Analysis, 2025
- By Purity
- By Application
- Poland
- Pricing Analysis
- Market Share Analysis, 2025
- By Purity
- By Application
- Hungary
- Pricing Analysis
- Market Share Analysis, 2025
- By Purity
- By Application
- South Africa
- Pricing Analysis
- Market Share Analysis, 2025
- By Purity
- By Application
- United States
- Market Structure Analysis
- Competition Dashboard
- Competition Benchmarking
- Market Share Analysis of Top Players
- By Regional
- By Purity
- By Application
- Emerging Startups
- Innovation Benchmarking
- Competition Analysis
- Competition Deep Dive
- Merck
- Overview
- Product Portfolio
- Profitability by Market Segments
- Sales Footprint
- Strategy Overview
- Marketing Strategy
- Product Strategy
- Channel Strategy
- Thermo Fisher Scientific
- Tokyo Chemical Industry
- Loba Chemie
- Spectrum Chemical
- Merck
- Case Studies
- Success Stories
- Recent Developments
- Competition Deep Dive
- Assumptions & Acronyms Used
List of Tables
- Table 1: Global Market Value (USD Million) Forecast by Region, 2021 to 2036
- Table 2: Global Market Value (USD Million) Forecast by Purity, 2021 to 2036
- Table 3: Global Market Value (USD Million) Forecast by Application, 2021 to 2036
- Table 4: North America Market Value (USD Million) Forecast by Country, 2021 to 2036
- Table 5: North America Market Value (USD Million) Forecast by Purity, 2021 to 2036
- Table 6: North America Market Value (USD Million) Forecast by Application, 2021 to 2036
- Table 7: Latin America Market Value (USD Million) Forecast by Country, 2021 to 2036
- Table 8: Latin America Market Value (USD Million) Forecast by Purity, 2021 to 2036
- Table 9: Latin America Market Value (USD Million) Forecast by Application, 2021 to 2036
- Table 10: Western Europe Market Value (USD Million) Forecast by Country, 2021 to 2036
- Table 11: Western Europe Market Value (USD Million) Forecast by Purity, 2021 to 2036
- Table 12: Western Europe Market Value (USD Million) Forecast by Application, 2021 to 2036
- Table 13: Eastern Europe Market Value (USD Million) Forecast by Country, 2021 to 2036
- Table 14: Eastern Europe Market Value (USD Million) Forecast by Purity, 2021 to 2036
- Table 15: Eastern Europe Market Value (USD Million) Forecast by Application, 2021 to 2036
- Table 16: East Asia Market Value (USD Million) Forecast by Country, 2021 to 2036
- Table 17: East Asia Market Value (USD Million) Forecast by Purity, 2021 to 2036
- Table 18: East Asia Market Value (USD Million) Forecast by Application, 2021 to 2036
- Table 19: South Asia and Pacific Market Value (USD Million) Forecast by Country, 2021 to 2036
- Table 20: South Asia and Pacific Market Value (USD Million) Forecast by Purity, 2021 to 2036
- Table 21: South Asia and Pacific Market Value (USD Million) Forecast by Application, 2021 to 2036
- Table 22: Middle East and Africa Market Value (USD Million) Forecast by Country, 2021 to 2036
- Table 23: Middle East and Africa Market Value (USD Million) Forecast by Purity, 2021 to 2036
- Table 24: Middle East and Africa Market Value (USD Million) Forecast by Application, 2021 to 2036
List of Figures
- Figure 1: Global Market Pricing Analysis
- Figure 2: Global Market Value (USD Million) Forecast 2021-2036
- Figure 3: Global Market Value Share and BPS Analysis by Purity, 2026 and 2036
- Figure 4: Global Market Y-o-Y Growth Comparison by Purity, 2026-2036
- Figure 5: Global Market Attractiveness Analysis by Purity
- Figure 6: Global Market Value Share and BPS Analysis by Application, 2026 and 2036
- Figure 7: Global Market Y-o-Y Growth Comparison by Application, 2026-2036
- Figure 8: Global Market Attractiveness Analysis by Application
- Figure 9: Global Market Value (USD Million) Share and BPS Analysis by Region, 2026 and 2036
- Figure 10: Global Market Y-o-Y Growth Comparison by Region, 2026-2036
- Figure 11: Global Market Attractiveness Analysis by Region
- Figure 12: North America Market Incremental Dollar Opportunity, 2026-2036
- Figure 13: Latin America Market Incremental Dollar Opportunity, 2026-2036
- Figure 14: Western Europe Market Incremental Dollar Opportunity, 2026-2036
- Figure 15: Eastern Europe Market Incremental Dollar Opportunity, 2026-2036
- Figure 16: East Asia Market Incremental Dollar Opportunity, 2026-2036
- Figure 17: South Asia and Pacific Market Incremental Dollar Opportunity, 2026-2036
- Figure 18: Middle East and Africa Market Incremental Dollar Opportunity, 2026-2036
- Figure 19: North America Market Value Share and BPS Analysis by Country, 2026 and 2036
- Figure 20: North America Market Value Share and BPS Analysis by Purity, 2026 and 2036
- Figure 21: North America Market Y-o-Y Growth Comparison by Purity, 2026-2036
- Figure 22: North America Market Attractiveness Analysis by Purity
- Figure 23: North America Market Value Share and BPS Analysis by Application, 2026 and 2036
- Figure 24: North America Market Y-o-Y Growth Comparison by Application, 2026-2036
- Figure 25: North America Market Attractiveness Analysis by Application
- Figure 26: Latin America Market Value Share and BPS Analysis by Country, 2026 and 2036
- Figure 27: Latin America Market Value Share and BPS Analysis by Purity, 2026 and 2036
- Figure 28: Latin America Market Y-o-Y Growth Comparison by Purity, 2026-2036
- Figure 29: Latin America Market Attractiveness Analysis by Purity
- Figure 30: Latin America Market Value Share and BPS Analysis by Application, 2026 and 2036
- Figure 31: Latin America Market Y-o-Y Growth Comparison by Application, 2026-2036
- Figure 32: Latin America Market Attractiveness Analysis by Application
- Figure 33: Western Europe Market Value Share and BPS Analysis by Country, 2026 and 2036
- Figure 34: Western Europe Market Value Share and BPS Analysis by Purity, 2026 and 2036
- Figure 35: Western Europe Market Y-o-Y Growth Comparison by Purity, 2026-2036
- Figure 36: Western Europe Market Attractiveness Analysis by Purity
- Figure 37: Western Europe Market Value Share and BPS Analysis by Application, 2026 and 2036
- Figure 38: Western Europe Market Y-o-Y Growth Comparison by Application, 2026-2036
- Figure 39: Western Europe Market Attractiveness Analysis by Application
- Figure 40: Eastern Europe Market Value Share and BPS Analysis by Country, 2026 and 2036
- Figure 41: Eastern Europe Market Value Share and BPS Analysis by Purity, 2026 and 2036
- Figure 42: Eastern Europe Market Y-o-Y Growth Comparison by Purity, 2026-2036
- Figure 43: Eastern Europe Market Attractiveness Analysis by Purity
- Figure 44: Eastern Europe Market Value Share and BPS Analysis by Application, 2026 and 2036
- Figure 45: Eastern Europe Market Y-o-Y Growth Comparison by Application, 2026-2036
- Figure 46: Eastern Europe Market Attractiveness Analysis by Application
- Figure 47: East Asia Market Value Share and BPS Analysis by Country, 2026 and 2036
- Figure 48: East Asia Market Value Share and BPS Analysis by Purity, 2026 and 2036
- Figure 49: East Asia Market Y-o-Y Growth Comparison by Purity, 2026-2036
- Figure 50: East Asia Market Attractiveness Analysis by Purity
- Figure 51: East Asia Market Value Share and BPS Analysis by Application, 2026 and 2036
- Figure 52: East Asia Market Y-o-Y Growth Comparison by Application, 2026-2036
- Figure 53: East Asia Market Attractiveness Analysis by Application
- Figure 54: South Asia and Pacific Market Value Share and BPS Analysis by Country, 2026 and 2036
- Figure 55: South Asia and Pacific Market Value Share and BPS Analysis by Purity, 2026 and 2036
- Figure 56: South Asia and Pacific Market Y-o-Y Growth Comparison by Purity, 2026-2036
- Figure 57: South Asia and Pacific Market Attractiveness Analysis by Purity
- Figure 58: South Asia and Pacific Market Value Share and BPS Analysis by Application, 2026 and 2036
- Figure 59: South Asia and Pacific Market Y-o-Y Growth Comparison by Application, 2026-2036
- Figure 60: South Asia and Pacific Market Attractiveness Analysis by Application
- Figure 61: Middle East and Africa Market Value Share and BPS Analysis by Country, 2026 and 2036
- Figure 62: Middle East and Africa Market Value Share and BPS Analysis by Purity, 2026 and 2036
- Figure 63: Middle East and Africa Market Y-o-Y Growth Comparison by Purity, 2026-2036
- Figure 64: Middle East and Africa Market Attractiveness Analysis by Purity
- Figure 65: Middle East and Africa Market Value Share and BPS Analysis by Application, 2026 and 2036
- Figure 66: Middle East and Africa Market Y-o-Y Growth Comparison by Application, 2026-2036
- Figure 67: Middle East and Africa Market Attractiveness Analysis by Application
- Figure 68: Global Market - Tier Structure Analysis
- Figure 69: Global Market - Company Share Analysis
Frequently Asked Questions
What is the size of the Quinoline Market?
The global quinoline market was valued at USD 379.5 million in 2025 and is estimated at USD 392.8 million in 2026. It is forecast to reach USD 554.1 million by 2036, expanding at a CAGR of 3.5% from 2026 to 2036.
Which purity category leads the Quinoline Market?
Material with purity up to 99.0% is estimated to account for 63.4% of demand by purity in 2026, and material above 99.0% holds the remaining 36.6%. The analytical specification should be read alongside the nominal purity name.
What share does pharmaceutical synthesis hold?
Pharmaceutical synthesis is estimated to account for 33.8% of application demand in 2026. The estimate covers the use of purchased parent quinoline in a selected synthesis route.
Which of the countries analysed is likely to grow fastest?
India is likely to grow at a 4.1% CAGR during the forecast period, followed by China at 4.0%, Germany at 3.0%, the United States at 2.8% and Japan at 2.6%.
Does the market include all medicines that contain a quinoline structure?
No. It covers parent quinoline. Finished medicines have a separate commercial identity, and a quinoline structure alone does not show that purchased parent quinoline was consumed.
Is quinoline an unrestricted food ingredient?
No. The FDA records quinoline as no longer FEMA GRAS, [6] and any proposed application needs its own lawful basis. Food Additive and Cosmetics are kept as restricted application review categories.
Why are catalog companies included?
Their product records show commercial access to quinoline. A catalog listing identifies an offer and does not by itself show dedicated bulk manufacturing capacity, and Spectrum Chemical's listed item is TCI-branded. Competitive Analysis of the Quinoline Market Key Players
Preview the report firsthand - request a free sample
Get SampleGet the brochure for pricing and purchase details.
Get PDF
