Quinoline Yellow WS Market Size and Share Forecast Outlook (2022 to 2032)

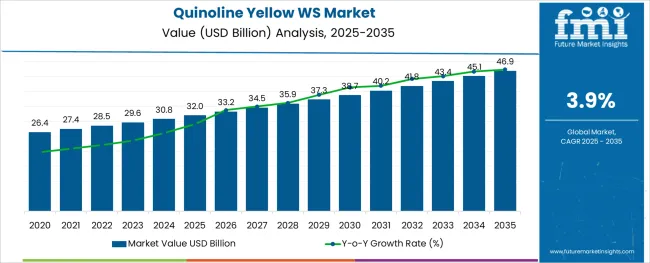
The global quinoline yellow WS (water soluble) market is projected to reach a valuation of USD 28.5 Million in 2022, growing at a CAGR of 3.9% between 2022 to 2032. The market is anticipated to be valued at USD 46.0 Million in 2032.

Attributes Key Statistics
Global Quinoline Yellow WS Market Estimated Size (2022E) USD 28.5 Million
Projected Market Valuation (2032F) USD 46.0 Million
Value-based CAGR (2022 to 2032) 3.9%
Value Share of Top Region: Asia Pacific 37.5%

A study by Future Market Insights mentions that food colors will account for nearly USD 5.3 Billion in terms of sales in 2032. By volume, the food colors market exhibited sales of about 185,000 metric tons in 2021, while quinoline yellow WS dyes showcased sales of around 2030 metric tons in the same year.

Quinoline yellow WS or food yellow 13 is a mixture of organic compounds made from the quinoline yellow SS (spirit soluble) dye. It is used as a colorant in medications, processed foods, dietary supplements, and cosmetics. It is usually combined with brilliant blue to produce various shades of green.

Quinoline yellow WS, also known as E104 in Europe, is a greenish-yellow food colorant used in a wide variety of applications. It is often utilized in restricted beverages in the European Union (EU) and Australia, as well as used in meals for decorations and coatings.

Quinoline yellow WS is not listed as a permissible food additive in Canada or the USA However, it is approved for use in medications and cosmetics under the name D&C Yellow 10.

Products containing quinoline yellow WS are widely applied in processed commercial food items. It provides them with an artificial green color. It is also added to foods to make them more attractive and enable consumers to identify the product from afar.

The global quinoline yellow WS market is mainly driven by increasing demand for exotic dishes. The rising use of social media platforms in both developed and developing countries is also anticipated to augment the demand for quinoline yellow WS in the next decade.

Demand for quinoline yellow WS is expected to reach approximately 3050 metric tons by 2032. As people are becoming more aware of the various food ingredients they are consuming, the need for natural food ingredients is rising. It is further expected to propel the demand for organic food colors like quinoline yellow WS in the evaluation period.

Comparison of Demand Outlook from 2017 to 2021 vs Forecast to 2032

Quinoline yellow WS is gaining immense popularity worldwide due to its affordability and easy accessibility. The advent of numerous start-up food processing companies with rising penetration of the internet and increasing health concerns is also expected to drive the market.

Synthetic colors like quinoline yellow WS are cost-effective and hold a huge competitive advantage as they are conveniently miscible. Quinoline is thus widely incorporated in the production of various specialty chemicals.

Unlike conventional synthetic food colors, quinoline yellow WS has antibacterial properties. It contains primaquine, amodiaquine, chloroquine, and quinine which are utilized in the treatment of malaria. Hence, quinoline yellow WS finds application in drugs and pesticides. Demand for these end-use products is expected to surge in Asia Pacific, thereby pushing the market.

The ability of quinoline yellow WS to add more vibrancy and stability to food products, as compared to natural yellow colorants is another vital factor that would aid growth. It is also used in frozen foods like meat, ice creams, and cakes.

Apart from that, quinoline yellow WS is used in convenience, ready-to-eat, and processed foods, as well as baked goods, carbonated drinks, alcoholic beverages, juices, sauces, and soup mixes. Spurred by the aforementioned factors the global quinoline yellow WS is set to exhibit growth at a CAGR of 3.9% in the forthcoming years from 2022 to 2032.

Challenges Restraining Growth in the Quinoline Yellow WS Market

Overexposure to quinoline yellow WS may cause nausea. It can also lead to adverse effects on the cornea, retina, and optic nerves. Besides, bans in a few regions and reluctance for synthetic food colorants among consumers are some of the other key restraints in the market. The surging use of natural food colors like spirulina colorants by international food processing companies is another significant factor that may challenge growth.

Analysis of Top Countries Using Quinoline Yellow WS

How is the Brazil Quinoline Yellow WS Market Progressing?

Use of Quinoline Yellow Colour as a Precursor to Oxine Will Boost Mexico Market

As per FMI, the Brazil quinoline yellow WS market was valued at USD 3.6 Million in 2021 and is set to be followed by China in terms of share. As government agencies have banned the use of quinoline yellow WS in the USA and Canada, the North American market is mainly driven by Mexico. Increasing utilization of quinoline yellow WS as a precursor to 8-hydroxyquinoline (oxine) across Brazil is anticipated to drive growth.

What is the India Quinoline Yellow WS Market Outlook?

Quinoline Yellow Dye Producers to Set up Manufacturing Facilities in India

India is projected to show considerable growth in the South Asia quinoline yellow WS market during the forecast period. Increasing adoption of numerous innovative food colorants by local companies in the country is projected to drive the market.

Various international food-grade color manufacturers are setting up their technologically advanced manufacturing facilities and establishing robust distribution networks in India owing to the easy availability of raw materials.

In addition, rising agricultural activities in the country are set to push the need for pesticides. Thus, increasing utilization of quinoline yellow WS for the manufacturing of pesticides is anticipated to bolster growth.

Expansion of the food industry, especially meat processing, bakery & confectionery, and processed food segments is another crucial factor that would augment growth in India. The presence of favorable government policies accelerating the development of unique foods and drinks is also set to spur growth.

Category-wise Insights in the Quinoline Yellow WS Market

Which is the Leading Application of Quinoline Yellow WS?

Quinoline Yellow Colour to Find Application in Dairy Products

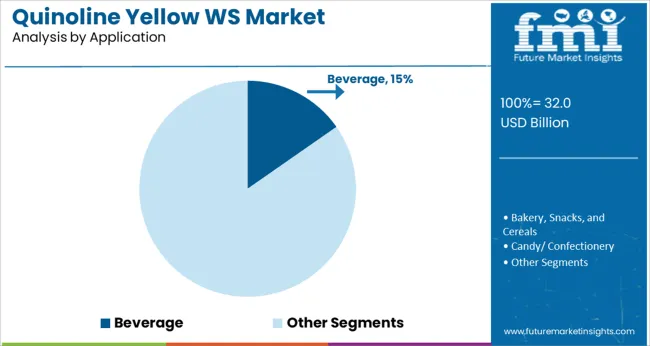
Based on application, the dairy, beverage, bakery, snacks, & cereals, fruit preparations/fillings, and candy/confectionery segments are likely to dominate the global quinoline yellow WS market. The dairy segment is anticipated to grow at a CAGR of 4.16% in the assessment period. Besides, the beverage segment is likely to hold nearly 27% of the quinoline yellow WS market share in the forthcoming years.
Competitive Landscape of the Quinoline Yellow WS Market

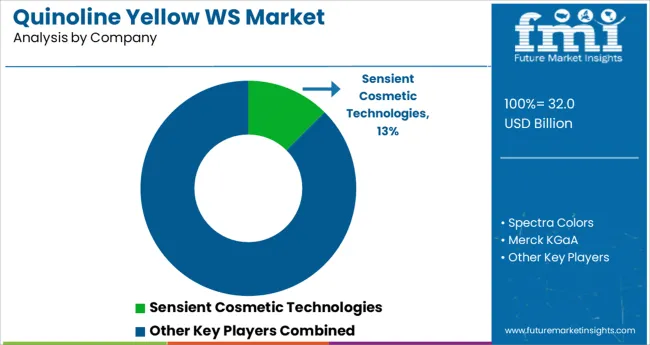
Some of the leading companies operating in the global quinoline yellow WS market include Merck KGaA, Vijay Chemical Industries, Salvi Chemical Industries, Neelikon Food Dyes & Chemicals, Symrise, Sigma-Aldrich Co. LLC., and Shanghai Dyestuffs Research Institute Co. Ltd., among others.

Emerging countries across the globe have been a target for synthetic food colorant producers in the recent past. Several companies are focusing on expanding their product portfolios to attract more consumers. A few other key players are aiming to engage in mergers & acquisitions, joint ventures, agreements, and product innovations to gain a competitive edge.

Scope and Coverage of the Quinoline Yellow WS Market Report

Attributes Details
Estimated Market Size (2022) USD 28.5 Million
Projected Market Valuation (2032) USD 46.0 Million
Value-based CAGR (2022 to 2032) 3.9%
Forecast Period 2022 to 2032
Historical Data Available for 2017 to 2021
Market Analysis Value (USD Million) and Volume (MT)
Key Regions Covered North America; Latin America; Europe; the Middle East and Africa; East Asia; South Asia; and Oceania
Key Countries Covered United States of America, Canada, Mexico, Brazil, Peru, Argentina, United Kingdom, China, India, Japan, Germany, Italy, France, South Africa, South Korea, Australia, and GCC Countries
Key Segments Covered Purity, Solubility, Application, and Region
Key Companies Profiled Sensient Cosmetic Technologies; Spectra Colors; Merck KGaA; Koel Colours; Shaedong Aoertong Chemical; Steris PLC; Sigma-Aldrich Co. LLC.; Diversey Inc.; Kao Corporation; Clariant; Neelikon Food Dyes and Chemicals; Symrise; Sun Chemical (DIC); Daito Kasei Kogyo; Others
Report Coverage Market forecast, Drivers, Restraints, Opportunities and Threats analysis, company share analysis, competition intelligence, market dynamics and challenges, and strategic growth initiatives

Top Segments Studied in the Quinoline Yellow WS Market by Category

By Purity:

  • Up to 99%
  • Above 99%

By Solubility:

  • Lakes
  • Dyes

By Application:

  • Beverage
  • Bakery, Snacks, and Cereals
  • Candy/ Confectionery
  • Dairy
  • Fruit Preparations/ Fillings
  • Meat, Poultry, Fish, and Eggs
  • Potatoes, Pasta, and Rice
  • Sauces, Soups, and Dressings
  • Seasonings
  • Pet Food
  • Others

By Region:

  • North America
  • Latin America
  • Europe
  • East Asia
  • South Asia
  • Oceania
  • Middle East and Africa

Table of Content

  • 1. Executive Summary | Quinoline Yellow WS Market
  • 2. Market Overview
  • 3. Market Background
  • 4. Global Market Analysis 2017 to 2021 and Forecast, 2022 to 2032
  • 5. Global Market Analysis 2017 to 2021 and Forecast 2022 to 2032, By Purity
    • 5.1. Up to 99%
    • 5.2. Above 99%
  • 6. Global Market Analysis 2017 to 2021 and Forecast 2022 to 2032, By Solubility
    • 6.1. Lakes
    • 6.2. Dyes
  • 7. Global Market Analysis 2017 to 2021 and Forecast 2022 to 2032, By Application
    • 7.1. Beverage
    • 7.2. Bakery, Snacks, and Cereals
    • 7.3. Candy/Confectionery
    • 7.4. Dairy
    • 7.5. Fruit Preparations/Fillings
    • 7.6. Meat, Poultry, Fish, and Eggs
    • 7.7. Potatoes, Pasta, and Rice
    • 7.8. Sauces, Soups, and Dressings
    • 7.9. Seasonings
    • 7.10. Pet Food
    • 7.11. Others
  • 8. Global Market Analysis 2017 to 2021 and Forecast 2022 to 2032, By Region
    • 8.1. North America
    • 8.2. Latin America
    • 8.3. Europe
    • 8.4. East Asia
    • 8.5. South Asia
    • 8.6. Oceania
    • 8.7. Middle East and Africa
  • 9. North America Market Analysis 2017 to 2021 and Forecast 2022 to 2032, By Country
  • 10. Latin America Market Analysis 2017 to 2021 and Forecast 2022 to 2032, By Country
  • 11. Europe Market Analysis 2017 to 2021 and Forecast 2022 to 2032, By Country
  • 12. East Asia Market Analysis 2017 to 2021 and Forecast 2022 to 2032, By Country
  • 13. South Asia Market Analysis 2017 to 2021 and Forecast 2022 to 2032, By Country
  • 14. Oceania Market Analysis 2017 to 2021 and Forecast 2022 to 2032, By Country
  • 15. Middle East and Africa Market Analysis 2017 to 2021 and Forecast 2022 to 2032, By Country
  • 16. Key Countries Market Analysis
  • 17. Market Structure Analysis
  • 18. Competition Analysis
    • 18.1. Sensient Cosmetic Technologies
    • 18.2. Spectra Colors
    • 18.3. Merck KGaA
    • 18.4. Koel Colours
    • 18.5. Shaedong Aoertong Chemical
    • 18.6. Steris PLC
    • 18.7. Sigma-Aldrich Co. LLC.
    • 18.8. Diversity Inc.
    • 18.9. Kao Corporation
    • 18.10. Clariant
    • 18.11. Neelikon Food Dyes and Chemicals
    • 18.12. Symrise
    • 18.13. Sun Chemical (DIC)
    • 18.14. Daito Kasei Kogyo
    • 18.15. Others on Additional Request
  • 19. Assumptions & Acronyms Used
  • 20. Research Methodology

List of Tables

Table 01: Global Market Value (US$ Million) Forecast by Region, 2017 to 2032

Table 02: Global Market Volume (MT) Forecast by Region, 2017 to 2032

Table 03: Global Market Value (US$ Million) Forecast by Purity, 2017 to 2032

Table 04: Global Market Volume (MT) Forecast by Purity, 2017 to 2032

Table 05: Global Market Value (US$ Million) Forecast by Solubility, 2017 to 2032

Table 06: Global Market Volume (MT) Forecast by Solubility, 2017 to 2032

Table 07: Global Market Value (US$ Million) Forecast by Application, 2017 to 2032

Table 08: Global Market Volume (MT) Forecast by Application, 2017 to 2032

Table 09: North America Market Value (US$ Million) Forecast by Country, 2017 to 2032

Table 10: North America Market Volume (MT) Forecast by Country, 2017 to 2032

Table 11: North America Market Value (US$ Million) Forecast by Purity, 2017 to 2032

Table 12: North America Market Volume (MT) Forecast by Purity, 2017 to 2032

Table 13: North America Market Value (US$ Million) Forecast by Solubility, 2017 to 2032

Table 14: North America Market Volume (MT) Forecast by Solubility, 2017 to 2032

Table 15: North America Market Value (US$ Million) Forecast by Application, 2017 to 2032

Table 16: North America Market Volume (MT) Forecast by Application, 2017 to 2032

Table 17: Latin America Market Value (US$ Million) Forecast by Country, 2017 to 2032

Table 18: Latin America Market Volume (MT) Forecast by Country, 2017 to 2032

Table 19: Latin America Market Value (US$ Million) Forecast by Purity, 2017 to 2032

Table 20: Latin America Market Volume (MT) Forecast by Purity, 2017 to 2032

Table 21: Latin America Market Value (US$ Million) Forecast by Solubility, 2017 to 2032

Table 22: Latin America Market Volume (MT) Forecast by Solubility, 2017 to 2032

Table 23: Latin America Market Value (US$ Million) Forecast by Application, 2017 to 2032

Table 24: Latin America Market Volume (MT) Forecast by Application, 2017 to 2032

Table 25: Europe Market Value (US$ Million) Forecast by Country, 2017 to 2032

Table 26: Europe Market Volume (MT) Forecast by Country, 2017 to 2032

Table 27: Europe Market Value (US$ Million) Forecast by Purity, 2017 to 2032

Table 28: Europe Market Volume (MT) Forecast by Purity, 2017 to 2032

Table 29: Europe Market Value (US$ Million) Forecast by Solubility, 2017 to 2032

Table 30: Europe Market Volume (MT) Forecast by Solubility, 2017 to 2032

Table 31: Europe Market Value (US$ Million) Forecast by Application, 2017 to 2032

Table 32: Europe Market Volume (MT) Forecast by Application, 2017 to 2032

Table 33: East Asia Market Value (US$ Million) Forecast by Country, 2017 to 2032

Table 34: East Asia Market Volume (MT) Forecast by Country, 2017 to 2032

Table 35: East Asia Market Value (US$ Million) Forecast by Purity, 2017 to 2032

Table 36: East Asia Market Volume (MT) Forecast by Purity, 2017 to 2032

Table 37: East Asia Market Value (US$ Million) Forecast by Solubility, 2017 to 2032

Table 38: East Asia Market Volume (MT) Forecast by Solubility, 2017 to 2032

Table 39: East Asia Market Value (US$ Million) Forecast by Application, 2017 to 2032

Table 40: East Asia Market Volume (MT) Forecast by Application, 2017 to 2032

Table 41: South Asia Market Value (US$ Million) Forecast by Country, 2017 to 2032

Table 42: South Asia Market Volume (MT) Forecast by Country, 2017 to 2032

Table 43: South Asia Market Value (US$ Million) Forecast by Purity, 2017 to 2032

Table 44: South Asia Market Volume (MT) Forecast by Purity, 2017 to 2032

Table 45: South Asia Market Value (US$ Million) Forecast by Solubility, 2017 to 2032

Table 46: South Asia Market Volume (MT) Forecast by Solubility, 2017 to 2032

Table 47: South Asia Market Value (US$ Million) Forecast by Application, 2017 to 2032

Table 48: South Asia Market Volume (MT) Forecast by Application, 2017 to 2032

Table 49: Oceania Market Value (US$ Million) Forecast by Country, 2017 to 2032

Table 50: Oceania Market Volume (MT) Forecast by Country, 2017 to 2032

Table 51: Oceania Market Value (US$ Million) Forecast by Purity, 2017 to 2032

Table 52: Oceania Market Volume (MT) Forecast by Purity, 2017 to 2032

Table 53: Oceania Market Value (US$ Million) Forecast by Solubility, 2017 to 2032

Table 54: Oceania Market Volume (MT) Forecast by Solubility, 2017 to 2032

Table 55: Oceania Market Value (US$ Million) Forecast by Application, 2017 to 2032

Table 56: Oceania Market Volume (MT) Forecast by Application, 2017 to 2032

Table 57: Middle East and Africa Market Value (US$ Million) Forecast by Country, 2017 to 2032

Table 58: Middle East and Africa Market Volume (MT) Forecast by Country, 2017 to 2032

Table 59: Middle East and Africa Market Value (US$ Million) Forecast by Purity, 2017 to 2032

Table 60: Middle East and Africa Market Volume (MT) Forecast by Purity, 2017 to 2032

Table 61: Middle East and Africa Market Value (US$ Million) Forecast by Solubility, 2017 to 2032

Table 62: Middle East and Africa Market Volume (MT) Forecast by Solubility, 2017 to 2032

Table 63: Middle East and Africa Market Value (US$ Million) Forecast by Application, 2017 to 2032

Table 64: Middle East and Africa Market Volume (MT) Forecast by Application, 2017 to 2032

List of Figures

Figure 01: Global Market Value (US$ Million) by Purity, 2022 to 2032

Figure 02: Global Market Value (US$ Million) by Solubility, 2022 to 2032

Figure 03: Global Market Value (US$ Million) by Application, 2022 to 2032

Figure 04: Global Market Value (US$ Million) by Region, 2022 to 2032

Figure 05: Global Market Value (US$ Million) Analysis by Region, 2017 to 2032

Figure 06: Global Market Volume (MT) Analysis by Region, 2017 to 2032

Figure 07: Global Market Value Share (%) and BPS Analysis by Region, 2022 to 2032

Figure 08: Global Market Y-o-Y Growth (%) Projections by Region, 2022 to 2032

Figure 09: Global Market Value (US$ Million) Analysis by Purity, 2017 to 2032

Figure 10: Global Market Volume (MT) Analysis by Purity, 2017 to 2032

Figure 11: Global Market Value Share (%) and BPS Analysis by Purity, 2022 to 2032

Figure 12: Global Market Y-o-Y Growth (%) Projections by Purity, 2022 to 2032

Figure 13: Global Market Value (US$ Million) Analysis by Solubility, 2017 to 2032

Figure 14: Global Market Volume (MT) Analysis by Solubility, 2017 to 2032

Figure 15: Global Market Value Share (%) and BPS Analysis by Solubility, 2022 to 2032

Figure 16: Global Market Y-o-Y Growth (%) Projections by Solubility, 2022 to 2032

Figure 17: Global Market Value (US$ Million) Analysis by Application, 2017 to 2032

Figure 18: Global Market Volume (MT) Analysis by Application, 2017 to 2032

Figure 19: Global Market Value Share (%) and BPS Analysis by Application, 2022 to 2032

Figure 20: Global Market Y-o-Y Growth (%) Projections by Application, 2022 to 2032

Figure 21: Global Market Attractiveness by Purity, 2022 to 2032

Figure 22: Global Market Attractiveness by Solubility, 2022 to 2032

Figure 23: Global Market Attractiveness by Application, 2022 to 2032

Figure 24: Global Market Attractiveness by Region, 2022 to 2032

Figure 25: North America Market Value (US$ Million) by Purity, 2022 to 2032

Figure 26: North America Market Value (US$ Million) by Solubility, 2022 to 2032

Figure 27: North America Market Value (US$ Million) by Application, 2022 to 2032

Figure 28: North America Market Value (US$ Million) by Country, 2022 to 2032

Figure 29: North America Market Value (US$ Million) Analysis by Country, 2017 to 2032

Figure 30: North America Market Volume (MT) Analysis by Country, 2017 to 2032

Figure 31: North America Market Value Share (%) and BPS Analysis by Country, 2022 to 2032

Figure 32: North America Market Y-o-Y Growth (%) Projections by Country, 2022 to 2032

Figure 33: North America Market Value (US$ Million) Analysis by Purity, 2017 to 2032

Figure 34: North America Market Volume (MT) Analysis by Purity, 2017 to 2032

Figure 35: North America Market Value Share (%) and BPS Analysis by Purity, 2022 to 2032

Figure 36: North America Market Y-o-Y Growth (%) Projections by Purity, 2022 to 2032

Figure 37: North America Market Value (US$ Million) Analysis by Solubility, 2017 to 2032

Figure 38: North America Market Volume (MT) Analysis by Solubility, 2017 to 2032

Figure 39: North America Market Value Share (%) and BPS Analysis by Solubility, 2022 to 2032

Figure 40: North America Market Y-o-Y Growth (%) Projections by Solubility, 2022 to 2032

Figure 41: North America Market Value (US$ Million) Analysis by Application, 2017 to 2032

Figure 42: North America Market Volume (MT) Analysis by Application, 2017 to 2032

Figure 43: North America Market Value Share (%) and BPS Analysis by Application, 2022 to 2032

Figure 44: North America Market Y-o-Y Growth (%) Projections by Application, 2022 to 2032

Figure 45: North America Market Attractiveness by Purity, 2022 to 2032

Figure 46: North America Market Attractiveness by Solubility, 2022 to 2032

Figure 47: North America Market Attractiveness by Application, 2022 to 2032

Figure 48: North America Market Attractiveness by Country, 2022 to 2032

Figure 49: Latin America Market Value (US$ Million) by Purity, 2022 to 2032

Figure 50: Latin America Market Value (US$ Million) by Solubility, 2022 to 2032

Figure 51: Latin America Market Value (US$ Million) by Application, 2022 to 2032

Figure 52: Latin America Market Value (US$ Million) by Country, 2022 to 2032

Figure 53: Latin America Market Value (US$ Million) Analysis by Country, 2017 to 2032

Figure 54: Latin America Market Volume (MT) Analysis by Country, 2017 to 2032

Figure 55: Latin America Market Value Share (%) and BPS Analysis by Country, 2022 to 2032

Figure 56: Latin America Market Y-o-Y Growth (%) Projections by Country, 2022 to 2032

Figure 57: Latin America Market Value (US$ Million) Analysis by Purity, 2017 to 2032

Figure 58: Latin America Market Volume (MT) Analysis by Purity, 2017 to 2032

Figure 59: Latin America Market Value Share (%) and BPS Analysis by Purity, 2022 to 2032

Figure 60: Latin America Market Y-o-Y Growth (%) Projections by Purity, 2022 to 2032

Figure 61: Latin America Market Value (US$ Million) Analysis by Solubility, 2017 to 2032

Figure 62: Latin America Market Volume (MT) Analysis by Solubility, 2017 to 2032

Figure 63: Latin America Market Value Share (%) and BPS Analysis by Solubility, 2022 to 2032

Figure 64: Latin America Market Y-o-Y Growth (%) Projections by Solubility, 2022 to 2032

Figure 65: Latin America Market Value (US$ Million) Analysis by Application, 2017 to 2032

Figure 66: Latin America Market Volume (MT) Analysis by Application, 2017 to 2032

Figure 67: Latin America Market Value Share (%) and BPS Analysis by Application, 2022 to 2032

Figure 68: Latin America Market Y-o-Y Growth (%) Projections by Application, 2022 to 2032

Figure 69: Latin America Market Attractiveness by Purity, 2022 to 2032

Figure 70: Latin America Market Attractiveness by Solubility, 2022 to 2032

Figure 71: Latin America Market Attractiveness by Application, 2022 to 2032

Figure 72: Latin America Market Attractiveness by Country, 2022 to 2032

Figure 73: Europe Market Value (US$ Million) by Purity, 2022 to 2032

Figure 74: Europe Market Value (US$ Million) by Solubility, 2022 to 2032

Figure 75: Europe Market Value (US$ Million) by Application, 2022 to 2032

Figure 76: Europe Market Value (US$ Million) by Country, 2022 to 2032

Figure 77: Europe Market Value (US$ Million) Analysis by Country, 2017 to 2032

Figure 78: Europe Market Volume (MT) Analysis by Country, 2017 to 2032

Figure 79: Europe Market Value Share (%) and BPS Analysis by Country, 2022 to 2032

Figure 80: Europe Market Y-o-Y Growth (%) Projections by Country, 2022 to 2032

Figure 81: Europe Market Value (US$ Million) Analysis by Purity, 2017 to 2032

Figure 82: Europe Market Volume (MT) Analysis by Purity, 2017 to 2032

Figure 83: Europe Market Value Share (%) and BPS Analysis by Purity, 2022 to 2032

Figure 84: Europe Market Y-o-Y Growth (%) Projections by Purity, 2022 to 2032

Figure 85: Europe Market Value (US$ Million) Analysis by Solubility, 2017 to 2032

Figure 86: Europe Market Volume (MT) Analysis by Solubility, 2017 to 2032

Figure 87: Europe Market Value Share (%) and BPS Analysis by Solubility, 2022 to 2032

Figure 88: Europe Market Y-o-Y Growth (%) Projections by Solubility, 2022 to 2032

Figure 89: Europe Market Value (US$ Million) Analysis by Application, 2017 to 2032

Figure 90: Europe Market Volume (MT) Analysis by Application, 2017 to 2032

Figure 91: Europe Market Value Share (%) and BPS Analysis by Application, 2022 to 2032

Figure 92: Europe Market Y-o-Y Growth (%) Projections by Application, 2022 to 2032

Figure 93: Europe Market Attractiveness by Purity, 2022 to 2032

Figure 94: Europe Market Attractiveness by Solubility, 2022 to 2032

Figure 95: Europe Market Attractiveness by Application, 2022 to 2032

Figure 96: Europe Market Attractiveness by Country, 2022 to 2032

Figure 97: East Asia Market Value (US$ Million) by Purity, 2022 to 2032

Figure 98: East Asia Market Value (US$ Million) by Solubility, 2022 to 2032

Figure 99: East Asia Market Value (US$ Million) by Application, 2022 to 2032

Figure 100: East Asia Market Value (US$ Million) by Country, 2022 to 2032

Figure 101: East Asia Market Value (US$ Million) Analysis by Country, 2017 to 2032

Figure 102: East Asia Market Volume (MT) Analysis by Country, 2017 to 2032

Figure 103: East Asia Market Value Share (%) and BPS Analysis by Country, 2022 to 2032

Figure 104: East Asia Market Y-o-Y Growth (%) Projections by Country, 2022 to 2032

Figure 105: East Asia Market Value (US$ Million) Analysis by Purity, 2017 to 2032

Figure 106: East Asia Market Volume (MT) Analysis by Purity, 2017 to 2032

Figure 107: East Asia Market Value Share (%) and BPS Analysis by Purity, 2022 to 2032

Figure 108: East Asia Market Y-o-Y Growth (%) Projections by Purity, 2022 to 2032

Figure 109: East Asia Market Value (US$ Million) Analysis by Solubility, 2017 to 2032

Figure 110: East Asia Market Volume (MT) Analysis by Solubility, 2017 to 2032

Figure 111: East Asia Market Value Share (%) and BPS Analysis by Solubility, 2022 to 2032

Figure 112: East Asia Market Y-o-Y Growth (%) Projections by Solubility, 2022 to 2032

Figure 113: East Asia Market Value (US$ Million) Analysis by Application, 2017 to 2032

Figure 114: East Asia Market Volume (MT) Analysis by Application, 2017 to 2032

Figure 115: East Asia Market Value Share (%) and BPS Analysis by Application, 2022 to 2032

Figure 116: East Asia Market Y-o-Y Growth (%) Projections by Application, 2022 to 2032

Figure 117: East Asia Market Attractiveness by Purity, 2022 to 2032

Figure 118: East Asia Market Attractiveness by Solubility, 2022 to 2032

Figure 119: East Asia Market Attractiveness by Application, 2022 to 2032

Figure 120: East Asia Market Attractiveness by Country, 2022 to 2032

Figure 121: South Asia Market Value (US$ Million) by Purity, 2022 to 2032

Figure 122: South Asia Market Value (US$ Million) by Solubility, 2022 to 2032

Figure 123: South Asia Market Value (US$ Million) by Application, 2022 to 2032

Figure 124: South Asia Market Value (US$ Million) by Country, 2022 to 2032

Figure 125: South Asia Market Value (US$ Million) Analysis by Country, 2017 to 2032

Figure 126: South Asia Market Volume (MT) Analysis by Country, 2017 to 2032

Figure 127: South Asia Market Value Share (%) and BPS Analysis by Country, 2022 to 2032

Figure 128: South Asia Market Y-o-Y Growth (%) Projections by Country, 2022 to 2032

Figure 129: South Asia Market Value (US$ Million) Analysis by Purity, 2017 to 2032

Figure 130: South Asia Market Volume (MT) Analysis by Purity, 2017 to 2032

Figure 131: South Asia Market Value Share (%) and BPS Analysis by Purity, 2022 to 2032

Figure 132: South Asia Market Y-o-Y Growth (%) Projections by Purity, 2022 to 2032

Figure 133: South Asia Market Value (US$ Million) Analysis by Solubility, 2017 to 2032

Figure 134: South Asia Market Volume (MT) Analysis by Solubility, 2017 to 2032

Figure 135: South Asia Market Value Share (%) and BPS Analysis by Solubility, 2022 to 2032

Figure 136: South Asia Market Y-o-Y Growth (%) Projections by Solubility, 2022 to 2032

Figure 137: South Asia Market Value (US$ Million) Analysis by Application, 2017 to 2032

Figure 138: South Asia Market Volume (MT) Analysis by Application, 2017 to 2032

Figure 139: South Asia Market Value Share (%) and BPS Analysis by Application, 2022 to 2032

Figure 140: South Asia Market Y-o-Y Growth (%) Projections by Application, 2022 to 2032

Figure 141: South Asia Market Attractiveness by Purity, 2022 to 2032

Figure 142: South Asia Market Attractiveness by Solubility, 2022 to 2032

Figure 143: South Asia Market Attractiveness by Application, 2022 to 2032

Figure 144: South Asia Market Attractiveness by Country, 2022 to 2032

Figure 145: Oceania Market Value (US$ Million) by Purity, 2022 to 2032

Figure 146: Oceania Market Value (US$ Million) by Solubility, 2022 to 2032

Figure 147: Oceania Market Value (US$ Million) by Application, 2022 to 2032

Figure 148: Oceania Market Value (US$ Million) by Country, 2022 to 2032

Figure 149: Oceania Market Value (US$ Million) Analysis by Country, 2017 to 2032

Figure 150: Oceania Market Volume (MT) Analysis by Country, 2017 to 2032

Figure 151: Oceania Market Value Share (%) and BPS Analysis by Country, 2022 to 2032

Figure 152: Oceania Market Y-o-Y Growth (%) Projections by Country, 2022 to 2032

Figure 153: Oceania Market Value (US$ Million) Analysis by Purity, 2017 to 2032

Figure 154: Oceania Market Volume (MT) Analysis by Purity, 2017 to 2032

Figure 155: Oceania Market Value Share (%) and BPS Analysis by Purity, 2022 to 2032

Figure 156: Oceania Market Y-o-Y Growth (%) Projections by Purity, 2022 to 2032

Figure 157: Oceania Market Value (US$ Million) Analysis by Solubility, 2017 to 2032

Figure 158: Oceania Market Volume (MT) Analysis by Solubility, 2017 to 2032

Figure 159: Oceania Market Value Share (%) and BPS Analysis by Solubility, 2022 to 2032

Figure 160: Oceania Market Y-o-Y Growth (%) Projections by Solubility, 2022 to 2032

Figure 161: Oceania Market Value (US$ Million) Analysis by Application, 2017 to 2032

Figure 162: Oceania Market Volume (MT) Analysis by Application, 2017 to 2032

Figure 163: Oceania Market Value Share (%) and BPS Analysis by Application, 2022 to 2032

Figure 164: Oceania Market Y-o-Y Growth (%) Projections by Application, 2022 to 2032

Figure 165: Oceania Market Attractiveness by Purity, 2022 to 2032

Figure 166: Oceania Market Attractiveness by Solubility, 2022 to 2032

Figure 167: Oceania Market Attractiveness by Application, 2022 to 2032

Figure 168: Oceania Market Attractiveness by Country, 2022 to 2032

Figure 169: Middle East and Africa Market Value (US$ Million) by Purity, 2022 to 2032

Figure 170: Middle East and Africa Market Value (US$ Million) by Solubility, 2022 to 2032

Figure 171: Middle East and Africa Market Value (US$ Million) by Application, 2022 to 2032

Figure 172: Middle East and Africa Market Value (US$ Million) by Country, 2022 to 2032

Figure 173: Middle East and Africa Market Value (US$ Million) Analysis by Country, 2017 to 2032

Figure 174: Middle East and Africa Market Volume (MT) Analysis by Country, 2017 to 2032

Figure 175: Middle East and Africa Market Value Share (%) and BPS Analysis by Country, 2022 to 2032

Figure 176: Middle East and Africa Market Y-o-Y Growth (%) Projections by Country, 2022 to 2032

Figure 177: Middle East and Africa Market Value (US$ Million) Analysis by Purity, 2017 to 2032

Figure 178: Middle East and Africa Market Volume (MT) Analysis by Purity, 2017 to 2032

Figure 179: Middle East and Africa Market Value Share (%) and BPS Analysis by Purity, 2022 to 2032

Figure 180: Middle East and Africa Market Y-o-Y Growth (%) Projections by Purity, 2022 to 2032

Figure 181: Middle East and Africa Market Value (US$ Million) Analysis by Solubility, 2017 to 2032

Figure 182: Middle East and Africa Market Volume (MT) Analysis by Solubility, 2017 to 2032

Figure 183: Middle East and Africa Market Value Share (%) and BPS Analysis by Solubility, 2022 to 2032

Figure 184: Middle East and Africa Market Y-o-Y Growth (%) Projections by Solubility, 2022 to 2032

Figure 185: Middle East and Africa Market Value (US$ Million) Analysis by Application, 2017 to 2032

Figure 186: Middle East and Africa Market Volume (MT) Analysis by Application, 2017 to 2032

Figure 187: Middle East and Africa Market Value Share (%) and BPS Analysis by Application, 2022 to 2032

Figure 188: Middle East and Africa Market Y-o-Y Growth (%) Projections by Application, 2022 to 2032

Figure 189: Middle East and Africa Market Attractiveness by Purity, 2022 to 2032

Figure 190: Middle East and Africa Market Attractiveness by Solubility, 2022 to 2032

Figure 191: Middle East and Africa Market Attractiveness by Application, 2022 to 2032

Figure 192: Middle East and Africa Market Attractiveness by Country, 2022 to 2032

Frequently Asked Questions

How big is the quinoline yellow WS market?

The quinoline yellow WS market is set to be valued at nearly USD 28.5 Million in 2022.

How much share did the ice-cream industry generate in the quinoline yellow WS market?

The ice cream industry generated a 3% of share the quinolone yellow WS market in 2021.

At what rate will the quinoline yellow WS market grow in Japan?

The Japan quinoline yellow WS market exhibited sales of 222 metric tons in 2021 and is expected to grow at 2.9% CAGR between 2022 and 2032.

What is the China quinoline yellow WS market outlook?

The China quinoline yellow WS market is likely to register a 3.9% CAGR during the forecast period of 2022 and 2032.

How is the India quinoline yellow WS market faring?

The India quinoline yellow WS market showcased sales of over 83.6 metric tons in 2021.

Explore Similar Insights

Future Market Insights

Quinoline Yellow WS Market