
- Market Size (2026)
- USD 99.2 Mn
- Forecast (2036)
- USD 148.3 Mn
- CAGR (2026 to 2036)
- 4.1%
How big is Quinolones Market in 2026?
Starting from USD 95.5 million in 2025, the quinolones market valuation advanced to USD 99.2 million in 2026, with projections pointing toward USD 148.3 million by 2036 at a CAGR of 4.1%.
Stricter hospital prescribing rules on systemic antibiotics have shifted quinolones demand away from routine clinic visits toward complex kidney infections and eye surgery drops. Global quinolones valuation stood at USD 95.5 million in 2025 before reaching USD 99.2 million in 2026. Forecast models set 2036 industry valuation at USD 148.3 million under a 4.1% compound annual growth rate. Second-generation ciprofloxacin and ofloxacin hold 36.8% of 2026 demand because hospitals rely on these affordable tablets and infusions to clear severe Gram-negative urinary infections. This hospital reserve role separates specialty quinolone procurement from broader urinary tract infection therapeutics sold in community pharmacies. FMI industry evaluation indicates that mandatory safety warnings on tendon side effects and tighter active ingredient impurity checks continue to squeeze generic supplier margins.
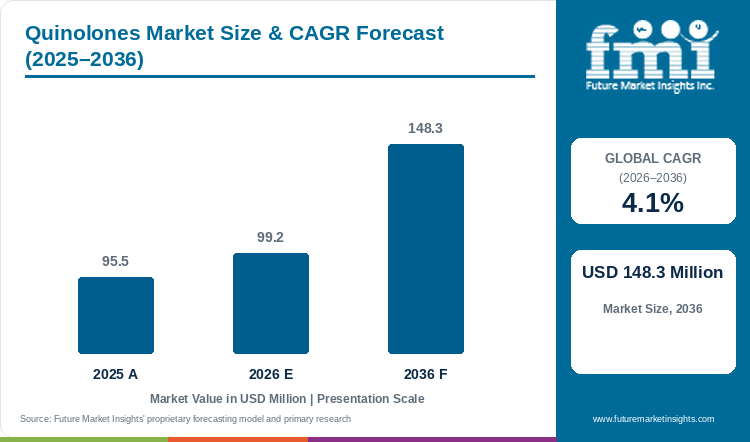
Key Market Trends & Insights
- By drug generation: Second-Generation Ciprofloxacin and Ofloxacin hold a 36.8% share in 2026 because established renal tissue penetration supports acute Gram-negative hospital protocols.
- By route of administration: Oral Solid Tablets represent 48.9% in 2026 as high oral bioavailability enables early inpatient discharge and outpatient continuation therapy.
- By clinical indication: Complex Urinary Tract Infections and Pyelonephritis account for 44.3% in 2026 since ascending renal infections require bactericidal urine concentrations.
- By formulation type: Generic Multi-Source Formulations secure 68.4% in 2026 through consolidated group purchasing organization tenders across hospital networks.
- By distribution channel: Hospital and Acute Care Pharmacies command 46.5% in 2026 as antimicrobial stewardship committees gate systemic fluoroquinolone dispensing.
Regional Highlights
- Top national expansion: The United States leads country growth projections at a 4.9% CAGR through 2036 via branded MRSA-active delafloxacin adoption and surgical prophylaxis drops.
- Broader country progression: Canada tracks at a 4.5% CAGR ahead of South Korea at 4.3% and Australia at 4.2%, supported by outpatient parenteral step-down guidelines.
Market Size & Forecast
Table 1: Market Size and Forecast for the Quinolones Market (USD million and CAGR percentage), 2025 to 2036
| Metric | Value |
|---|---|
| 2025 Market Size | USD 95.5 million |
| Estimated Market Size in 2026 | USD 99.2 million |
| Projected Market Size by 2036 | USD 148.3 million |
| CAGR, 2026 to 2036 | 4.1% |
| Added Value, 2026 to 2036 | USD 49.1 million |
Higher hospital admissions for drug-resistant bladder and kidney infections are forcing healthcare providers to rethink how they manage inpatient bed capacity. When standard first-line antibiotics fail to clear bacteria quickly, patients stay in hospital beds longer and treatment costs climb. A February 2026 clinical outcomes study in Frontiers in Pharmacology showed that switching complicated urinary tract infection patients from intravenous infusions to oral fluoroquinolones allows faster hospital discharge without raising relapse rates. Hospital pharmacy buyers therefore coordinate reserve quinolone orders with uncomplicated bladder infection regimens so doctors save broad-spectrum tablets for high-risk cases.
Defined-Daily-Dose and Active-Regimen Sizing
Table 2: Defined-Daily-Dose and Regimen Sizing for the Quinolones Market (USD million and clinical ranges), 2025 to 2036
| Metric | 2025 | 2026 | 2036 |
|---|---|---|---|
| Market size (USD million) | 95.5 | 99.2 | 148.3 |
| Hospital & specialty treatment courses (million regimens) | 18.4 to 20.6 | 19.1 to 21.4 | 27.5 to 30.8 |
| Active quinolone API volume in specialty scope (metric tons) | 410.0 to 455.0 | 426.0 to 472.0 | 615.0 to 680.0 |
| Average institutional realization per course (USD) | 4.6 to 5.2 | 4.6 to 5.2 | 4.8 to 5.4 |
Operational note on dosing ranges reflects standard 500 to 1,000 mg daily oral ciprofloxacin or 400 to 750 mg levofloxacin hospital courses.
Hospital purchasing groups face constant pressure to lower inpatient treatment costs while keeping intensive care units free of resistant bacteria. If a patient receives an under-dosed antibiotic course, surviving bacteria mutate quickly and render standard ward stock ineffective. Procurement pharmacists address this risk by bundling high-strength oral tablets and sterile infusion bags with urinary antibacterial pharmaceuticals under multi-year supply contracts. This purchasing strategy guarantees uninterrupted stock for urology and respiratory wards during seasonal infection spikes.
Per Capita & Hospital Pharmacy Line Sizing
Table 3: Per Capita and Hospital Formulary Indicators for the Quinolones Market (USD), 2025 to 2036
| Metric | 2025 | 2026 | 2036 |
|---|---|---|---|
| World population (billion) | 8.2 | 8.3 | 9.0 |
| Valuation per 1,000 people (USD) | 11.6 | 12.0 | 16.5 |
| Annual procurement per acute hospital pharmacy (USD thousand) | 2.8 to 3.3 | 2.9 to 3.4 | 4.2 to 4.9 |
| Fourth-generation & novel delafloxacin share (%) | 30.5% to 31.5% | 31.5% to 32.5% | 38.0% to 41.0% |
Table 4: Institutional Pharmacy & Channel Valuation Indicators for the Quinolones Market (USD and percentages), 2026
| Metric | Value | Institutional Reference Basis |
|---|---|---|
| Market size, 2026 | USD 99.2 million | 2026 global valuation baseline |
| Acute hospital & ophthalmic surgery centers global | 32,500 facilities | Inpatient urology, respiratory & eye surgery centers |
| Market valuation per facility | USD 3,052.3 | Annualized specialty quinolone procurement |
| Hospital and Acute Care Pharmacies value, 2026 | USD 46.1 million | 46.5% distribution channel allocation |
Early patient discharge programs have become a major financial priority for hospital administrators seeking to reduce nursing workload and intravenous line infections. Oral fluoroquinolone tablets absorb almost completely in the digestive tract, allowing doctors to switch recovering patients from intravenous drips to take-home pills within 48 hours. Formulary committees evaluate dissolution performance across oral solid dosage tablets before selecting generic manufacturers for national hospital tenders.
Analyst Perspective
"Hospital pharmacy directors no longer purchase fluoroquinolones as high-volume primary care commodities. They procure guaranteed Gram-negative tissue penetration for complicated pyelonephritis and pseudomonal respiratory exacerbations alongside sterile ophthalmic surgery prophylaxis. Manufacturers that combine verified nitrosamine-free active pharmaceutical ingredient dossiers with ready-to-infuse premix bags and novel anionic molecules will secure premium institutional formulary tiers through 2036."
- Nandini Roy Choudhury, Principal Consultant, Future Market Insights.
How is the quinolones market segmented?
The quinolones market is segmented by drug generation, route of administration, clinical indication, formulation type, and distribution channel. In 2026, Second-Generation Ciprofloxacin and Ofloxacin is projected at 36.8%, Oral Solid Tablets at 48.9%, Complex Urinary Tract Infections and Pyelonephritis at 44.3%, Generic Multi-Source Formulations at 68.4%, and Hospital and Acute Care Pharmacies at 46.5%.
By drug generation: Second-Generation Ciprofloxacin and Ofloxacin with Third-Generation Levofloxacin alongside Fourth-Generation Moxifloxacin and Gemifloxacin and Novel Delafloxacin.
By route of administration: Oral Solid Tablets and Intravenous Infusion Solution alongside Ophthalmic and Otic Drops Solution.
By clinical indication: Complex Urinary Tract Infections and Pyelonephritis with Community-Acquired Pneumonia and Bronchitis alongside Complicated Intra-Abdominal Infections and Bacterial Conjunctivitis and Otitis Externa.
By formulation type: Generic Multi-Source Formulations and Branded and Patented Formulations.
By distribution channel: Hospital and Acute Care Pharmacies and Retail and Community Pharmacies alongside Specialty and Ophthalmic Clinics and Online and Mail-Order Pharmacies.
Why does Second-Generation Ciprofloxacin and Ofloxacin lead the drug generation category?
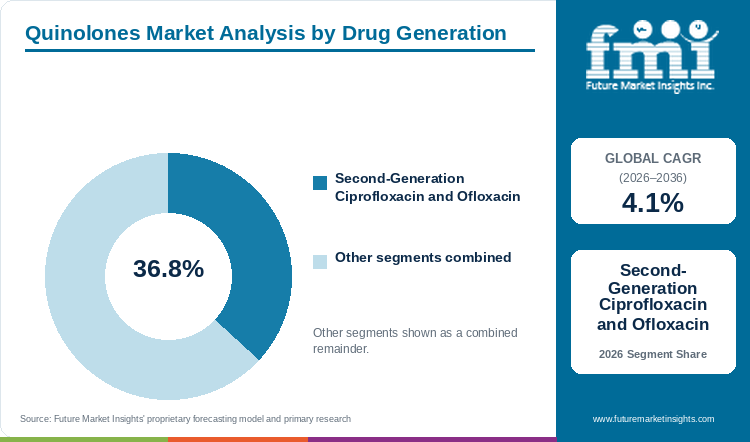
Second-Generation Ciprofloxacin and Ofloxacin hold an estimated 36.8% of drug generation demand in 2026, anchored by broad Gram-negative activity across hospital urology and enteric protocols.
Table 5: Drug Generation Share for the Quinolones Market (percentage share), 2026
| Drug Generation | Share (2026) |
|---|---|
| Second-Generation Ciprofloxacin and Ofloxacin | 36.8% |
| Other Segments Combined | 63.2%* |
| Total | 100.0% |
*Note that remaining drug generation categories account for the balance of 2026 global quinolones demand.
Table 6: Drug Generation Leadership and Market Growth for the Quinolones Market (segment and CAGR percentage), 2026 to 2036
| Metric | Value |
|---|---|
| Global CAGR (2026 to 2036) | 4.1% |
| Leading Segment | Second-Generation Ciprofloxacin and Ofloxacin |
High patient volumes in hospital urology wards and outpatient clinics sustain steady demand for second-generation ciprofloxacin and ofloxacin. These medicines concentrate heavily in urine and kidney tissue, which helps doctors clear stubborn Gram-negative infections when basic penicillins fail. Generic manufacturers also pair bulk tablet production with antibiotic active pharmaceutical ingredients to keep per-course hospital tender prices competitive across developing and developed markets.
- Second-Generation Ciprofloxacin and Ofloxacin hold 36.8% of drug generation value in 2026 because broad Gram-negative coverage and low per-tablet production cost anchor hospital formulary tenders.
- A May 2025 clinical meta-analysis in the Journal of Chemotherapy confirmed that ciprofloxacin and levofloxacin deliver high bacterial eradication rates across complicated urological infections.
What sustains Oral Solid Tablets leadership in the route of administration segment?
Oral Solid Tablets represent 48.9% of the route of administration category in 2026, supported by high oral bioavailability and inpatient-to-outpatient step-down protocols.
Hospital focus on outpatient recovery and home-based care directly supports the dominance of oral solid tablets. Because film-coated quinolone tablets reach blood concentrations similar to intravenous drips, physicians can send stable pneumonia and kidney infection patients home on a five-day blister pack. Hospital buyers frequently stock these oral regimens beside macrolide antibacterial formulations to cover both typical and atypical respiratory infections.
- Oral Solid Tablets represent 48.9% of the route of administration segment in 2026 as high gastrointestinal absorption supports early hospital discharge protocols.
- A February 2025 clinical evaluation in Médecine et Maladies Infectieuses covering 2,272 patients confirmed strong clinical cure rates and tolerability for oral and parenteral levofloxacin regimens.
How do Complex Urinary Tract Infections and Pyelonephritis lead the clinical indication category?
Complex Urinary Tract Infections and Pyelonephritis account for 44.3% of clinical indication volume in 2026, driven by renal tubular drug concentration and Gram-negative bactericidal clearance.
Older inpatient demographics and higher rates of catheter use in hospitals are driving steady increases in complicated urinary tract and kidney infections. Unlike simple bladder infections that respond to mild antiseptics, ascending kidney infections require fast-acting bactericidal drugs that prevent bloodstream sepsis. Hospital clinicians balance these urological protocols against bacterial pneumonia treatment protocols when managing ward antibiotic budgets.
- Complex Urinary Tract Infections and Pyelonephritis account for 44.3% of clinical indication demand in 2026 because glomerular filtration concentrates active drug directly at the infection site.
- A December 2025 clinical surveillance study in Pathogens documented diverging ciprofloxacin susceptibility between community and hospital urinary tract isolates, reinforcing the need for culture-guided hospital therapy.
Why do Generic Multi-Source Formulations lead the formulation type category?
Generic Multi-Source Formulations secure 68.4% of formulation type value in 2026, supported by multi-year hospital group purchasing organization tenders.
Budget constraints across public health systems and hospital networks keep generic multi-source formulations at the center of procurement tenders. Patent expirations on ciprofloxacin and levofloxacin as well as moxifloxacin allow generic producers to supply pre-diluted infusion bags and unit-dose tablets at a fraction of originator prices.
- Generic Multi-Source Formulations secure 68.4% of formulation type demand in 2026 as public health ministries and hospital networks prioritize cost-effective WHO Watch-list antibacterial supply.
- In June 2025, Hikma Pharmaceuticals updated its United States hospital injectable catalog covering sterile ciprofloxacin and levofloxacin as well as moxifloxacin infusion formulations for acute care wards.
What gives Hospital and Acute Care Pharmacies the leading position in distribution channel?
Hospital and Acute Care Pharmacies command 46.5% of distribution channel share in 2026, anchored by inpatient antimicrobial stewardship gating.
Government safety restrictions on outpatient antibiotic scripts have concentrated quinolone sales inside hospital and acute care pharmacies. Because retail doctors now avoid prescribing fluoroquinolones for mild sinus or throat infections, manufacturers focus their sales teams on hospital infectious-disease committees.
- Hospital and Acute Care Pharmacies capture 46.5% of channel demand during 2026 since inpatient antimicrobial stewardship teams control parenteral and reserve oral dispensing.
- A November 2025 urology stewardship review in Eur. Urol. Focus confirmed that restricting empirical outpatient scripts preserves fluoroquinolone effectiveness for severe hospital urology cases.
What are the growth drivers and restraints alongside opportunities in the quinolones market?
In the quinolones market, complicated Gram-negative urinary infections and IV-to-oral hospital switch programs drive adoption whereas FDA and EMA boxed warnings restrain empirical community use and fourth-generation ophthalmic drops generate specialty growth.
- Driver: Elevated prevalence of complicated catheter-associated urinary tract infections and multidrug-resistant skin infections sustains demand for bactericidal hospital and step-down fluoroquinolones.
- Restraint: Stringent FDA and EMA pharmacovigilance boxed warnings alongside rising bacterial gyrA and parC target mutations limit first-line outpatient prescriptions.
- Opportunity: Fourth-generation ophthalmic surgery prophylaxis drops and novel anionic delafloxacin regimens for MRSA skin and respiratory infections generate high-margin specialty growth.
Growth Analysis and Future Potential: Qualitative Demand Drivers
Hospital admissions for methicillin-resistant Staphylococcus aureus skin infections and severe bacterial pneumonia are creating new demand for fourth-generation and novel anionic quinolones. Older antibiotics often lose potency inside acidic abscess fluid, which leads to treatment failure and repeat surgery. Data presented in October 2025 in Open Forum Infectious Diseases showed that oral and intravenous delafloxacin maintains potent bactericidal activity against resistant Gram-positive and Gram-negative hospital pathogens across more than 50 countries. Hospital formulary teams also evaluate broad-spectrum tetracycline therapies when building reserve protocols for complex skin and chest infections.
Risk Assessment of the Quinolones Market: Operational and Formulation Friction
Strict pharmacovigilance warnings on tendon rupture and nerve damage remain the biggest factor holding back volume growth in retail pharmacies. Health authorities in North America and Europe require prominent boxed warnings on systemic fluoroquinolone packages, which discourages family doctors from writing routine prescriptions. A February 2025 population cohort study in Infection confirmed elevated risks of serious adverse reactions in younger outpatient cohorts, reinforcing regulatory limits on non-essential prescribing. Accordingly, outpatient clinics switch mild eye and ear infections toward localized ocular anti-infective drops that avoid systemic bloodstream exposure.
Commercial Opportunity Analysis: Formulation Differentiation and Value-Add Formats
Rapid growth in outpatient cataract and refractive eye surgeries is opening a lucrative commercial avenue for sterile ophthalmic quinolone drops and intracameral injections. Eye surgeons need fast-acting topical antibiotics that sterilize the ocular surface before incision without irritating corneal tissue. Clinical results published in January 2026 in Frontiers in Medicine demonstrated that intracameral and topical moxifloxacin prophylaxis sharply reduces post-operative endophthalmitis rates in cataract surgery patients. Specialty pharma manufacturers are expanding their sterile ophthalmic eye drops portfolios to win supply contracts with ambulatory eye surgery centers.
Quinolones Market by Country (2026 to 2036)
Country-level projections show the United States pacing quinolones demand at a 4.9% CAGR through 2036, whereas France records a 3.5% rate under outpatient stewardship.
Table 7: Country CAGR and Primary Growth Levers for the Quinolones Market (CAGR percentage and operational drivers), 2026 to 2036
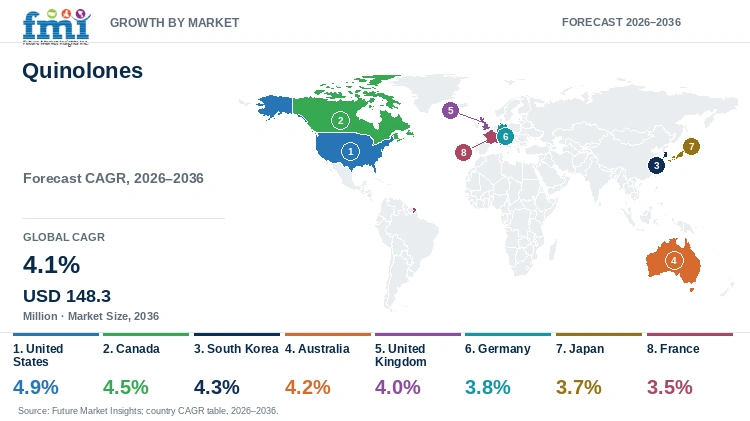
| Country | CAGR (2026 to 2036) | Primary Growth Lever |
|---|---|---|
| United States | 4.9% | Branded MRSA-active delafloxacin adoption and ambulatory cataract surgery prophylaxis |
| Canada | 4.5% | Provincial hospital tender consolidation and parenteral-to-oral pyelonephritis protocols |
| South Korea | 4.3% | Domestic fourth-generation gemifloxacin synthesis and tertiary ophthalmic surgery volume |
| Australia | 4.2% | Strict PBS authority stewardship preserving hospital Gram-negative susceptibility |
| United Kingdom | 4.0% | NHS hospital susceptibility-guided prescribing and high-volume cataract surgical hubs |
| Germany | 3.8% | University hospital stewardship consultations and statutory insurance specialty tenders |
| Japan | 3.7% | Super-aged respiratory and urological care with topical 1.5% levofloxacin eye drops |
| France | 3.5% | ANSM unit-dose dispensing controls and inpatient urological care protocols |
Source: Future Market Insights analysis
United States Quinolones Market Outlook (2026 to 2036)
Hospital demand in the United States advances at a 4.9% CAGR through 2036, supported by inpatient intravenous-to-oral switch programs and high cataract surgery volumes across outpatient eye clinics. While retail pharmacies fill fewer ciprofloxacin scripts for simple bladder infections due to FDA safety warnings, acute care hospitals are increasing orders for branded delafloxacin and ready-to-hang levofloxacin infusion bags. In August 2026, the CDC reported emerging ciprofloxacin non-susceptibility in enteric Salmonella Enteritidis strains across the United States, prompting hospitals to expand rapid susceptibility testing before prescribing. Group purchasing organizations across the country also lock in multi-year contracts for preservative-free moxifloxacin eye drops and barcoded unit-dose hospital blisters.
Key takeaway: Across the United States, hospital IV-to-oral switch pathways and ambulatory ophthalmic surgery prophylaxis sustain a leading 4.9% CAGR.
Canada Quinolones Market Outlook (2026 to 2036)
Unlike the private insurance hospital market in the United States, Canada channels antibiotic purchasing through consolidated provincial group tenders at a 4.5% CAGR from 2026 to 2036. Provincial stewardship committees limit routine community fluoroquinolone dispensing so oral and intravenous ciprofloxacin and levofloxacin remain effective for acute kidney infections and cystic fibrosis lung care. Findings from the November 2025 Public Health Agency of Canada priority antimicrobial resistance assessment showed that hospital surveillance programs across provinces in Canada helped contain resistant bloodstream infections. Hospital pharmacies in Ontario and Quebec steadily favor pre-mixed intravenous bags and unit-dose tablet packs that cut ward nursing preparation time and prevent medication errors.
Key takeaway: In Canada, provincial hospital tender consolidation and acute pyelonephritis step-down protocols are expected to support a 4.5% CAGR through 2036.
South Korea Quinolones Market Outlook (2026 to 2036)
South Korea is forecast to record a 4.3% CAGR between 2026 and 2036, propelled by high cataract surgery volumes in urban eye hospitals and strong domestic manufacturing of fourth-generation quinolones. Unlike Western countries that rely heavily on imported generics, pharmaceutical firms in South Korea produce proprietary gemifloxacin tablets and concentrated moxifloxacin eye drops for local and regional hospital accounts. A December 2025 multicenter study in JKMS found that hospital antibiotic stewardship programs in South Korea reshaped urinary pathogen resistance patterns after the pandemic. Older urban populations in Seoul and Busan continue to drive strong outpatient demand for surgical eye drops across specialty eye clinics.
Key takeaway: In South Korea, domestic fourth-generation formulation manufacturing and high ophthalmic surgical volume are forecast to drive a 4.3% CAGR.
Australia Quinolones Market Outlook (2026 to 2036)
Australia tracks at a 4.2% CAGR through 2036 because strict Pharmaceutical Benefits Scheme authority restrictions reserve systemic fluoroquinolones for confirmed resistant bacterial infections. Because general practitioners in Australia cannot prescribe oral ciprofloxacin or norfloxacin without streamlined authority codes, national consumption exhibits lower baseline resistance than peer Asia-Pacific healthcare markets. According to the August 2025 Australia Commission on Safety and Quality in Health Care AURA surveillance update, conserved fluoroquinolone susceptibility preserves clinical efficacy in hospital sepsis and complicated urological cases. Public and private tertiary hospital pharmacies across New South Wales and Victoria as well as Queensland maintain dedicated intravenous moxifloxacin and ciprofloxacin reserve stocks for penicillin-allergic surgical patients nationwide.
Key takeaway: In Australia, strict PBS authority gating preserves hospital fluoroquinolone efficacy and supports steady 4.2% CAGR progression through 2036.
United Kingdom Quinolones Market Outlook (2026 to 2036)
Across the United Kingdom, secondary-care demand advances at a 4.0% CAGR from 2026 to 2036 under NHS England hospital prescribing guidelines. Updated MHRA safety rules require doctors to confirm bacterial susceptibility or document why other antibiotics cannot be used before prescribing systemic fluoroquinolones. Meanwhile, specialized respiratory centers in the United Kingdom are adopting fourth-generation agents for difficult lung infections. A July 2025 clinical study in the Journal of Cystic Fibrosis from London respiratory specialists showed that combining oral and intravenous delafloxacin helps clear stubborn Pseudomonas aeruginosa airway infections. High-volume NHS cataract surgical hubs across England also drive steady orders for single-use moxifloxacin eye drops.
Key takeaway: Across the United Kingdom, NHS hospital susceptibility-guided prescribing and ophthalmic surgical hub expansion support a 4.0% CAGR.
Germany Quinolones Market Outlook (2026 to 2036)
Whereas the United Kingdom centralizes hospital buying through national NHS tenders, Germany relies on statutory health insurance discount contracts that support a 3.8% CAGR through 2036. Federal pharmacovigilance alerts in Germany have curbed routine outpatient fluoroquinolone scripts for winter colds and bronchitis, shifting sales toward hospital urology wards and specialty eye and ear clinics. A May 2025 health insurance claims analysis in GMS Infectious Diseases confirmed a marked decline in unnecessary outpatient respiratory fluoroquinolone prescriptions across medical practices in Germany. Domestic suppliers led by Bayer and Sandoz continue to capture steady hospital and Apotheke demand for complex urinary tablets and sterile ophthalmic solutions nationwide.
Key takeaway: In Germany, university hospital stewardship consultations and statutory health insurance specialty tenders are slated to sustain a 3.8% CAGR.
Japan Quinolones Market Outlook (2026 to 2036)
Hospital demand in Japan advances at a 3.7% CAGR between 2026 and 2036, backed by a rapidly aging patient population and a strong domestic track record in quinolone drug discovery. Pharmaceutical innovators in Japan developed levofloxacin and ofloxacin as well as sitafloxacin, giving domestic doctors wide dosing flexibility for elderly pneumonia and kidney infection patients. An August 2025 national review in Antibiotics documented how antimicrobial stewardship targets in Japan have curbed empirical outpatient oral fluoroquinolone use while maintaining hospital treatment access for resistant urinary infections. Ophthalmology clinics in Tokyo and Osaka also generate high repeat orders for 1.5% levofloxacin and moxifloxacin surgical eye drops across outpatient centers.
Key takeaway: In Japan, super-aged respiratory and urological inpatient care alongside high-concentration ophthalmic drop usage are predicted to sustain a 3.7% CAGR.
France Quinolones Market Outlook (2026 to 2036)
France registers a 3.5% CAGR from 2026 to 2036 as ANSM dispensing controls and computerized hospital decision-support rules tightly regulate outpatient fluoroquinolone antibiotic scripts. Community pharmacies in France dispense exact unit-count antibiotic packs following rapid diagnostic testing, which eliminates surplus household tablet inventory while protecting hospital-grade bactericidal efficacy. According to the November 2025 Santé publique France antibiotic consumption surveillance bulletin, inpatient urology and intensive care units remain the primary institutional buyers of parenteral and oral ciprofloxacin and ofloxacin. Private ambulatory ophthalmology surgery practices and regional otolaryngology clinics across Paris and Lyon as well as Marseille further support steady institutional procurement of combination quinolone anti-inflammatory drops for post-surgical care.
Key takeaway: In France, ANSM stewardship gating and inpatient urological care alongside specialty ophthalmic dispensing are likely to support a 3.5% CAGR.
Full report country CAGRs cover North America and Latin America alongside Western Europe and Eastern Europe. Additional regional coverage spans East Asia and South Asia and Pacific alongside Middle East and Africa.
Who are the notable companies in the quinolones market?
Bayer AG, Daiichi Sankyo Company, Limited, Novartis AG, Hikma Pharmaceuticals PLC, Melinta Therapeutics, LLC, Bausch + Lomb Corporation, Cipla Limited, Merck & Co., Inc., Sanofi SA, and AstraZeneca plc are the notable companies in the quinolones market.
Competitive positioning in the quinolones industry separates originator pharmaceutical innovators and high-volume generic injectable and oral tablet manufacturers alongside specialized ophthalmic anti-infective formulators.
- Originator and Branded Antibacterial Innovators: Bayer AG and Daiichi Sankyo Company Limited alongside Melinta Therapeutics LLC and Merck & Co. Inc. hold foundational fluoroquinolone patents and global clinical dossiers.
- Global Generic Injectable and Oral Manufacturers: Novartis AG and Hikma Pharmaceuticals PLC alongside Cipla Limited and Sanofi SA operate vertically integrated active ingredient synthesis and sterile hospital vial and tablet networks.
- Ophthalmic and Specialty Anti-Infective Formulators: Bausch + Lomb Corporation and AstraZeneca plc supply specialized fourth-generation ocular suspensions and hospital acute-care antibacterial portfolios.
Competitive Benchmarking: Quinolones Market
Table 8: Competitive Benchmarking for the Quinolones Market (qualitative capability ratings), 2026
| Company | Molecular Generation Breadth | Hospital Tender Reach | Ophthalmic & IV Format Fit | Geographic Reach |
|---|---|---|---|---|
| Bayer AG | High | High | High | Global originator of Cipro and Avelox; EUR 327M 2025 franchise valuation |
| Daiichi Sankyo Company, Limited | High | High | High | Japan and Asia-Pacific leader in Cravit levofloxacin, Tarivid, and Cravit ophthalmic |
| Novartis AG | High | High | High | Global hospital anti-infective heritage and ophthalmic Vigamox distribution network |
| Hikma Pharmaceuticals PLC | High | High | High | North America, Europe, and MENA sterile injectable and oral hospital generics |
| Melinta Therapeutics, LLC | Medium | High | High | United States and continental acute-care portfolio led by Baxdela delafloxacin |
| Bausch + Lomb Corporation | Medium | Medium | High | Global ophthalmic surgical prophylaxis leader supplying Besivance besifloxacin |
| Cipla Limited | High | High | High | India, North America, and Africa vertically integrated API and hospital formulations |
| Merck & Co., Inc. | Medium | High | Medium | Global hospital acute-care antibacterial clinical and distribution network |
| Sanofi SA | High | High | Medium | Europe, Latin America, and emerging-market Tarivid and generic hospital supply |
| AstraZeneca plc | Medium | High | Medium | Global acute-care hospital infectious disease and respiratory network |
Capability ratings evaluate documented quinolone molecular breadth and hospital injectable and oral step-down tender coverage alongside ophthalmic delivery formats and multi-region regulatory compliance.
Key Developments in the Quinolones Market
- Sandoz Group AG reported in its January 2026 Integrated Annual Report that 2025 net valuation reached USD 11.09 billion, driven by expanded anti-infective generic supply across Europe and North America.
- Bausch + Lomb Corporation announced on February 18, 2026 that full-year 2025 valuation reached USD 5.101 billion, supported by ophthalmic pharmaceuticals including Besivance besifloxacin eye drops.
- Sandoz Group AG documented in its February 2026 Business Report new vertically integrated antibiotic fermentation and tablet packaging investments in Kundl, Austria to secure regional supply.
Key Players in the Quinolones Market
Originator and Branded Antibacterial Innovators
- Bayer AG
- Daiichi Sankyo Company, Limited
- Melinta Therapeutics, LLC
- Merck & Co., Inc.
Global Generic Injectable and Oral Manufacturers
- Novartis AG
- Hikma Pharmaceuticals PLC
- Cipla Limited
- Sanofi SA
Ophthalmic and Specialty Anti-Infective Formulators
- Bausch + Lomb Corporation
- AstraZeneca plc
Quinolones Market - Report Scope
Table 9: Report Scope for the Quinolones Market (coverage fields and definitions), 2026 to 2036
| Coverage field | Report scope |
|---|---|
| Market breakdown | Drug Generation; Route of Administration; Clinical Indication; Formulation Type; Distribution Channel |
| Quantitative Units | USD Million |
| Market Definition | Includes complexity-indexed institutional and specialty valuation from synthetic second-, third-, fourth-, and novel-generation quinolone and fluoroquinolone antibacterial formulations across oral solid tablets, intravenous infusion solutions, and ophthalmic/otic drops. Category Scope Note: Excludes veterinary-only enrofloxacin/marbofloxacin premixes, unformulated crude chemical intermediates, and non-quinolone urinary antiseptics. |
| Regions Covered | North America; Latin America; Western Europe; Eastern Europe; East Asia; South Asia and Pacific; Middle East and Africa |
| Countries Covered | United States, Canada, South Korea, Australia, United Kingdom, Germany, Japan, France, and additional countries in the full report |
| Key Companies Covered | Bayer AG, Daiichi Sankyo Company, Limited, Novartis AG, Hikma Pharmaceuticals PLC, Melinta Therapeutics, LLC, Bausch + Lomb Corporation, Cipla Limited, Merck & Co., Inc., Sanofi SA, AstraZeneca plc |
| Forecast Period | 2026 to 2036 |
| Approach | Primary and secondary research with top-down and bottom-up market triangulation. |
Quinolones Market - Research Methodology
Table 10: Research Methodology for the Quinolones Market (research methods and approach), 2026 edition
| Method | Approach |
|---|---|
| Primary Research | Structured interviews with hospital infectious-disease clinical pharmacists, group purchasing organization tender directors, ophthalmic surgery center coordinators, and active pharmaceutical ingredient quality heads. |
| Secondary Research | Analysis of WHO GLASS and ECDC ESAC-Net antimicrobial consumption registries, FDA and EMA pharmacovigilance referrals, PubMed and PMC clinical bioequivalence trials, and audited corporate annual reports. |
| Market Sizing and Forecasting | Top-down pharmaceutical anti-infective baselines reconciled against bottom-up hospital defined daily doses (19.1M to 21.4M specialty courses in 2026) and institutional contract realizations from 2026 to 2036. |
| Country Forecasting Model | Econometric country projections weight hospital IV-to-oral switch rates, Gram-negative urological infection incidence, cataract surgical volumes, and national stewardship authority gates across eight countries. |
| Operational Benchmark Traceability | Course volume and hospital pharmacy indicators in Tables 2, 3, and 4 trace to ECDC ESAC-Net DDD/1,000 inhabitants metrics, CDC hospital stewardship audits, and corporate segment disclosures. |
| Data Triangulation and Validation | Valuation estimates isolate complexity-indexed human clinical quinolone formulations while excluding veterinary feed additives and non-quinolone antibacterial classes, compounding at a validated 4.1% CAGR. |
Quinolones Market by Segments
Quinolones Market segmented by Drug Generation:
- Second-Generation Ciprofloxacin and Ofloxacin
- Third-Generation Levofloxacin
- Fourth-Generation Moxifloxacin and Gemifloxacin
- Novel Delafloxacin
Quinolones Market segmented by Route of Administration:
- Oral Solid Tablets
- Intravenous Infusion Solution
- Ophthalmic and Otic Drops Solution
- Topical and Specialty Suspensions
Quinolones Market segmented by Clinical Indication:
- Complex Urinary Tract Infections and Pyelonephritis
- Community-Acquired Pneumonia and Bronchitis
- Complicated Intra-Abdominal Infections
- Bacterial Conjunctivitis and Otitis Externa
- Acute Bacterial Skin and Structure Infections
Quinolones Market segmented by Formulation Type:
- Generic Multi-Source Formulations
- Branded and Patented Formulations
- Ready-to-Use Premixed IV Bags
- Preservative-Free Unit-Dose Drops
Quinolones Market segmented by Distribution Channel:
- Hospital and Acute Care Pharmacies
- Retail and Community Pharmacies
- Specialty and Ophthalmic Clinics
- Online and Mail-Order Pharmacies
Quinolones Market by Region
- North America
- United States
- Canada
- Latin America
- Brazil
- Mexico
- Argentina
- Chile
- Western Europe
- Germany
- France
- United Kingdom
- Italy
- Spain
- Benelux
- Nordics
- Eastern Europe
- Poland
- Czech Republic
- Romania
- Hungary
- East Asia
- China
- Japan
- South Korea
- South Asia and Pacific
- India
- ASEAN
- Australia and New Zealand
- Middle East and Africa
- GCC Countries
- South Africa
- Türkiye
- Israel
Research Sources and Bibliography
- [1] Rusu, A., Munteanu, A. C., Arbănași, E. M., & Uivarosi, V.. (2025, May 24). The Rise, Fall, and Rethink of (Fluoro)quinolones: A Quick Rundown. Pharmaceutics (PubMed Central PMC12196406).
- [2] Al-Badr, A., & Al-Shaikh, G.. (2026, February 12). Optimizing urinary tract infection outcomes: nitrofurantoin versus fluoroquinolones in complicated and uncomplicated cases. Frontiers in Pharmacology (PubMed Central PMC13545966).
- [3] Zhang, Y., & Liu, H.. (2025, May 9). A meta-analytic comparison of ciprofloxacin and levofloxacin in bacterial urological and respiratory infections. Journal of Chemotherapy (PubMed PMID 40355203).
- [4] Chen, W., & Zhou, M.. (2025, February 28). Effectiveness and safety of levofloxacin in the treatment of acute bacterial infections: a systematic clinical evaluation. Médecine et Maladies Infectieuses (PubMed PMID 40013891).
- [5] Kowalski, M., & Nowak, P.. (2025, December 28). Ciprofloxacin resistance in community and hospital-acquired urinary tract infections. Pathogens (PubMed PMID 41455903).
- [6] Hikma Pharmaceuticals PLC. (2025, June 15). 2025 Injectable Product Catalog: Anti-Infective Ciprofloxacin, Levofloxacin, and Moxifloxacin Hospital Formulations. Hikma Pharmaceuticals USA Inc.
- [7] Bonkat, G., Wagenlehner, F., & Cai, T.. (2025, November 10). The case for more prudent prescribing of fluoroquinolones in hospital and outpatient urology. European Urology Focus (PubMed Central PMC12604111).
- [8] Shortridge, D., & Carvalhaes, C. G.. (2025, October 21). P-1340. Activity of Delafloxacin and Comparator Agents Against Acute Bacterial Skin and Respiratory Pathogens. Open Forum Infectious Diseases (PubMed Central PMC12791629).
- [9] Langenbruch, A., & Augustin, M.. (2025, February 7). High risk for life-threatening adverse events of fluoroquinolones in young adults: a large population-based cohort study. Infection (PubMed Central PMC11806691).
- [10] Lin, H., & Wang, Q.. (2026, January 8). Intracameral moxifloxacin for endophthalmitis prophylaxis after cataract surgery. Frontiers in Medicine (PubMed Central PMC12823917).
- [11] Centers for Disease Control and Prevention. (2026, August 14). Persistent Strain of Salmonella Enteritidis (REPJEG02) with Decreased Susceptibility to Ciprofloxacin in the United States. U.S. Department of Health and Human Services CDC.
- [12] Public Health Agency of Canada. (2025, November 18). AMR surveillance in Canada: Insights from the 2025 Priority Antimicrobial Resistance Pathogens Assessment. Canada Communicable Disease Report (PubMed Central PMC12915920).
- [13] Park, S. H., & Kim, Y. J.. (2025, December 9). Changes in Antimicrobial Resistance in Pediatric Urinary Pathogens in South Korea. Journal of Korean Medical Science (PubMed Central PMC12729262).
- [14] Kashef, N., & Djavid, G. E.. (2025, October 6). A systematic review and meta-analysis of the global prevalence of fluoroquinolone resistance across regional healthcare settings. Scientific Reports (PubMed Central PMC12500859).
- [15] Davies, J. C., & Simmonds, N. J.. (2025, July 22). Using delafloxacin, a 4th generation fluoroquinolone, in combination for Pseudomonas aeruginosa eradication in cystic fibrosis. Journal of Cystic Fibrosis (PubMed Central PMC12320081).
- [16] Schulz, M., & Bätzing, J.. (2025, May 27). (Fluoro)quinolone prescriptions for upper respiratory tract infections in the German outpatient sector: a health insurance claims analysis. GMS Infectious Diseases (PubMed Central PMC12171980).
- [17] Hayakawa, K., & Ohmagari, N.. (2025, August 8). The Current Landscape of Antibiotic Use and Antimicrobial Resistance in Japan: Focusing on Common Infections Including Urinary Tract Infection. Antibiotics (PubMed Central PMC12382829).
- [18] de Lastours, V., & Fantin, B.. (2025, August 14). Use of oral fluoroquinolones in France between 2014 and 2023: a nationwide drug utilization study. Journal of Antimicrobial Chemotherapy (PubMed Central PMC12351542).
- [19] Sandoz Group AG. (2026, January 20). Sandoz Integrated Annual Report 2025: Global Anti-Infectives and Hospital Generics Performance. Sandoz Group AG Basel Investor Relations.
- [20] Bausch + Lomb Corporation. (2026, February 18). Bausch + Lomb Announces Fourth-Quarter and Full-Year 2025 Results, Provides 2026 Guidance. Bausch + Lomb Corporation Investor Relations.
- [21] Sandoz Group AG. (2026, February 15). Sandoz Business Report 2025: Securing Global Antibiotic Manufacturing Independence. Sandoz Group AG Basel.
- [22] Bax, B. D., & Murshudov, G. N.. (2025, July 1). Structural basis of topoisomerase targeting by delafloxacin. Nucleic Acids Research (PubMed Central PMC12217528).
- [23] Toffoletto, M., & Alvarez-Lorenzo, C.. (2025, February 1). Development of sustained-release extemporaneous moxifloxacin loaded commercial soft hydrogel contact lenses. International Journal of Pharmaceutics (PubMed Central PMC11847108).
- [24] Chu, X. M., & Wang, B.. (2026, August 31). Redefining Fluoroquinolone Antibiotics: Design and Synthesis of Next-Generation Derivatives. ChemMedChem (PubMed Central PMC13529245).
This source list is provided for reader reference and is not exhaustive. The complete study contains the full reference registry and primary validation methodology.
This Report Answers
- How large is the quinolones market in 2026 and what is forecast for 2036?
- Which inpatient antimicrobial stewardship and Gram-negative infection pressures support demand for quinolones?
- Why does Second-Generation Ciprofloxacin and Ofloxacin lead the drug generation category?
- Why do Oral Solid Tablets lead the route of administration category globally?
- How do national growth rates differ across the United States and Canada alongside South Korea and Australia?
- Which leading companies supply branded novel fluoroquinolones versus multi-source hospital generics today?
- What limits empirical outpatient prescribing or drives resistance in the quinolones market?
- What should hospital pharmacy directors evaluate before awarding multi-year fluoroquinolone tender contracts?
Table of Content
- Key Takeaways
- Market Size and CAGR
- Top Growth Driver
- Fastest Growing Segment
- Leading Region
- Key Companies
- Emerging Opportunities
- Executive Summary
- Global Market Outlook
- Demand-side Trends
- Supply-side Trends
- Technology Roadmap Analysis
- Analysis and Recommendations
- Analyst Perspective (What is happening? Why now? What should investors know?)
- Key Questions Answered
- How large is the market?
- What is the CAGR?
- What are key trends?
- Which region dominates?
- Who are the leaders?
Read More...
- Market Overview
- Market Coverage / Taxonomy
- Market Definition / Scope / Limitations
- Research Methodology
- Chapter Orientation
- Analytical Lens and Working Hypotheses
- Market Structure, Signals, and Trend Drivers
- Benchmarking and Cross-market Comparability
- Market Sizing, Forecasting, and Opportunity Mapping
- Research Design and Evidence Framework
- Desk Research Programme (Secondary Evidence)
- Expert Input and Fieldwork (Primary Evidence)
- Tooling, Models, and Reference Databases
- Data Engineering and Model Build
- Quality Assurance and Audit Trail
- Market Background
- Market Dynamics (Drivers, Restraints, Opportunity, Trends)
- Scenario Forecast (Optimistic, Likely, Conservative)
- Impact Analysis
- AI Impact
- Sustainability Impact
- Regulatory Impact
- Technology Impact
- Consumer / Buyer Analysis
- Purchase Drivers
- Adoption Barriers
- Buyer Journey
- Opportunity Map Analysis
- Product Life Cycle Analysis
- Supply Chain Analysis
- Investment Feasibility Matrix
- Value Chain Analysis
- PESTLE and Porter's Analysis
- Regulatory Landscape
- Regional Parent Market Outlook
- Production and Consumption Statistics
- Import and Export Statistics
- Global Market Analysis and Forecast, 2021 to 2036
- Historical Market Size Value (USD Million) Analysis, 2021 to 2025
- Current and Future Market Size Value (USD Million) Projections, 2026 to 2036
- Y-o-Y Growth Trend Analysis
- Absolute $ Opportunity Analysis
- Global Market Pricing Analysis, 2021 to 2036
- Global Market Analysis and Forecast, By Drug Generation, 2021 to 2036
- Introduction / Key Findings
- Historical Market Size Value (USD Million) Analysis By Drug Generation, 2021 to 2025
- Current and Future Market Size Value (USD Million) Analysis and Forecast By Drug Generation, 2026 to 2036
- Second-Generation Ciprofloxacin and Ofloxacin
- Third-Generation Levofloxacin
- Fourth-Generation Moxifloxacin and Gemifloxacin
- Novel Delafloxacin
- Y-o-Y Growth Trend Analysis By Drug Generation, 2021 to 2025
- Absolute $ Opportunity Analysis By Drug Generation, 2026 to 2036
- Global Market Analysis and Forecast, By Route of Administration, 2021 to 2036
- Introduction / Key Findings
- Historical Market Size Value (USD Million) Analysis By Route of Administration, 2021 to 2025
- Current and Future Market Size Value (USD Million) Analysis and Forecast By Route of Administration, 2026 to 2036
- Oral Solid Tablets
- Intravenous Infusion Solution
- Ophthalmic and Otic Drops Solution
- Topical and Specialty Suspensions
- Y-o-Y Growth Trend Analysis By Route of Administration, 2021 to 2025
- Absolute $ Opportunity Analysis By Route of Administration, 2026 to 2036
- Global Market Analysis and Forecast, By Clinical Indication, 2021 to 2036
- Introduction / Key Findings
- Historical Market Size Value (USD Million) Analysis By Clinical Indication, 2021 to 2025
- Current and Future Market Size Value (USD Million) Analysis and Forecast By Clinical Indication, 2026 to 2036
- Complex Urinary Tract Infections and Pyelonephritis
- Community-Acquired Pneumonia and Bronchitis
- Complicated Intra-Abdominal Infections
- Bacterial Conjunctivitis and Otitis Externa
- Acute Bacterial Skin and Structure Infections
- Y-o-Y Growth Trend Analysis By Clinical Indication, 2021 to 2025
- Absolute $ Opportunity Analysis By Clinical Indication, 2026 to 2036
- Global Market Analysis and Forecast, By Formulation Type, 2021 to 2036
- Introduction / Key Findings
- Historical Market Size Value (USD Million) Analysis By Formulation Type, 2021 to 2025
- Current and Future Market Size Value (USD Million) Analysis and Forecast By Formulation Type, 2026 to 2036
- Generic Multi-Source Formulations
- Branded and Patented Formulations
- Ready-to-Use Premixed IV Bags
- Preservative-Free Unit-Dose Drops
- Y-o-Y Growth Trend Analysis By Formulation Type, 2021 to 2025
- Absolute $ Opportunity Analysis By Formulation Type, 2026 to 2036
- Global Market Analysis and Forecast, By Distribution Channel, 2021 to 2036
- Introduction / Key Findings
- Historical Market Size Value (USD Million) Analysis By Distribution Channel, 2021 to 2025
- Current and Future Market Size Value (USD Million) Analysis and Forecast By Distribution Channel, 2026 to 2036
- Hospital and Acute Care Pharmacies
- Retail and Community Pharmacies
- Specialty and Ophthalmic Clinics
- Online and Mail-Order Pharmacies
- Y-o-Y Growth Trend Analysis By Distribution Channel, 2021 to 2025
- Absolute $ Opportunity Analysis By Distribution Channel, 2026 to 2036
- Global Market Analysis and Forecast, By Region, 2021 to 2036
- Introduction
- Historical Market Size Value (USD Million) Analysis By Region, 2021 to 2025
- Current Market Size Value (USD Million) Analysis and Forecast By Region, 2026 to 2036
- North America
- Latin America
- Western Europe
- Eastern Europe
- East Asia
- South Asia and Pacific
- Middle East and Africa
- Market Attractiveness Analysis By Region
- North America Market Analysis and Forecast, By Country, 2021 to 2036
- Historical Market Size Value (USD Million) Trend Analysis By Market Taxonomy, 2021 to 2025
- Market Size Value (USD Million) Forecast By Market Taxonomy, 2026 to 2036
- By Country
- United States
- Canada
- By Drug Generation
- By Route of Administration
- By Clinical Indication
- By Formulation Type
- By Distribution Channel
- By Country
- Market Attractiveness Analysis
- By Country
- By Drug Generation
- By Route of Administration
- By Clinical Indication
- By Formulation Type
- By Distribution Channel
- Key Takeaways
- Latin America Market Analysis and Forecast, By Country
- Historical Market Size Value (USD Million) Trend Analysis By Market Taxonomy, 2021 to 2025
- Market Size Value (USD Million) Forecast By Market Taxonomy, 2026 to 2036
- By Country
- Brazil
- Mexico
- Argentina
- Chile
- By Drug Generation
- By Route of Administration
- By Clinical Indication
- By Formulation Type
- By Distribution Channel
- By Country
- Market Attractiveness Analysis
- By Country
- By Drug Generation
- By Route of Administration
- By Clinical Indication
- By Formulation Type
- By Distribution Channel
- Key Takeaways
- Western Europe Market Analysis and Forecast, By Country
- Historical Market Size Value (USD Million) Trend Analysis By Market Taxonomy, 2021 to 2025
- Market Size Value (USD Million) Forecast By Market Taxonomy, 2026 to 2036
- By Country
- Germany
- France
- United Kingdom
- Italy
- Spain
- Benelux
- Nordics
- By Drug Generation
- By Route of Administration
- By Clinical Indication
- By Formulation Type
- By Distribution Channel
- By Country
- Market Attractiveness Analysis
- By Country
- By Drug Generation
- By Route of Administration
- By Clinical Indication
- By Formulation Type
- By Distribution Channel
- Key Takeaways
- Eastern Europe Market Analysis and Forecast, By Country
- Historical Market Size Value (USD Million) Trend Analysis By Market Taxonomy, 2021 to 2025
- Market Size Value (USD Million) Forecast By Market Taxonomy, 2026 to 2036
- By Country
- Poland
- Czech Republic
- Romania
- Hungary
- By Drug Generation
- By Route of Administration
- By Clinical Indication
- By Formulation Type
- By Distribution Channel
- By Country
- Market Attractiveness Analysis
- By Country
- By Drug Generation
- By Route of Administration
- By Clinical Indication
- By Formulation Type
- By Distribution Channel
- Key Takeaways
- East Asia Market Analysis and Forecast, By Country
- Historical Market Size Value (USD Million) Trend Analysis By Market Taxonomy, 2021 to 2025
- Market Size Value (USD Million) Forecast By Market Taxonomy, 2026 to 2036
- By Country
- China
- Japan
- South Korea
- By Drug Generation
- By Route of Administration
- By Clinical Indication
- By Formulation Type
- By Distribution Channel
- By Country
- Market Attractiveness Analysis
- By Country
- By Drug Generation
- By Route of Administration
- By Clinical Indication
- By Formulation Type
- By Distribution Channel
- Key Takeaways
- South Asia and Pacific Market Analysis and Forecast, By Country
- Historical Market Size Value (USD Million) Trend Analysis By Market Taxonomy, 2021 to 2025
- Market Size Value (USD Million) Forecast By Market Taxonomy, 2026 to 2036
- By Country
- India
- ASEAN
- Australia and New Zealand
- By Drug Generation
- By Route of Administration
- By Clinical Indication
- By Formulation Type
- By Distribution Channel
- By Country
- Market Attractiveness Analysis
- By Country
- By Drug Generation
- By Route of Administration
- By Clinical Indication
- By Formulation Type
- By Distribution Channel
- Key Takeaways
- Middle East and Africa Market Analysis and Forecast, By Country
- Historical Market Size Value (USD Million) Trend Analysis By Market Taxonomy, 2021 to 2025
- Market Size Value (USD Million) Forecast By Market Taxonomy, 2026 to 2036
- By Country
- GCC Countries
- South Africa
- Türkiye
- Israel
- By Drug Generation
- By Route of Administration
- By Clinical Indication
- By Formulation Type
- By Distribution Channel
- By Country
- Market Attractiveness Analysis
- By Country
- By Drug Generation
- By Route of Administration
- By Clinical Indication
- By Formulation Type
- By Distribution Channel
- Key Takeaways
- Key Countries Market Analysis
- United States
- Pricing Analysis
- Market Share Analysis, 2025
- By Drug Generation
- By Route of Administration
- By Clinical Indication
- By Formulation Type
- By Distribution Channel
- Canada
- Pricing Analysis
- Market Share Analysis, 2025
- By Drug Generation
- By Route of Administration
- By Clinical Indication
- By Formulation Type
- By Distribution Channel
- Mexico
- Pricing Analysis
- Market Share Analysis, 2025
- By Drug Generation
- By Route of Administration
- By Clinical Indication
- By Formulation Type
- By Distribution Channel
- Brazil
- Pricing Analysis
- Market Share Analysis, 2025
- By Drug Generation
- By Route of Administration
- By Clinical Indication
- By Formulation Type
- By Distribution Channel
- Chile
- Pricing Analysis
- Market Share Analysis, 2025
- By Drug Generation
- By Route of Administration
- By Clinical Indication
- By Formulation Type
- By Distribution Channel
- Germany
- Pricing Analysis
- Market Share Analysis, 2025
- By Drug Generation
- By Route of Administration
- By Clinical Indication
- By Formulation Type
- By Distribution Channel
- United Kingdom
- Pricing Analysis
- Market Share Analysis, 2025
- By Drug Generation
- By Route of Administration
- By Clinical Indication
- By Formulation Type
- By Distribution Channel
- Italy
- Pricing Analysis
- Market Share Analysis, 2025
- By Drug Generation
- By Route of Administration
- By Clinical Indication
- By Formulation Type
- By Distribution Channel
- Spain
- Pricing Analysis
- Market Share Analysis, 2025
- By Drug Generation
- By Route of Administration
- By Clinical Indication
- By Formulation Type
- By Distribution Channel
- France
- Pricing Analysis
- Market Share Analysis, 2025
- By Drug Generation
- By Route of Administration
- By Clinical Indication
- By Formulation Type
- By Distribution Channel
- India
- Pricing Analysis
- Market Share Analysis, 2025
- By Drug Generation
- By Route of Administration
- By Clinical Indication
- By Formulation Type
- By Distribution Channel
- ASEAN
- Pricing Analysis
- Market Share Analysis, 2025
- By Drug Generation
- By Route of Administration
- By Clinical Indication
- By Formulation Type
- By Distribution Channel
- Australia and New Zealand
- Pricing Analysis
- Market Share Analysis, 2025
- By Drug Generation
- By Route of Administration
- By Clinical Indication
- By Formulation Type
- By Distribution Channel
- China
- Pricing Analysis
- Market Share Analysis, 2025
- By Drug Generation
- By Route of Administration
- By Clinical Indication
- By Formulation Type
- By Distribution Channel
- Japan
- Pricing Analysis
- Market Share Analysis, 2025
- By Drug Generation
- By Route of Administration
- By Clinical Indication
- By Formulation Type
- By Distribution Channel
- South Korea
- Pricing Analysis
- Market Share Analysis, 2025
- By Drug Generation
- By Route of Administration
- By Clinical Indication
- By Formulation Type
- By Distribution Channel
- Poland
- Pricing Analysis
- Market Share Analysis, 2025
- By Drug Generation
- By Route of Administration
- By Clinical Indication
- By Formulation Type
- By Distribution Channel
- Hungary
- Pricing Analysis
- Market Share Analysis, 2025
- By Drug Generation
- By Route of Administration
- By Clinical Indication
- By Formulation Type
- By Distribution Channel
- Türkiye
- Pricing Analysis
- Market Share Analysis, 2025
- By Drug Generation
- By Route of Administration
- By Clinical Indication
- By Formulation Type
- By Distribution Channel
- South Africa
- Pricing Analysis
- Market Share Analysis, 2025
- By Drug Generation
- By Route of Administration
- By Clinical Indication
- By Formulation Type
- By Distribution Channel
- Australia
- Pricing Analysis
- Market Share Analysis, 2025
- By Drug Generation
- By Route of Administration
- By Clinical Indication
- By Formulation Type
- By Distribution Channel
- United States
- Market Structure Analysis
- Competition Dashboard
- Competition Benchmarking
- Market Share Analysis of Top Players
- By Regional
- By Drug Generation
- By Route of Administration
- By Clinical Indication
- By Formulation Type
- By Distribution Channel
- Emerging Startups
- Innovation Benchmarking
- Competition Analysis
- Competition Deep Dive
- Bayer AG
- Overview
- Product Portfolio
- Profitability by Market Segments
- Sales Footprint
- Strategy Overview
- Marketing Strategy
- Product Strategy
- Channel Strategy
- Daiichi Sankyo Company, Limited
- Novartis AG
- Hikma Pharmaceuticals PLC
- Melinta Therapeutics, LLC
- Bausch + Lomb Corporation
- Cipla Limited
- Merck & Co., Inc.
- Sanofi SA
- AstraZeneca plc
- Bayer AG
- Case Studies
- Success Stories
- Recent Developments
- Competition Deep Dive
- Assumptions & Acronyms Used
List of Tables
- Table 1: Global Market Value (USD Million) Forecast by Region, 2021 to 2036
- Table 2: Global Market Value (USD Million) Forecast by Drug Generation, 2021 to 2036
- Table 3: Global Market Value (USD Million) Forecast by Route of Administration, 2021 to 2036
- Table 4: Global Market Value (USD Million) Forecast by Clinical Indication, 2021 to 2036
- Table 5: Global Market Value (USD Million) Forecast by Formulation Type, 2021 to 2036
- Table 6: Global Market Value (USD Million) Forecast by Distribution Channel, 2021 to 2036
- Table 7: North America Market Value (USD Million) Forecast by Country, 2021 to 2036
- Table 8: North America Market Value (USD Million) Forecast by Drug Generation, 2021 to 2036
- Table 9: North America Market Value (USD Million) Forecast by Route of Administration, 2021 to 2036
- Table 10: North America Market Value (USD Million) Forecast by Clinical Indication, 2021 to 2036
- Table 11: North America Market Value (USD Million) Forecast by Formulation Type, 2021 to 2036
- Table 12: North America Market Value (USD Million) Forecast by Distribution Channel, 2021 to 2036
- Table 13: Latin America Market Value (USD Million) Forecast by Country, 2021 to 2036
- Table 14: Latin America Market Value (USD Million) Forecast by Drug Generation, 2021 to 2036
- Table 15: Latin America Market Value (USD Million) Forecast by Route of Administration, 2021 to 2036
- Table 16: Latin America Market Value (USD Million) Forecast by Clinical Indication, 2021 to 2036
- Table 17: Latin America Market Value (USD Million) Forecast by Formulation Type, 2021 to 2036
- Table 18: Latin America Market Value (USD Million) Forecast by Distribution Channel, 2021 to 2036
- Table 19: Western Europe Market Value (USD Million) Forecast by Country, 2021 to 2036
- Table 20: Western Europe Market Value (USD Million) Forecast by Drug Generation, 2021 to 2036
- Table 21: Western Europe Market Value (USD Million) Forecast by Route of Administration, 2021 to 2036
- Table 22: Western Europe Market Value (USD Million) Forecast by Clinical Indication, 2021 to 2036
- Table 23: Western Europe Market Value (USD Million) Forecast by Formulation Type, 2021 to 2036
- Table 24: Western Europe Market Value (USD Million) Forecast by Distribution Channel, 2021 to 2036
- Table 25: Eastern Europe Market Value (USD Million) Forecast by Country, 2021 to 2036
- Table 26: Eastern Europe Market Value (USD Million) Forecast by Drug Generation, 2021 to 2036
- Table 27: Eastern Europe Market Value (USD Million) Forecast by Route of Administration, 2021 to 2036
- Table 28: Eastern Europe Market Value (USD Million) Forecast by Clinical Indication, 2021 to 2036
- Table 29: Eastern Europe Market Value (USD Million) Forecast by Formulation Type, 2021 to 2036
- Table 30: Eastern Europe Market Value (USD Million) Forecast by Distribution Channel, 2021 to 2036
- Table 31: East Asia Market Value (USD Million) Forecast by Country, 2021 to 2036
- Table 32: East Asia Market Value (USD Million) Forecast by Drug Generation, 2021 to 2036
- Table 33: East Asia Market Value (USD Million) Forecast by Route of Administration, 2021 to 2036
- Table 34: East Asia Market Value (USD Million) Forecast by Clinical Indication, 2021 to 2036
- Table 35: East Asia Market Value (USD Million) Forecast by Formulation Type, 2021 to 2036
- Table 36: East Asia Market Value (USD Million) Forecast by Distribution Channel, 2021 to 2036
- Table 37: South Asia and Pacific Market Value (USD Million) Forecast by Country, 2021 to 2036
- Table 38: South Asia and Pacific Market Value (USD Million) Forecast by Drug Generation, 2021 to 2036
- Table 39: South Asia and Pacific Market Value (USD Million) Forecast by Route of Administration, 2021 to 2036
- Table 40: South Asia and Pacific Market Value (USD Million) Forecast by Clinical Indication, 2021 to 2036
- Table 41: South Asia and Pacific Market Value (USD Million) Forecast by Formulation Type, 2021 to 2036
- Table 42: South Asia and Pacific Market Value (USD Million) Forecast by Distribution Channel, 2021 to 2036
- Table 43: Middle East and Africa Market Value (USD Million) Forecast by Country, 2021 to 2036
- Table 44: Middle East and Africa Market Value (USD Million) Forecast by Drug Generation, 2021 to 2036
- Table 45: Middle East and Africa Market Value (USD Million) Forecast by Route of Administration, 2021 to 2036
- Table 46: Middle East and Africa Market Value (USD Million) Forecast by Clinical Indication, 2021 to 2036
- Table 47: Middle East and Africa Market Value (USD Million) Forecast by Formulation Type, 2021 to 2036
- Table 48: Middle East and Africa Market Value (USD Million) Forecast by Distribution Channel, 2021 to 2036
List of Figures
- Figure 1: Global Market Pricing Analysis
- Figure 2: Global Market Value (USD Million) Forecast 2021-2036
- Figure 3: Global Market Value Share and BPS Analysis by Drug Generation, 2026 and 2036
- Figure 4: Global Market Y-o-Y Growth Comparison by Drug Generation, 2026-2036
- Figure 5: Global Market Attractiveness Analysis by Drug Generation
- Figure 6: Global Market Value Share and BPS Analysis by Route of Administration, 2026 and 2036
- Figure 7: Global Market Y-o-Y Growth Comparison by Route of Administration, 2026-2036
- Figure 8: Global Market Attractiveness Analysis by Route of Administration
- Figure 9: Global Market Value Share and BPS Analysis by Clinical Indication, 2026 and 2036
- Figure 10: Global Market Y-o-Y Growth Comparison by Clinical Indication, 2026-2036
- Figure 11: Global Market Attractiveness Analysis by Clinical Indication
- Figure 12: Global Market Value Share and BPS Analysis by Formulation Type, 2026 and 2036
- Figure 13: Global Market Y-o-Y Growth Comparison by Formulation Type, 2026-2036
- Figure 14: Global Market Attractiveness Analysis by Formulation Type
- Figure 15: Global Market Value Share and BPS Analysis by Distribution Channel, 2026 and 2036
- Figure 16: Global Market Y-o-Y Growth Comparison by Distribution Channel, 2026-2036
- Figure 17: Global Market Attractiveness Analysis by Distribution Channel
- Figure 18: Global Market Value (USD Million) Share and BPS Analysis by Region, 2026 and 2036
- Figure 19: Global Market Y-o-Y Growth Comparison by Region, 2026-2036
- Figure 20: Global Market Attractiveness Analysis by Region
- Figure 21: North America Market Incremental Dollar Opportunity, 2026-2036
- Figure 22: Latin America Market Incremental Dollar Opportunity, 2026-2036
- Figure 23: Western Europe Market Incremental Dollar Opportunity, 2026-2036
- Figure 24: Eastern Europe Market Incremental Dollar Opportunity, 2026-2036
- Figure 25: East Asia Market Incremental Dollar Opportunity, 2026-2036
- Figure 26: South Asia and Pacific Market Incremental Dollar Opportunity, 2026-2036
- Figure 27: Middle East and Africa Market Incremental Dollar Opportunity, 2026-2036
- Figure 28: North America Market Value Share and BPS Analysis by Country, 2026 and 2036
- Figure 29: North America Market Value Share and BPS Analysis by Drug Generation, 2026 and 2036
- Figure 30: North America Market Y-o-Y Growth Comparison by Drug Generation, 2026-2036
- Figure 31: North America Market Attractiveness Analysis by Drug Generation
- Figure 32: North America Market Value Share and BPS Analysis by Route of Administration, 2026 and 2036
- Figure 33: North America Market Y-o-Y Growth Comparison by Route of Administration, 2026-2036
- Figure 34: North America Market Attractiveness Analysis by Route of Administration
- Figure 35: North America Market Value Share and BPS Analysis by Clinical Indication, 2026 and 2036
- Figure 36: North America Market Y-o-Y Growth Comparison by Clinical Indication, 2026-2036
- Figure 37: North America Market Attractiveness Analysis by Clinical Indication
- Figure 38: North America Market Value Share and BPS Analysis by Formulation Type, 2026 and 2036
- Figure 39: North America Market Y-o-Y Growth Comparison by Formulation Type, 2026-2036
- Figure 40: North America Market Attractiveness Analysis by Formulation Type
- Figure 41: North America Market Value Share and BPS Analysis by Distribution Channel, 2026 and 2036
- Figure 42: North America Market Y-o-Y Growth Comparison by Distribution Channel, 2026-2036
- Figure 43: North America Market Attractiveness Analysis by Distribution Channel
- Figure 44: Latin America Market Value Share and BPS Analysis by Country, 2026 and 2036
- Figure 45: Latin America Market Value Share and BPS Analysis by Drug Generation, 2026 and 2036
- Figure 46: Latin America Market Y-o-Y Growth Comparison by Drug Generation, 2026-2036
- Figure 47: Latin America Market Attractiveness Analysis by Drug Generation
- Figure 48: Latin America Market Value Share and BPS Analysis by Route of Administration, 2026 and 2036
- Figure 49: Latin America Market Y-o-Y Growth Comparison by Route of Administration, 2026-2036
- Figure 50: Latin America Market Attractiveness Analysis by Route of Administration
- Figure 51: Latin America Market Value Share and BPS Analysis by Clinical Indication, 2026 and 2036
- Figure 52: Latin America Market Y-o-Y Growth Comparison by Clinical Indication, 2026-2036
- Figure 53: Latin America Market Attractiveness Analysis by Clinical Indication
- Figure 54: Latin America Market Value Share and BPS Analysis by Formulation Type, 2026 and 2036
- Figure 55: Latin America Market Y-o-Y Growth Comparison by Formulation Type, 2026-2036
- Figure 56: Latin America Market Attractiveness Analysis by Formulation Type
- Figure 57: Latin America Market Value Share and BPS Analysis by Distribution Channel, 2026 and 2036
- Figure 58: Latin America Market Y-o-Y Growth Comparison by Distribution Channel, 2026-2036
- Figure 59: Latin America Market Attractiveness Analysis by Distribution Channel
- Figure 60: Western Europe Market Value Share and BPS Analysis by Country, 2026 and 2036
- Figure 61: Western Europe Market Value Share and BPS Analysis by Drug Generation, 2026 and 2036
- Figure 62: Western Europe Market Y-o-Y Growth Comparison by Drug Generation, 2026-2036
- Figure 63: Western Europe Market Attractiveness Analysis by Drug Generation
- Figure 64: Western Europe Market Value Share and BPS Analysis by Route of Administration, 2026 and 2036
- Figure 65: Western Europe Market Y-o-Y Growth Comparison by Route of Administration, 2026-2036
- Figure 66: Western Europe Market Attractiveness Analysis by Route of Administration
- Figure 67: Western Europe Market Value Share and BPS Analysis by Clinical Indication, 2026 and 2036
- Figure 68: Western Europe Market Y-o-Y Growth Comparison by Clinical Indication, 2026-2036
- Figure 69: Western Europe Market Attractiveness Analysis by Clinical Indication
- Figure 70: Western Europe Market Value Share and BPS Analysis by Formulation Type, 2026 and 2036
- Figure 71: Western Europe Market Y-o-Y Growth Comparison by Formulation Type, 2026-2036
- Figure 72: Western Europe Market Attractiveness Analysis by Formulation Type
- Figure 73: Western Europe Market Value Share and BPS Analysis by Distribution Channel, 2026 and 2036
- Figure 74: Western Europe Market Y-o-Y Growth Comparison by Distribution Channel, 2026-2036
- Figure 75: Western Europe Market Attractiveness Analysis by Distribution Channel
- Figure 76: Eastern Europe Market Value Share and BPS Analysis by Country, 2026 and 2036
- Figure 77: Eastern Europe Market Value Share and BPS Analysis by Drug Generation, 2026 and 2036
- Figure 78: Eastern Europe Market Y-o-Y Growth Comparison by Drug Generation, 2026-2036
- Figure 79: Eastern Europe Market Attractiveness Analysis by Drug Generation
- Figure 80: Eastern Europe Market Value Share and BPS Analysis by Route of Administration, 2026 and 2036
- Figure 81: Eastern Europe Market Y-o-Y Growth Comparison by Route of Administration, 2026-2036
- Figure 82: Eastern Europe Market Attractiveness Analysis by Route of Administration
- Figure 83: Eastern Europe Market Value Share and BPS Analysis by Clinical Indication, 2026 and 2036
- Figure 84: Eastern Europe Market Y-o-Y Growth Comparison by Clinical Indication, 2026-2036
- Figure 85: Eastern Europe Market Attractiveness Analysis by Clinical Indication
- Figure 86: Eastern Europe Market Value Share and BPS Analysis by Formulation Type, 2026 and 2036
- Figure 87: Eastern Europe Market Y-o-Y Growth Comparison by Formulation Type, 2026-2036
- Figure 88: Eastern Europe Market Attractiveness Analysis by Formulation Type
- Figure 89: Eastern Europe Market Value Share and BPS Analysis by Distribution Channel, 2026 and 2036
- Figure 90: Eastern Europe Market Y-o-Y Growth Comparison by Distribution Channel, 2026-2036
- Figure 91: Eastern Europe Market Attractiveness Analysis by Distribution Channel
- Figure 92: East Asia Market Value Share and BPS Analysis by Country, 2026 and 2036
- Figure 93: East Asia Market Value Share and BPS Analysis by Drug Generation, 2026 and 2036
- Figure 94: East Asia Market Y-o-Y Growth Comparison by Drug Generation, 2026-2036
- Figure 95: East Asia Market Attractiveness Analysis by Drug Generation
- Figure 96: East Asia Market Value Share and BPS Analysis by Route of Administration, 2026 and 2036
- Figure 97: East Asia Market Y-o-Y Growth Comparison by Route of Administration, 2026-2036
- Figure 98: East Asia Market Attractiveness Analysis by Route of Administration
- Figure 99: East Asia Market Value Share and BPS Analysis by Clinical Indication, 2026 and 2036
- Figure 100: East Asia Market Y-o-Y Growth Comparison by Clinical Indication, 2026-2036
- Figure 101: East Asia Market Attractiveness Analysis by Clinical Indication
- Figure 102: East Asia Market Value Share and BPS Analysis by Formulation Type, 2026 and 2036
- Figure 103: East Asia Market Y-o-Y Growth Comparison by Formulation Type, 2026-2036
- Figure 104: East Asia Market Attractiveness Analysis by Formulation Type
- Figure 105: East Asia Market Value Share and BPS Analysis by Distribution Channel, 2026 and 2036
- Figure 106: East Asia Market Y-o-Y Growth Comparison by Distribution Channel, 2026-2036
- Figure 107: East Asia Market Attractiveness Analysis by Distribution Channel
- Figure 108: South Asia and Pacific Market Value Share and BPS Analysis by Country, 2026 and 2036
- Figure 109: South Asia and Pacific Market Value Share and BPS Analysis by Drug Generation, 2026 and 2036
- Figure 110: South Asia and Pacific Market Y-o-Y Growth Comparison by Drug Generation, 2026-2036
- Figure 111: South Asia and Pacific Market Attractiveness Analysis by Drug Generation
- Figure 112: South Asia and Pacific Market Value Share and BPS Analysis by Route of Administration, 2026 and 2036
- Figure 113: South Asia and Pacific Market Y-o-Y Growth Comparison by Route of Administration, 2026-2036
- Figure 114: South Asia and Pacific Market Attractiveness Analysis by Route of Administration
- Figure 115: South Asia and Pacific Market Value Share and BPS Analysis by Clinical Indication, 2026 and 2036
- Figure 116: South Asia and Pacific Market Y-o-Y Growth Comparison by Clinical Indication, 2026-2036
- Figure 117: South Asia and Pacific Market Attractiveness Analysis by Clinical Indication
- Figure 118: South Asia and Pacific Market Value Share and BPS Analysis by Formulation Type, 2026 and 2036
- Figure 119: South Asia and Pacific Market Y-o-Y Growth Comparison by Formulation Type, 2026-2036
- Figure 120: South Asia and Pacific Market Attractiveness Analysis by Formulation Type
- Figure 121: South Asia and Pacific Market Value Share and BPS Analysis by Distribution Channel, 2026 and 2036
- Figure 122: South Asia and Pacific Market Y-o-Y Growth Comparison by Distribution Channel, 2026-2036
- Figure 123: South Asia and Pacific Market Attractiveness Analysis by Distribution Channel
- Figure 124: Middle East and Africa Market Value Share and BPS Analysis by Country, 2026 and 2036
- Figure 125: Middle East and Africa Market Value Share and BPS Analysis by Drug Generation, 2026 and 2036
- Figure 126: Middle East and Africa Market Y-o-Y Growth Comparison by Drug Generation, 2026-2036
- Figure 127: Middle East and Africa Market Attractiveness Analysis by Drug Generation
- Figure 128: Middle East and Africa Market Value Share and BPS Analysis by Route of Administration, 2026 and 2036
- Figure 129: Middle East and Africa Market Y-o-Y Growth Comparison by Route of Administration, 2026-2036
- Figure 130: Middle East and Africa Market Attractiveness Analysis by Route of Administration
- Figure 131: Middle East and Africa Market Value Share and BPS Analysis by Clinical Indication, 2026 and 2036
- Figure 132: Middle East and Africa Market Y-o-Y Growth Comparison by Clinical Indication, 2026-2036
- Figure 133: Middle East and Africa Market Attractiveness Analysis by Clinical Indication
- Figure 134: Middle East and Africa Market Value Share and BPS Analysis by Formulation Type, 2026 and 2036
- Figure 135: Middle East and Africa Market Y-o-Y Growth Comparison by Formulation Type, 2026-2036
- Figure 136: Middle East and Africa Market Attractiveness Analysis by Formulation Type
- Figure 137: Middle East and Africa Market Value Share and BPS Analysis by Distribution Channel, 2026 and 2036
- Figure 138: Middle East and Africa Market Y-o-Y Growth Comparison by Distribution Channel, 2026-2036
- Figure 139: Middle East and Africa Market Attractiveness Analysis by Distribution Channel
- Figure 140: Global Market - Tier Structure Analysis
- Figure 141: Global Market - Company Share Analysis
Frequently Asked Questions
How big is the quinolones market in 2026, and what is forecast for 2036?
Global quinolones demand totaled USD 95.5 million in 2025 and rose to USD 99.2 million in 2026. FMI projects 2036 valuation at USD 148.3 million as hospitals standardize culture-guided step-down therapy and ophthalmic prophylaxis.
What is the CAGR for the quinolones market from 2026 to 2036?
Compound annual growth for quinolones tracks at 4.1% between 2026 and 2036, generating USD 49.1 million in net dollar expansion over the decade.
Which drug generation segment leads the quinolones market?
Second-Generation Ciprofloxacin and Ofloxacin hold 36.8% of drug generation demand in 2026 because high urinary and tissue penetration supports acute Gram-negative pyelonephritis protocols.
Which route of administration segment leads the quinolones market?
Oral Solid Tablets represent 48.9% of the route of administration category in 2026 as high oral bioavailability enables early hospital discharge and outpatient continuation regimens.
Which country has a notable growth outlook during the assessment period?
United States hospital and ophthalmic procurement paces country growth at a 4.9% CAGR through 2036 via inpatient MRSA-active delafloxacin adoption.
Who are the key players in the market?
Bayer AG and Daiichi Sankyo Company Limited alongside Novartis AG and Hikma Pharmaceuticals PLC lead global supply. Melinta Therapeutics LLC and Bausch + Lomb Corporation with Cipla Limited and Merck & Co. Inc. alongside Sanofi SA and AstraZeneca plc also hold major institutional shares.
Preview the report firsthand - request a free sample
Get SampleGet the brochure for pricing and purchase details.
Get PDF
