The global sales of Rx-to-OTC switches is estimated to be worth USD 43,008.6 million in 2025. The market is projected to grow at a CAGR of 5.0% and reach USD 70,056.5 million by 2035. The revenue generated by Rx-to-OTC switches in 2024 was USD 40,785.8 million where it demonstrated a year-on-year growth of 5.7%.
Pharmaceutical companies push back by developing OTC forms of existing Rx drugs, as a way of responding to demand from consumers and making available the product that extended life cycle. Switching of prescription to an over-the-counter status for medication greatly enhances the access of patients to therapies which easily and cost-effectively enables people to monitor common health conditions. There is an added focus on patient empowerment and the importance of self-care, driven by consumers to have more ownership over their care decisions.
With increased awareness about the merits of self-medication, alongside cost-containment in health systems, the Rx-to-OTC switch is likely to further surge ahead with more consumer empowerment to control better and add on to the pharmaceutical market growth.
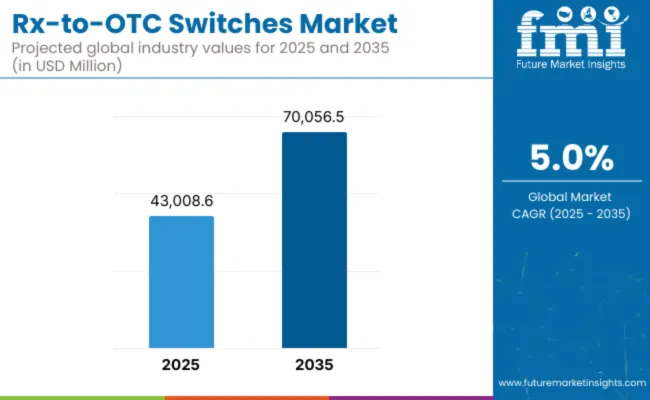
| Attributes | Key Insights |
|---|---|
| Industry Size (2025E) | USD 43,008.6 million |
| Industry Value (2035F) | USD 70,056.5 million |
| CAGR (2025 to 2035) | 5.0% |
The Rx-to-OTC switch has been highly important in facilitating access to healthcare. It enables consumers to be self-sufficient for minor conditions without need of a visit to a doctor. Such growth has been driven by the increasing demand for self-care, treatment convenience, and affordability. The major ailments that have benefited immensely from this transition include allergies, heartburn, migraine, and pain management. This makes it easier for consumers to immediately attend to their ailments instead of wasting time.
The increasing awareness and consumer together with mounting pressure on the need for advancement in pharmaceutical formulations have led to the different Rx-to-OTC switch strategies applied in health care. Regulatory agencies such as the FDA are pivoting to make sure that such medications meet the sensitive demands on safety, efficacy, and labeling.
The approval for OTC status of various commonly prescribed medications has greatly facilitated the availability of treatment options to consumers without compromising safety. Besides, consumer education and awareness campaigns that the industry is pursuing will facilitate a smooth transition and ensure appropriate use of the OTC product.
The pharmaceutical interventions within the Rx-to-OTC switch landscape continue to evolve as innovations in formulation and combination therapy enhance efficacy and convenience. Non-prescription medications possess extended-release mechanisms, improved bioavailability, and lower side effects, making them more suitable for self-administration.
With increasing demand for accessibility, affordability, and convenience, Rx-to-OTC switches would continue to form one of the key trends within the pharmaceutical industry, foster self-care, and decrease dependency on health care providers with safe and effective treatment options available for a broad range of condition.
The Rx-to-OTC space is rapidly evolving through pharmaceutical and technological innovations aimed at enhancing safety, accessibility, and user autonomy. Companies are investing in advanced formulations and smart delivery mechanisms that simplify self-administration and improve consumer confidence.
Global regulatory bodies require that prescription drugs meet stringent safety, efficacy and labeling standards before they can be reclassified for overthecounter use. Applicants must demonstrate that consumers can selfselect and use the medicine without medical supervision, and commit to ongoing monitoring once the switch is approved.
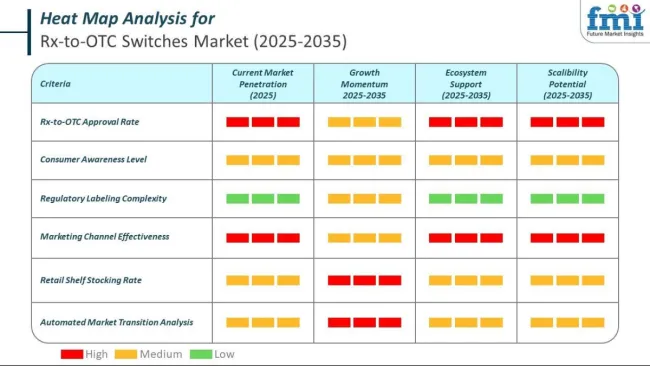
The section contains information about the leading segments in the industry. By drug category, allergy and respiratory segment hold highest share of the Rx-to-OTC switches market.
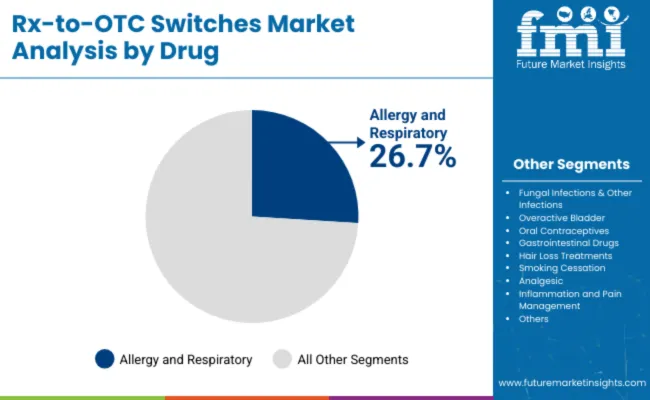
| Drug Category | Value Share (2024) |
|---|---|
| Allergy and Respiratory | 26.7% |
Allergic conditions and respiratory diseases, allergic rhinitis, and nasal congestion are highly prevalent. Indeed, this high prevalence, by itself, corresponds to an even higher demand for easy and effective treatments. As such, the prescription-to-over-the-counter switch of medications benefits pharmaceutical companies to serve consumers' needs for convenient self-care. This reason, among others, will shift such medications into over-the-counter status for easy access and better convenience on the part of consumers.
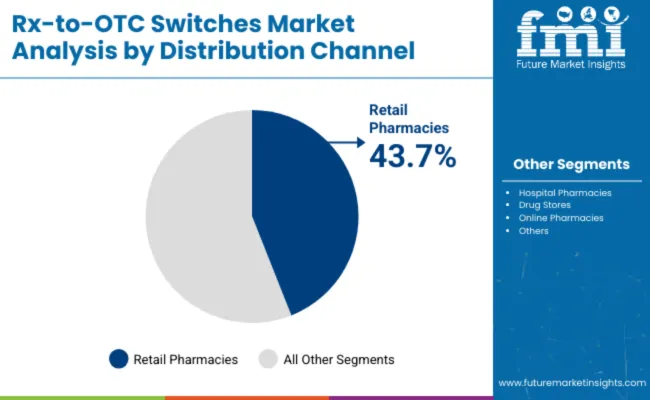
| Distribution Channel | Value Share (2024) |
|---|---|
| Retail Pharmacies | 43.7% |
Retail Pharmacies are very accessible, with most found in urban and rural areas, making it convenient to access over-the-counter drugs. Their wide reach ensures that a wide demographic can easily attain crucial treatments without having to travel far.
Retail pharmacies usually employ knowledgeable pharmacists who can provide expert advice on the use of medication, possible side effects, and interactions. The full range of products carried by pharmacies further contributes to their market leader positions. In addition to medications, they may carry other health and wellness products for consumers to fill more of their healthcare needs within a single purchase occasion. Convenience like this contributes to the consumers' experience, promotes repeat patronage, and enables it to hold dominant positions in the marketplace.
Comparative analysis of fluctuations in compound annual growth rate (CAGR) for the global Rx-to-OTC switches market between 2024 and 2025 on six months basis is shown below. By this examination, major variations in the performance of these markets are brought to light, and also trends of revenue generation are captured hence offering stakeholders useful ideas on how to carry on with the market's growth path in any other given year. January through June covers the first part of the year called half1 (H1), while half2 (H2) represents July to December
The table demonstrates the expected CAGR for the global Rx-to-OTC switches market. In the first half (H1) i.e., from 2024 to 2034, the business is projected to grow at a CAGR of 5.3%, further followed by 5.6% in the second half.
| Particular | Value CAGR |
|---|---|
| H1 | 5.3% (2024 to 2034) |
| H2 | 5.6% (2024 to 2034) |
| H1 | 5.0% (2025 to 2035) |
| H2 | 5.6% (2025 to 2035) |
Moving into the subsequent period, from H1 2025 to H2 2035, the CAGR is projected to decrease to 5.0% in the first half followed by 5.6% in the second. In the first half the market witnessed a decrease of 30 BPS while in the second, the market witnessed a decrease of 1 BPS.
Regulatory Support and Evolving Guidelines for Rx to OTC Drugs Anticipates the Growth of the Market
The USA Food and Drug Administration, which increasingly acknowledges the benefits of public health in moving specific prescription drugs into over-the-counter status. FDA has set clear rules to help ease the process: it demands exhaustive data showing a drug can be used safely and effectively without supervision from a health care provider. Evidence from clinical trials, consumer behavior studies, and post-marketing surveillance is considered
The FDA has been proactive by encouraging applications for Rx-to-OTC switches especially for drugs that treat common conditions. This changing landscape of regulation provides not only advantages to consumers but also benefits companies in the form of a single streamlined route that allows them to extend the life of their pharmaceutical products in commerce.
Companies navigating the established guidance and demonstrating consumer safety can easily transition appropriate prescription drugs to over-the-counter status, thereby making them available to a wider marketplace and furthering public health objectives.
Economic Benefits of Rx-to-OTC for Pharmaceutical Companies Anticipates the Market Growth
Transitioning a drug from prescription to over-the-counter status can extend its market lifecycle significantly, particularly close to patent expiration. This allows companies to retain market exclusivity and revenue streams in the absence of generic competition. In this regard, OTC products tend to incur lower marketing expenditures than prescription drugs since these can be accessed at the counter and are usually promoted at the point of sale.
The wider distribution channels and higher volume sales of OTC products result in higher overall profitability. Moreover, successful Rx-to-OTC switches increase the brand equity and consumer trust of a company, which further leads to customer loyalty and provides opportunities for new OTC product launches. These economic benefits encourage pharmaceutical companies to invest in the Rx-to-OTC switch process, thereby fueling market growth.
Emphasis on Expansion into Emerging Markets can bring New Business Opportunities to the Market Players
An enormous opportunity exists for the Rx-to-OTC switch industry from emerging markets, which are seen as a haven where healthcare infrastructures are on the rise with higher consumer purchasing power. Over-the-counter drugs are cheaper alternatives through which common health conditions can be treated, freeing the burden off healthcare systems while opening up healthcare access to previously restricted populations that could not gain access to service providers.
Pharmaceutical companies can seize this opportunity by identifying appropriate Rx-to-OTC switch candidates that align with the dominant health needs of emerging markets, thus expanding their global footprint and improving public health. Moreover, by partnering with local stakeholders and investing in consumer education initiatives, companies can establish trust and drive adoption of OTC products in these regions.
However, the penetration of digital technologies into emerging markets could accelerate the education of consumers and promote safety when using OTC medications, thus improving the feasibility and potential of Rx-to-OTC switches.
Potential for Misuse and Abuse of OTC Drugs Hinders the Growth of the Market
Useful concerns in the switch process include potential misuse and abuse of over-the-counter medicines. Without the monitoring of healthcare professionals, there is a tendency to misdiagnose conditions, inappropriate use of the drug, failure to notice contraindications or drug interactions. Drugs that were once prescription-only are likely to have this kind of potential because of potency or side effect profile.
These risks can be mitigated through regulatory agencies' insistence on complete consumer studies, thereby ensuring that labeling is clear and that consumers can self-select and use the product correctly. However, such requirements add complexity and cost to the Rx-to-OTC switch process, potentially deterring pharmaceutical companies from pursuing switches for certain medications. Additionally, the general feeling is that as more of some of these drugs become available over the counter, there will be greater abuses and additions, especially among substance-abusing populations.
In the context of a switch from prescription to over-the-counter, although it may promote accessibility and convenience for consumers, there is an absolute need to balance these advantages with strong controls against misuse for public safety. This includes labeling, consumer education initiatives, and ongoing monitoring of OTC medication use post-switch.
The global Rx-to-OTC switches industry recorded a CAGR of 4.2% during the historical period between 2020 and 2024. The growth of Rx-to-OTC switches industry was positive as it reached a value of USD 40,785.8 million in 2024 from USD 33,617.3 in 2020.
Switch from prescription to over-the-counter are major trends in pharmaceuticals, reflecting a change in health delivery and consumer behavior. It initially emerged with significant steam as a response to demands seeking to empower patients through self-reliant measures that would help reduce overall health costs. Medications for common conditions such as allergies, heartburn, and pain management were among the first to make this transition, enabling consumers to manage these ailments without a physician's prescription.
Such factors could include growing consumer awareness about self-care, better medical literacy, and friendly regulatory regimes. The forecasted growth is fueled by the evolving consumer preference for self-management of health that enables better self-diagnosis and treatment, and continuous innovations in pharmaceutical formulation to ensure safety and efficacy in over-the-counter settings.
Increasing healthcare awareness, rising disposable incomes, and increased access to healthcare products in emerging economies poses significant opportunities. Rx-to-OTC market has developed to an integral, high-growth segment of the industry. Continuing the paradigm shifts in healthcare toward further patient involvement and preventive activities, the role of the Rx-to-OTC switch market can become highly pivotal in the future regarding accessible health solutions.
Tier 1 companies comprise market leaders with a market revenue of above USD 100 million capturing significant market share of 46.6% in global market. These market leaders are characterized by high production capacity and a wide product portfolio. These market leaders are distinguished by their extensive expertise in providing their services underpinned by a robust consumer base. Prominent companies within tier 1 include GlaxoSmithKline Plc., Sanofi, Johnson & Johnson
Tier 2 companies include mid-size players with revenue of USD 50 to 100 million having presence in specific regions and highly influencing the local market and holds around 25.0% market share. These are characterized by a strong presence overseas and strong market knowledge. These market players have good technology and ensure regulatory compliance but may not have access to global reach. Prominent companies in tier 2 include AstraZeneca, Merck KGaA and Bayer AG
Finally, Tier 3 companies, act as a suppliers to the established market players. They are essential for the market as they specialize in specific products and cater to niche markets, adding diversity to the industry.
Overall, while Tier 1 companies are the primary drivers of the market, Tier 2 and 3 companies also make significant contributions, ensuring the Rx-to-OTC switches market remains dynamic and competitive.
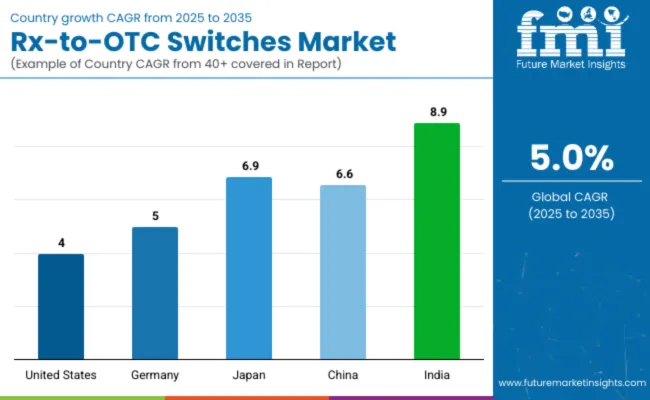
| Countries | Value CAGR (2025 to 2035) |
|---|---|
| United States | 4.0% |
| Germany | 5.0% |
| Japan | 6.9% |
| China | 6.6% |
| India | 8.9% |
The section below covers the industry analysis for the Rx-to-OTC switches market for different countries. Market demand analysis on key countries in several regions of the globe, including North America, Asia Pacific, Europe, and others, is provided. The United States is anticipated to remain at the forefront in North America, with a value share of 90.9% through 2035.
A transfer of many medicines from prescription to over-the-counter will help to reduce the general expenditure on health care. It is bound to save the consumers by virtue of saving their money on prescriptions through over-the-counter products as compared with the prescriptions and shall reduce the pressure on service providers by decreasing the frequency of routine visits arising due to common sicknesses.
The pharmaceutical industry also regards Rx-to-OTC switches as an opportunity for product life extension with strategic potential for products whose patents are close to expiration. A switch to over-the-counter enables firms to reach wider markets and continue revenue generation with long-established medications. Such a process has been made supportive, with the FDA having a clear regulatory framework calling on applications to illustrate safety and effectiveness for over-the-counter use.
The Rx-to-OTC switch also attracts the keen eye of the pharmaceutical industry in India. The companies are looking at OTC transitions with interest as the expiration of patents and increasing competition from generic drugs test their revenues, which is done as a method of sustaining revenue streams and building brand loyalty among consumers.
This also has wider resonance with the general trend of consumerism in healthcare and the move toward preventive and self-managed care. Overall, while the overall objective of improving access to medicines unites the Rx-to-OTC switch initiatives in India.
Germany is expected to have a strong foothold when it comes to technology innovation.
Rx-to-OTC switch in Germany involve a regulatory environment, consumer behavior, and healthcare system dynamics. Reclassification processes are overseen by the Federal Institute for Drugs and Medical Devices, BfArM, with the pronounced emphasis on patient safety and efficacy.
A fundamental driving factor can be viewed within the well-developed self-medication culture in this country, in which consumers demonstrate good health literacy and a tendency toward managing minor ailments on their own. This cultural trend is further encouraged by the fact that there is a strong network of pharmacies with qualified pharmacists who can advise on OTC products.
In changing the appropriate drugs to OTC status, it decreases some of the financial burdens on reimbursing prescription drugs in the system.
Additionally, the German pharmaceutical industry would have a reason to pursue Rx-to-OTC switches as one of the methods of product life cycle extension and maintenance of market share, especially in cases of patent expiration. That way, companies can retain revenues from well-established products and offer accessible treatments to consumers. The regulatory environment also justifies this approach, putting clear guidelines in place and offering a structured pathway to reclassification with safety and efficacy as top priorities.
| Report Attributes | Details |
|---|---|
| Market Size (2024) | USD 40,785.8 million |
| Current Total Market Size (2025) | USD 43,008.6 million |
| Projected Market Size (2035) | USD 70,056.5 million |
| CAGR (2025 to 2035) | 5.0% |
| Base Year for Estimation | 2024 |
| Historical Period | 2020 to 2024 |
| Projections Period | 2025 to 2035 |
| Quantitative Units | USD million for value and million packs for volume |
| Drug Categories Analyzed (Segment 1) | Allergy and Respiratory, Fungal Infections & Other Infections, Overactive Bladder, Oral Contraceptives, Gastrointestinal Drugs, Hair Loss Treatments, Smoking Cessation, Analgesic, Inflammation and Pain Management, Others |
| Distribution Channels Analyzed (Segment 2) | Retail Pharmacies, Hospital Pharmacies, Drug Stores, Online Pharmacies |
| Regions Covered | North America; Latin America; Western Europe; Eastern Europe; South Asia and Pacific; East Asia; Middle East & Africa |
| Countries Covered | United States, Canada, Mexico, Brazil, Argentina, Germany, France, United Kingdom, Italy, Spain, Netherlands, China, India, Japan, South Korea, ANZ, GCC Countries, South Africa |
| Key Players influencing the Rx-to-OTC Switches Market | GlaxoSmithKline, Sanofi, Johnson & Johnson, AstraZeneca, Merck KGaA, Bayer AG, Boehringer Ingelheim, Bausch and Lomb, Alcon, Pfizer, Galderma SA, Arbor Pharmaceuticals |
| Additional Attributes | Dollar sales by drug class (allergy, gastrointestinal, contraception), Distribution performance in retail vs online settings, Market dynamics in pain management and dermatological applications, Regulatory trends in OTC transition approvals, Regional adoption rates for OTC self-medication across chronic care and wellness categories |
| Customization and Pricing | Customization and Pricing Available on Request |
In terms of drug category, the industry is divided into Allergy and Respiratory, Fungal Infections & Other infections, Overactive Bladder, Oral Contraceptives, Gastrointestinal Drugs, Hair Loss Treatments, Smoking Cessation, Analgesic, Inflammation and pain management and others
The industry is classified by distribution channel as Retail Pharmacies, Hospital Pharmacies, Drug Stores and Online Pharmacies.
Key countries of North America, Latin America, Western Europe, Eastern Europe, East Asia, South Asia and Pacific, and Middle East and Africa (MEA) have been covered in the report.
The global Rx-to-OTC switches industry is projected to witness CAGR of 5.0% between 2025 and 2035.
The global Rx-to-OTC switches industry stood at USD 40,785.8 million in 2024.
The global Rx-to-OTC switches industry is anticipated to reach USD 70,056.5 million by 2035 end.
India is set to record the highest CAGR of 8.9% in the assessment period.
The key players operating in the global Rx-to-OTC switches industry include GlaxoSmithKline plc., Sanofi, Johnson & Johnson, Astrazeneca, Merck KGaA, Bayer AG, Boehringer Ingelheim, Bausch and Lomb, Alcon, Pfizer, Galderma SA, and Arbor Pharmaceuticals.


Our Research Products

The "Full Research Suite" delivers actionable market intel, deep dives on markets or technologies, so clients act faster, cut risk, and unlock growth.

The Leaderboard benchmarks and ranks top vendors, classifying them as Established Leaders, Leading Challengers, or Disruptors & Challengers.

Locates where complements amplify value and substitutes erode it, forecasting net impact by horizon

We deliver granular, decision-grade intel: market sizing, 5-year forecasts, pricing, adoption, usage, revenue, and operational KPIs—plus competitor tracking, regulation, and value chains—across 60 countries broadly.

Spot the shifts before they hit your P&L. We track inflection points, adoption curves, pricing moves, and ecosystem plays to show where demand is heading, why it is changing, and what to do next across high-growth markets and disruptive tech

Real-time reads of user behavior. We track shifting priorities, perceptions of today’s and next-gen services, and provider experience, then pace how fast tech moves from trial to adoption, blending buyer, consumer, and channel inputs with social signals (#WhySwitch, #UX).

Partner with our analyst team to build a custom report designed around your business priorities. From analysing market trends to assessing competitors or crafting bespoke datasets, we tailor insights to your needs.
Supplier Intelligence
Discovery & Profiling
Capacity & Footprint
Performance & Risk
Compliance & Governance
Commercial Readiness
Who Supplies Whom
Scorecards & Shortlists
Playbooks & Docs
Category Intelligence
Definition & Scope
Demand & Use Cases
Cost Drivers
Market Structure
Supply Chain Map
Trade & Policy
Operating Norms
Deliverables
Buyer Intelligence
Account Basics
Spend & Scope
Procurement Model
Vendor Requirements
Terms & Policies
Entry Strategy
Pain Points & Triggers
Outputs
Pricing Analysis
Benchmarks
Trends
Should-Cost
Indexation
Landed Cost
Commercial Terms
Deliverables
Brand Analysis
Positioning & Value Prop
Share & Presence
Customer Evidence
Go-to-Market
Digital & Reputation
Compliance & Trust
KPIs & Gaps
Outputs
Full Research Suite comprises of:
Market outlook & trends analysis
Interviews & case studies
Strategic recommendations
Vendor profiles & capabilities analysis
5-year forecasts
8 regions and 60+ country-level data splits
Market segment data splits
12 months of continuous data updates
DELIVERED AS:
PDF EXCEL ONLINE
RF Switches Market Size and Share Forecast Outlook 2025 to 2035
Level Switches Market Growth - Trends & Forecast 2025 to 2035
Safety Switches Market Trends – Growth & Forecast 2025 to 2035
Vacuum Switches Market
Optical Switches Market Analysis by Type, Application & Region through 2035
Electric Switches Market Insights – Growth & Forecast 2025 to 2035
Aircraft Switches Market
Market Share Breakdown of Rx-to-OTC Switches Manufacturers
Oil Level Switches Market
Navigation Switches Market Size and Share Forecast Outlook 2025 to 2035
Load Break Switches Market Size, Growth, and Forecast 2025 to 2035
Disconnect Switches Market Growth - Trends & Forecast 2025 to 2035
Power Load Switches Market
Float Level Switches Market Size and Share Forecast Outlook 2025 to 2035
Railway Roof Switches Market Size and Share Forecast Outlook 2025 to 2035
Safety Limit Switches Market Size and Share Forecast Outlook 2025 to 2035
Rotary Limit Switches Market Growth - Trends & Forecast 2025 to 2035
Light Control Switches Market Size and Share Forecast Outlook 2025 to 2035
5G Solid State Switches Market Size and Share Forecast Outlook 2025 to 2035
Car Power Seat Switches Market Size and Share Forecast Outlook 2025 to 2035

Thank you!
You will receive an email from our Business Development Manager. Please be sure to check your SPAM/JUNK folder too.
Chat With
MaRIA