Reports

- Global Locations -

Headquarters

Future Market Insights, Inc.

Christiana Corporate, 200
Continental Drive, Suite 401,
Newark, Delaware - 19713,
United States

T: +1-845-579-5705

Americas

Future Market Insights, Inc.

616 Corporate Way, Suite 2-9018,
Valley Cottage, NY 10989, United States

T: +1-347-918-3531

MEA

Future Market Insights

1602-6 Jumeirah Bay X2 Tower, Plot No: JLT-PH2-X2A,
Jumeirah Lakes Towers, Dubai,
United Arab Emirates

Europe

Future Market Insights

3rd Floor, 207 Regent Street,
W1B 3HH London
United Kingdom

T: + 44 (0) 20 8123 9659
D: +44 (0) 20 3287 4268

Asia Pacific

Future Market Insights

IndiaLand Global Tech Park, Unit UG-1, Behind Grand HighStreet, Phase 1, Hinjawadi, MH, Pune – 411057, India

Navigation Switches Market Outlook (2022-2032)

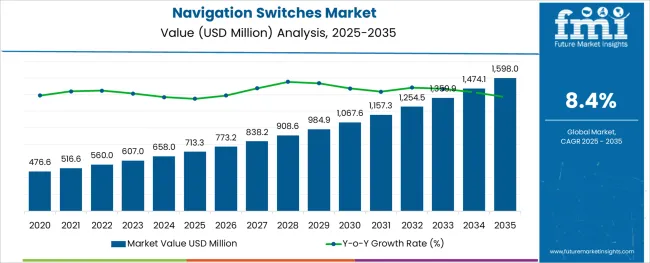
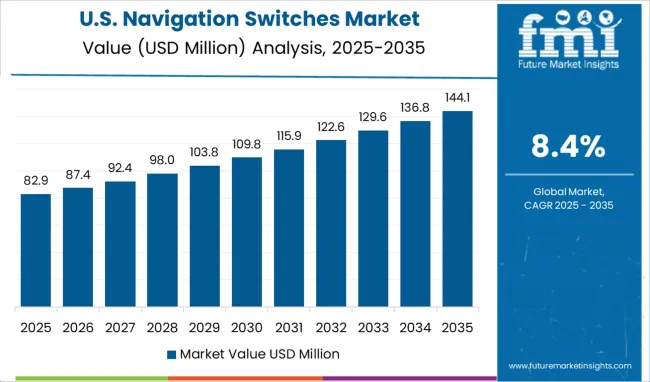
[323 Pages Report] The global navigation switches market holds a forecasted share of US$ 560 million in 2022 and is likely to surpass US$ 1250 million by 2032, moving ahead with a CAGR of 8.4% during the forecast period (2022-2032).

Report Attribute Details
Navigation Switches Market Value (2022) US$ 560 million
Navigation Switches Market Anticipated Forecast Value (2032) US$ 1250 million
Navigation Switches Market Projected Growth Rate (2022-2032) 8.4%

Several factors are expected to drive the growth of the global navigation switches market. One of the major growth factors for the navigation switch market is the increase in demand for automotive safety systems. As vehicles become safer and more secure, manufacturers are increasingly integrating advanced technologies to enhance safety.

A growing inclination among vendors towards safety is expected to boost revenue growth in the navigation switches market in the coming years. The shift in vehicle manufacturers' focus toward safety and the increasing popularity of multi-functional gaming consoles are the main factors driving the market for navigation switches.

The safety of customers is of primary importance, so vendors are integrating systems designed to prevent potentially dangerous situations for passengers and their vehicles. The most common safety systems embedded in automobiles include anti-pinch windows and driver assistance systems such as radar systems, cameras, and communication devices.

Don't pay for what you don't need

Customize your report by selecting specific countries or regions and save 30%!

What are the Driving Factors in the Navigation Switches Market?

There is also an increasing demand for fly-by-wire technology. As a result of fly-by-wire technology, aircraft weight is reduced, costs are reduced, communication is simplified, and maintenance is simplified, and so on. As the adoption of fly-by-wire aircraft increases, the market for navigation switches is expected to grow exponentially in the coming year.

The growing demand for navigation switches in the consumer electronics industry is another factor driving the growth of this market. Increasing the use of navigation switches in smart homes and smart cities will also drive this market's growth.

As smart wearable devices such as smartwatches continue to make technological advances, such as increasing the use of navigation switches in wearable devices will be driven by rising technology.

Consequently, navigation switches are having a significant contribution to the popularity in different sectors and thus drive the global navigation switches market growth for them.

The economic growth of the navigation switches market is being slowed by the increasing use of smartphones and tablets for gaming. Due to its cost-effectiveness, gamers are turning to smartphones. Mobile gaming may stifle the growth of navigation switches as the trend of gaming on smartphones increases.
Regional Analysis

What is the Regional Outlook for the North American Navigation Switches Market?

North America is the largest contributor to navigation switches and is expected to capture the largest market share based on the current market scenario.

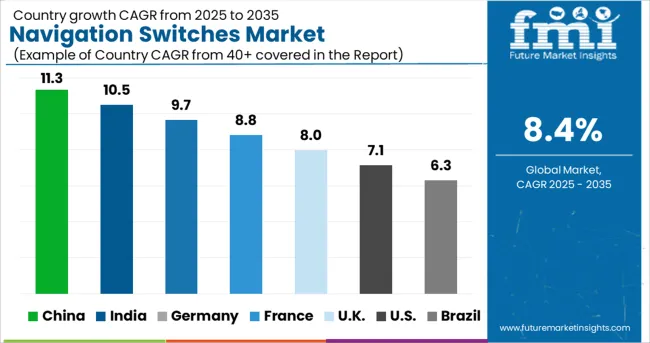
North America is estimated to hold a significant share of 26.2% in the navigation switches market. In North America, the high focus is on safety, with a high inclination toward innovations obtained from Research and Development (R&D).

Additionally, North America's high concentration of market players and easy access to technical expertise contribute to the high demand for navigation switches.

What is the Regional Outlook for European Navigation Switches Market?

The European navigation switches market has a global market share accounting for 18.9%. The region is expected to increase its share during the forecast period owing to exposure to the aerospace industry and mobile & internet technology in higher usage of navigation switches.

What is the Regional Outlook for Asia Pacific Navigation Switches Market?

APAC has the highest number of smartphone shipments due to the emergence of these mobile devices as a gaming platform. The growing demand for LED TVs and PS-based games will significantly contribute to the growth of the navigation ;switch market in the APAC region.

For the last two years, the region has dominated the navigation switches market. As to increase their cost-effectiveness, the vendors are focusing on setting up their manufacturing facilities in APAC.
Sudip Saha
Sudip Saha

Principal Consultant

Talk to Analyst

Find your sweet spots for generating winning opportunities in this market.

Who are the Key Players in the Navigation Switches Market?

Due to the presence of a limited number of established players, the navigation switch market is moderately concentrated. Several vendors compete fiercely based on availability, price, quality, and size in the market.

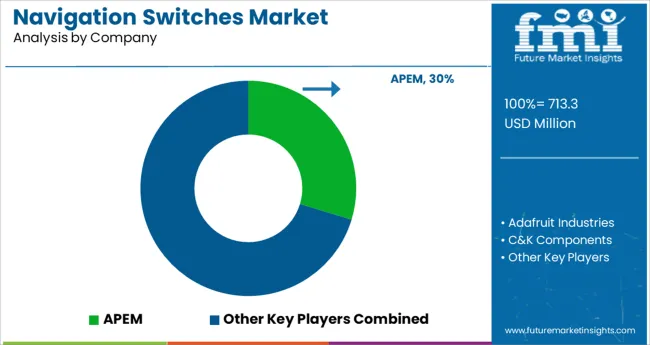
The key vendors in the global navigation switch market are Adafruit Industries, GPS, Marine Navigation System, Inertial Navigation System, Surgical Navigation System, Robotic Navigation, APEM, C&K Components, E-Switch, Grayhill and others. Collaborating with other players in the navigation switches market is the key strategy followed by major market vendors to gain a competitive edge.

How is the Start-up Ecosystem in the Navigation Switches Market?

As navigation switches are operating in multiple product lines and catering to multiple industries, some niche players serve a limited segment of consumers and the defense industry.

  • Honeywell launches new products to increase productivity and efficiency across the supply chains.
  • Northrop Grumman is ready to acquire the company i.e., Rival Orbital.
  • Arista Networks announced the acquisition of Big Switch Networks on 13th February 2020, an SDN (Software Defined Networking) pioneer. Arista's software platform CloudVision and DANZ (Data Analyzer) capabilities will be strengthened by the acquisition of Big Switch.
  • Juniper Networks announced on 7th December 2020 that it has entered into a definitive agreement to acquire Apstra, a leader in intent-based networking and automated closed-loop assurance. By using AI-driven automation, Juniper is changing the way networks are built, operated, and secured in the cloud era.

Get the data you need at a Fraction of the cost

Personalize your report by choosing insights you need
and save 40%!

Report Scope

Report Attribute Details
Growth Rate CAGR of 8.4 % from 2022 to 2032
Base Year for Estimation 2022
Historical Data 2016-2021
Forecast Period 2022-2032
Quantitative Units Revenue in USD Million and CAGR from 2022-2032
Report Coverage Revenue Forecast, Volume Forecast, Company Ranking, Competitive Landscape, Growth Factors, Trends and Pricing Analysis
Segments Covered By Type; By Application; By Sales Channel; Region Forecast till 2032
Countries Covered North America; Europe; APEJ; The Latin America; MEA
Key Companies Profiled Adafruit Industries; GPS; Marine Navigation System; Inertial Navigation System; Surgical Navigation System; Robotic Navigation; APEM; C&K Components; E-Switch; Grayhill
Customization Available Upon Request

Key Segments

By Type:

  • 5-Way
  • 4-Way

By Application:

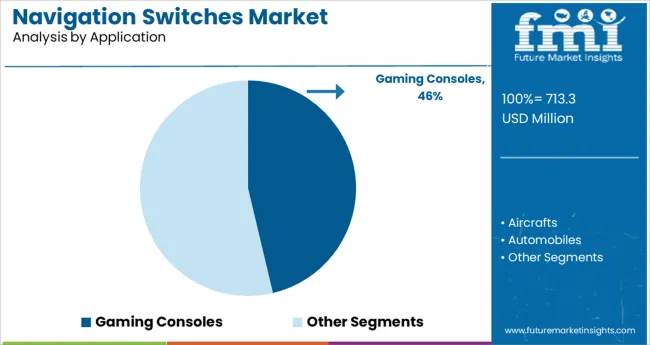
  • Gaming Consoles
  • Aircraft
  • Automobiles

By Sales Channel:

  • Direct
  • Indirect

By Region:

  • North America
  • Latin America
  • Europe
  • Asia Pacific
  • MEA

Frequently Asked Questions

How is the Navigation Switches Market Growing?

The navigation switches market is expected to grow at a CAGR of 8.4% through 2032.

What is the Growth Potential of the Navigation Switches Market?

The growth potential of the navigation switches market can value at US$ 1250 Mn by 2032.

What is the size of the Navigation Switches Market?

The navigation switches market is projected to grow by US$ 560 million in 2022.

Which Region Dominates the Navigation Switches Market?

The Asia Pacific region dominates the Navigation switches market.

Table of Content

1. Executive Summary

    1.1. Global Market Outlook

    1.2. Demand-side Trends

    1.3. Supply-side Trends

    1.4. Technology Roadmap Analysis

    1.5. Analysis and Recommendations

2. Market Overview

    2.1. Market Coverage / Taxonomy

    2.2. Market Definition / Scope / Limitations

3. Market Background

    3.1. Market Dynamics

        3.1.1. Drivers

        3.1.2. Restraints

        3.1.3. Opportunity

        3.1.4. Trends

    3.2. Scenario Forecast

        3.2.1. Demand in Optimistic Scenario

        3.2.2. Demand in Likely Scenario

        3.2.3. Demand in Conservative Scenario

    3.3. Opportunity Map Analysis

    3.4. Product Life Cycle Analysis

    3.5. Investment Feasibility Matrix

    3.6. PESTLE and Porter’s Analysis

    3.7. Regulatory Landscape

        3.7.1. By Key Regions

        3.7.2. By Key Countries

    3.8. Regional Parent Market Outlook

4. Global Navigation Switches Market Analysis 2017-2021 and Forecast, 2022-2032

    4.1. Historical Market Size Value (US$ Mn) Analysis, 2017-2021

    4.2. Current and Future Market Size Value (US$ Mn) Projections, 2022-2032

        4.2.1. Y-o-Y Growth Trend Analysis

        4.2.2. Absolute $ Opportunity Analysis

5. Global Navigation Switches Market Analysis 2017-2021 and Forecast 2022-2032, By Application

    5.1. Introduction / Key Findings

    5.2. Historical Market Size Value (US$ Mn) Analysis By Application, 2017-2021

    5.3. Current and Future Market Size Value (US$ Mn) Analysis and Forecast By Application, 2022-2032

        5.3.1. Aircrafts

        5.3.2. Gaming Consoles

        5.3.3. Automobiles

        5.3.4. Others

    5.4. Y-o-Y Growth Trend Analysis By Application, 2017-2021

    5.5. Absolute $ Opportunity Analysis By Application, 2022-2032

6. Global Navigation Switches Market Analysis 2017-2021 and Forecast 2022-2032, By Region

    6.1. Introduction

    6.2. Historical Market Size Value (US$ Mn) Analysis By Region, 2017-2021

    6.3. Current Market Size Value (US$ Mn) Analysis and Forecast By Region, 2022-2032

        6.3.1. North America

        6.3.2. Latin America

        6.3.3. Europe

        6.3.4. Asia Pacific

        6.3.5. Middle East and Africa

    6.4. Market Attractiveness Analysis By Region

7. North America Navigation Switches Market Analysis 2017-2021 and Forecast 2022-2032, By Country

    7.1. Historical Market Size Value (US$ Mn) Trend Analysis By Market Taxonomy, 2017-2021

    7.2. Market Size Value (US$ Mn) Forecast By Market Taxonomy, 2022-2032

        7.2.1. By Country

            7.2.1.1. U.S.

            7.2.1.2. Canada

        7.2.2. By Application

    7.3. Market Attractiveness Analysis

        7.3.1. By Country

        7.3.2. By Application

    7.4. Key Takeaways

8. Latin America Navigation Switches Market Analysis 2017-2021 and Forecast 2022-2032, By Country

    8.1. Historical Market Size Value (US$ Mn) Trend Analysis By Market Taxonomy, 2017-2021

    8.2. Market Size Value (US$ Mn) Forecast By Market Taxonomy, 2022-2032

        8.2.1. By Country

            8.2.1.1. Brazil

            8.2.1.2. Mexico

            8.2.1.3. Rest of Latin America

        8.2.2. By Application

    8.3. Market Attractiveness Analysis

        8.3.1. By Country

        8.3.2. By Application

    8.4. Key Takeaways

9. Europe Navigation Switches Market Analysis 2017-2021 and Forecast 2022-2032, By Country

    9.1. Historical Market Size Value (US$ Mn) Trend Analysis By Market Taxonomy, 2017-2021

    9.2. Market Size Value (US$ Mn) Forecast By Market Taxonomy, 2022-2032

        9.2.1. By Country

            9.2.1.1. Germany

            9.2.1.2. U.K.

            9.2.1.3. France

            9.2.1.4. Spain

            9.2.1.5. Italy

            9.2.1.6. Russia

            9.2.1.7. Rest of Europe

        9.2.2. By Application

    9.3. Market Attractiveness Analysis

        9.3.1. By Country

        9.3.2. By Application

    9.4. Key Takeaways

10. Asia Pacific Navigation Switches Market Analysis 2017-2021 and Forecast 2022-2032, By Country

    10.1. Historical Market Size Value (US$ Mn) Trend Analysis By Market Taxonomy, 2017-2021

    10.2. Market Size Value (US$ Mn) Forecast By Market Taxonomy, 2022-2032

        10.2.1. By Country

            10.2.1.1. China

            10.2.1.2. Japan

            10.2.1.3. India

            10.2.1.4. South Korea

            10.2.1.5. Australia

            10.2.1.6. Rest of APAC

        10.2.2. By Application

    10.3. Market Attractiveness Analysis

        10.3.1. By Country

        10.3.2. By Application

    10.4. Key Takeaways

11. Middle East and Africa Navigation Switches Market Analysis 2017-2021 and Forecast 2022-2032, By Country

    11.1. Historical Market Size Value (US$ Mn) Trend Analysis By Market Taxonomy, 2017-2021

    11.2. Market Size Value (US$ Mn) Forecast By Market Taxonomy, 2022-2032

        11.2.1. By Country

            11.2.1.1. South Africa

            11.2.1.2. Saudi Arabia

            11.2.1.3. UAE

            11.2.1.4. Israel

            11.2.1.5. Rest of MEA

        11.2.2. By Application

    11.3. Market Attractiveness Analysis

        11.3.1. By Country

        11.3.2. By Application

    11.4. Key Takeaways

12. Key Countries Navigation Switches Market Analysis

    12.1. U.S.

        12.1.1. Pricing Analysis

        12.1.2. Market Share Analysis, 2021

            12.1.2.1. By Application

    12.2. Canada

        12.2.1. Pricing Analysis

        12.2.2. Market Share Analysis, 2021

            12.2.2.1. By Application

    12.3. Brazil

        12.3.1. Pricing Analysis

        12.3.2. Market Share Analysis, 2021

            12.3.2.1. By Application

    12.4. Mexico

        12.4.1. Pricing Analysis

        12.4.2. Market Share Analysis, 2021

            12.4.2.1. By Application

    12.5. Germany

        12.5.1. Pricing Analysis

        12.5.2. Market Share Analysis, 2021

            12.5.2.1. By Application

    12.6. U.K.

        12.6.1. Pricing Analysis

        12.6.2. Market Share Analysis, 2021

            12.6.2.1. By Application

    12.7. France

        12.7.1. Pricing Analysis

        12.7.2. Market Share Analysis, 2021

            12.7.2.1. By Application

    12.8. Spain

        12.8.1. Pricing Analysis

        12.8.2. Market Share Analysis, 2021

            12.8.2.1. By Application

    12.9. Italy

        12.9.1. Pricing Analysis

        12.9.2. Market Share Analysis, 2021

            12.9.2.1. By Application

    12.10. Russia

        12.10.1. Pricing Analysis

        12.10.2. Market Share Analysis, 2021

            12.10.2.1. By Application

    12.11. China

        12.11.1. Pricing Analysis

        12.11.2. Market Share Analysis, 2021

            12.11.2.1. By Application

    12.12. Japan

        12.12.1. Pricing Analysis

        12.12.2. Market Share Analysis, 2021

            12.12.2.1. By Application

    12.13. India

        12.13.1. Pricing Analysis

        12.13.2. Market Share Analysis, 2021

            12.13.2.1. By Application

    12.14. South Korea

        12.14.1. Pricing Analysis

        12.14.2. Market Share Analysis, 2021

            12.14.2.1. By Application

    12.15. Australia

        12.15.1. Pricing Analysis

        12.15.2. Market Share Analysis, 2021

            12.15.2.1. By Application

    12.16. South Africa

        12.16.1. Pricing Analysis

        12.16.2. Market Share Analysis, 2021

            12.16.2.1. By Application

    12.17. Saudi Arabia

        12.17.1. Pricing Analysis

        12.17.2. Market Share Analysis, 2021

            12.17.2.1. By Application

    12.18. UAE

        12.18.1. Pricing Analysis

        12.18.2. Market Share Analysis, 2021

            12.18.2.1. By Application

    12.19. Israel

        12.19.1. Pricing Analysis

        12.19.2. Market Share Analysis, 2021

            12.19.2.1. By Application

13. Market Structure Analysis

    13.1. Competition Dashboard

    13.2. Competition Benchmarking

    13.3. Market Share Analysis of Top Players

        13.3.1. By Regional

        13.3.2. By Application

14. Competition Analysis

    14.1. Competition Deep Dive

        14.1.1. Adafruit Industries

            14.1.1.1. Overview

            14.1.1.2. Product Portfolio

            14.1.1.3. Profitability by Market Segments

            14.1.1.4. Sales Footprint

            14.1.1.5. Strategy Overview

                14.1.1.5.1. Marketing Strategy

        14.1.2. APEM

            14.1.2.1. Overview

            14.1.2.2. Product Portfolio

            14.1.2.3. Profitability by Market Segments

            14.1.2.4. Sales Footprint

            14.1.2.5. Strategy Overview

                14.1.2.5.1. Marketing Strategy

        14.1.3. C&K Components

            14.1.3.1. Overview

            14.1.3.2. Product Portfolio

            14.1.3.3. Profitability by Market Segments

            14.1.3.4. Sales Footprint

            14.1.3.5. Strategy Overview

                14.1.3.5.1. Marketing Strategy

        14.1.4. E-Switch

            14.1.4.1. Overview

            14.1.4.2. Product Portfolio

            14.1.4.3. Profitability by Market Segments

            14.1.4.4. Sales Footprint

            14.1.4.5. Strategy Overview

                14.1.4.5.1. Marketing Strategy

        14.1.5. Grayhill

            14.1.5.1. Overview

            14.1.5.2. Product Portfolio

            14.1.5.3. Profitability by Market Segments

            14.1.5.4. Sales Footprint

            14.1.5.5. Strategy Overview

                14.1.5.5.1. Marketing Strategy

15. Assumptions & Acronyms Used

16. Research Methodology

List of Tables

Table 1: Global Navigation Switches Market Value (US$ Mn) Forecast by Region, 2017-2032

Table 2: Global Navigation Switches Market Value (US$ Mn) Forecast by Application, 2017-2032

Table 3: North America Navigation Switches Market Value (US$ Mn) Forecast by Country, 2017-2032

Table 4: North America Navigation Switches Market Value (US$ Mn) Forecast by Application, 2017-2032

Table 5: Latin America Navigation Switches Market Value (US$ Mn) Forecast by Country, 2017-2032

Table 6: Latin America Navigation Switches Market Value (US$ Mn) Forecast by Application, 2017-2032

Table 7: Europe Navigation Switches Market Value (US$ Mn) Forecast by Country, 2017-2032

Table 8: Europe Navigation Switches Market Value (US$ Mn) Forecast by Application, 2017-2032

Table 9: Asia Pacific Navigation Switches Market Value (US$ Mn) Forecast by Country, 2017-2032

Table 10: Asia Pacific Navigation Switches Market Value (US$ Mn) Forecast by Application, 2017-2032

Table 11: Middle East and Africa Navigation Switches Market Value (US$ Mn) Forecast by Country, 2017-2032

Table 12: Middle East and Africa Navigation Switches Market Value (US$ Mn) Forecast by Application, 2017-2032

List of Charts

Figure 1: Global Navigation Switches Market Value (US$ Mn) by Application, 2022-2032

Figure 2: Global Navigation Switches Market Value (US$ Mn) by Region, 2022-2032

Figure 3: Global Navigation Switches Market Value (US$ Mn) Analysis by Region, 2017-2032

Figure 4: Global Navigation Switches Market Value Share (%) and BPS Analysis by Region, 2022-2032

Figure 5: Global Navigation Switches Market Y-o-Y Growth (%) Projections by Region, 2022-2032

Figure 6: Global Navigation Switches Market Value (US$ Mn) Analysis by Application, 2017-2032

Figure 7: Global Navigation Switches Market Value Share (%) and BPS Analysis by Application, 2022-2032

Figure 8: Global Navigation Switches Market Y-o-Y Growth (%) Projections by Application, 2022-2032

Figure 9: Global Navigation Switches Market Attractiveness by Application, 2022-2032

Figure 10: Global Navigation Switches Market Attractiveness by Region, 2022-2032

Figure 11: North America Navigation Switches Market Value (US$ Mn) by Application, 2022-2032

Figure 12: North America Navigation Switches Market Value (US$ Mn) by Country, 2022-2032

Figure 13: North America Navigation Switches Market Value (US$ Mn) Analysis by Country, 2017-2032

Figure 14: North America Navigation Switches Market Value Share (%) and BPS Analysis by Country, 2022-2032

Figure 15: North America Navigation Switches Market Y-o-Y Growth (%) Projections by Country, 2022-2032

Figure 16: North America Navigation Switches Market Value (US$ Mn) Analysis by Application, 2017-2032

Figure 17: North America Navigation Switches Market Value Share (%) and BPS Analysis by Application, 2022-2032

Figure 18: North America Navigation Switches Market Y-o-Y Growth (%) Projections by Application, 2022-2032

Figure 19: North America Navigation Switches Market Attractiveness by Application, 2022-2032

Figure 20: North America Navigation Switches Market Attractiveness by Country, 2022-2032

Figure 21: Latin America Navigation Switches Market Value (US$ Mn) by Application, 2022-2032

Figure 22: Latin America Navigation Switches Market Value (US$ Mn) by Country, 2022-2032

Figure 23: Latin America Navigation Switches Market Value (US$ Mn) Analysis by Country, 2017-2032

Figure 24: Latin America Navigation Switches Market Value Share (%) and BPS Analysis by Country, 2022-2032

Figure 25: Latin America Navigation Switches Market Y-o-Y Growth (%) Projections by Country, 2022-2032

Figure 26: Latin America Navigation Switches Market Value (US$ Mn) Analysis by Application, 2017-2032

Figure 27: Latin America Navigation Switches Market Value Share (%) and BPS Analysis by Application, 2022-2032

Figure 28: Latin America Navigation Switches Market Y-o-Y Growth (%) Projections by Application, 2022-2032

Figure 29: Latin America Navigation Switches Market Attractiveness by Application, 2022-2032

Figure 30: Latin America Navigation Switches Market Attractiveness by Country, 2022-2032

Figure 31: Europe Navigation Switches Market Value (US$ Mn) by Application, 2022-2032

Figure 32: Europe Navigation Switches Market Value (US$ Mn) by Country, 2022-2032

Figure 33: Europe Navigation Switches Market Value (US$ Mn) Analysis by Country, 2017-2032

Figure 34: Europe Navigation Switches Market Value Share (%) and BPS Analysis by Country, 2022-2032

Figure 35: Europe Navigation Switches Market Y-o-Y Growth (%) Projections by Country, 2022-2032

Figure 36: Europe Navigation Switches Market Value (US$ Mn) Analysis by Application, 2017-2032

Figure 37: Europe Navigation Switches Market Value Share (%) and BPS Analysis by Application, 2022-2032

Figure 38: Europe Navigation Switches Market Y-o-Y Growth (%) Projections by Application, 2022-2032

Figure 39: Europe Navigation Switches Market Attractiveness by Application, 2022-2032

Figure 40: Europe Navigation Switches Market Attractiveness by Country, 2022-2032

Figure 41: Asia Pacific Navigation Switches Market Value (US$ Mn) by Application, 2022-2032

Figure 42: Asia Pacific Navigation Switches Market Value (US$ Mn) by Country, 2022-2032

Figure 43: Asia Pacific Navigation Switches Market Value (US$ Mn) Analysis by Country, 2017-2032

Figure 44: Asia Pacific Navigation Switches Market Value Share (%) and BPS Analysis by Country, 2022-2032

Figure 45: Asia Pacific Navigation Switches Market Y-o-Y Growth (%) Projections by Country, 2022-2032

Figure 46: Asia Pacific Navigation Switches Market Value (US$ Mn) Analysis by Application, 2017-2032

Figure 47: Asia Pacific Navigation Switches Market Value Share (%) and BPS Analysis by Application, 2022-2032

Figure 48: Asia Pacific Navigation Switches Market Y-o-Y Growth (%) Projections by Application, 2022-2032

Figure 49: Asia Pacific Navigation Switches Market Attractiveness by Application, 2022-2032

Figure 50: Asia Pacific Navigation Switches Market Attractiveness by Country, 2022-2032

Figure 51: Middle East and Africa Navigation Switches Market Value (US$ Mn) by Application, 2022-2032

Figure 52: Middle East and Africa Navigation Switches Market Value (US$ Mn) by Country, 2022-2032

Figure 53: Middle East and Africa Navigation Switches Market Value (US$ Mn) Analysis by Country, 2017-2032

Figure 54: Middle East and Africa Navigation Switches Market Value Share (%) and BPS Analysis by Country, 2022-2032

Figure 55: Middle East and Africa Navigation Switches Market Y-o-Y Growth (%) Projections by Country, 2022-2032

Figure 56: Middle East and Africa Navigation Switches Market Value (US$ Mn) Analysis by Application, 2017-2032

Figure 57: Middle East and Africa Navigation Switches Market Value Share (%) and BPS Analysis by Application, 2022-2032

Figure 58: Middle East and Africa Navigation Switches Market Y-o-Y Growth (%) Projections by Application, 2022-2032

Figure 59: Middle East and Africa Navigation Switches Market Attractiveness by Application, 2022-2032

Figure 60: Middle East and Africa Navigation Switches Market Attractiveness by Country, 2022-2032

Explore Technology Insights

View Reports

Navigation Switches Market