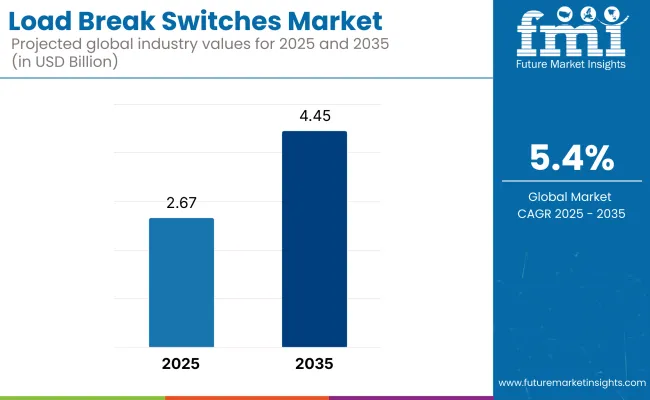
The global load break switches market is expected to be valued at USD 2.67 billion in 2025 and reach USD 4.45 billion by 2035, growing at a CAGR of 5.4% during the forecast period. Growth is driven by modernization of ageing power grids, increased renewable energy adoption, and smart grid infrastructure upgrades across North America, Europe, and Asia.

China and the United States are projected to remain the largest markets, with China expanding fastest due to aggressive electrification policies under the "Made in China 2025" initiative. Meanwhile, countries like Germany and South Korea are spearheading compact switchgear innovation.
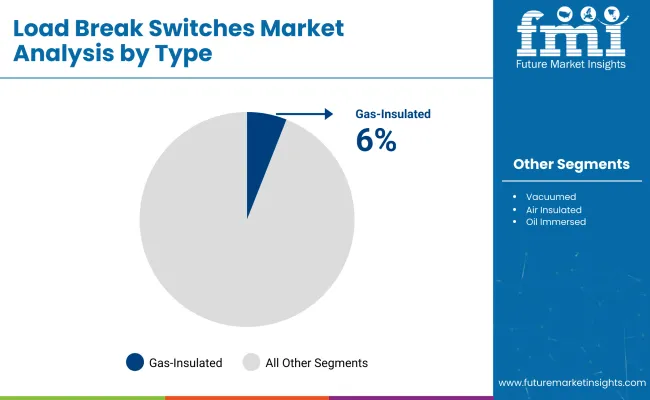
Key demand drivers include rising investments in smart grids, the shift toward decentralized energy generation, and increasing electrification across industrial applications. Gas-insulated load break switches are gaining market dominance due to superior arc-quenching capabilities, compact design, and high voltage performance.
Utilities are the primary end users, accounting for a significant share of switch installations, especially for remote-controlled and IoT-enabled units. However, challenges persist around raw material cost volatility (especially copper), supply chain fragmentation, and region-specific compliance hurdles.
From 2025 onward, the industry is expected to experience rapid evolution, with a stronger push toward SF6-free, eco-friendly switchgear, increased R&D spending on predictive maintenance solutions, and growing traction in industrial automation.
Manufacturers are pursuing region-specific strategies: automation-led portfolios in the USA, recyclable switchgear in Europe, and cost-effective, compact designs in Japan and South Korea. Partnerships, acquisitions, and production shifts to APAC are reshaping the competitive landscape.
In addition, the regulatory environment is playing a pivotal role in shaping market dynamics and innovation cycles. Stricter safety and energy efficiency standards across regions-such as IEEE and OSHA compliance in the USA, CE and IEC directives in Europe, and JIS/KC certifications in Japan and South Korea-are compelling manufacturers to continuously upgrade their product portfolios.
This regulatory push is also accelerating the adoption of digital switchgear with integrated monitoring and fault detection capabilities. As countries advance their decarbonization goals, particularly through grid modernization and renewable energy expansion, demand for high-performance, environmentally compliant load break switches is set to rise sharply, creating new opportunities for technology-first players.

Gas-insulated load break switches will be the most dominant segment due to their superior performance in compact and high-voltage environments. Utilities and large-scale substations prefer these switches for their high arc-quenching capacity and minimal maintenance.
As renewable energy projects expand, especially solar and wind farms, demand for durable, space-efficient solutions will increase. Vacuum switches are also gaining traction, driven by safety and environmental compliance due to zero SF₆ emissions. Air-insulated variants remain cost-effective choices for medium-voltage networks. Oil-immersed switches will maintain niche relevance, especially in older rural grids with exposure to harsh environments.

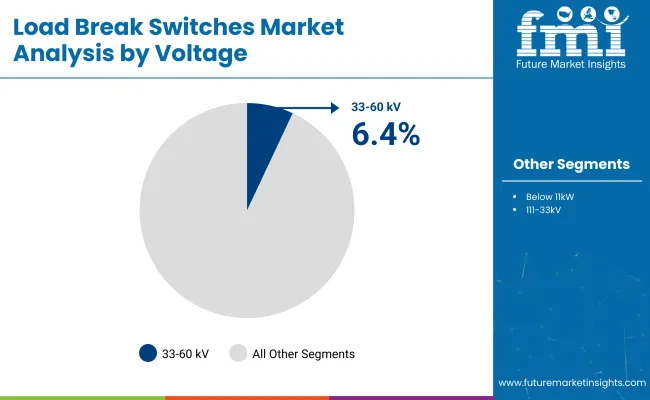
The 33-60 kV voltage range will register the fastest growth as power grids are upgraded to handle larger, more decentralized loads. These switches are critical for heavy-duty industrial zones, high-capacity substations, and utility-scale renewable projects. Countries upgrading national transmission infrastructure-like China, Germany, and India-are expected to drive demand.
While <11 kV switches remain dominant for localized commercial or industrial applications, the 11-33 kV range will grow steadily due to its fit for medium-scale renewables. Growth in this segment will also reflect higher investment in resilient, automated smart grids.
load-break-switches-by-voltage
The industrial sector is set to be the fastest-growing end-use category due to rising investments in automation, smart manufacturing, and grid-connected industrial systems. Load break switches are critical in managing the complex, high-load electrical environments of manufacturing plants, refineries, and mining operations.
With growing emphasis on energy efficiency and downtime reduction, industries are adopting smart switchgear with predictive diagnostics. Utilities will continue to dominate in volume, driven by national grid modernization plans and renewable integration. Meanwhile, the commercial segment will gain traction from the expansion of data centers, hospitals, and urban megaprojects requiring stable and automated distribution networks.
(Surveyed Q4 2024, n=450 stakeholder participants evenly distributed across manufacturers, distributors, and end-users in the USA, Western Europe, Japan, and South Korea)
Regional Variance
High Variance
ROI Perspectives
Consensus
Regional Variance
Shared Concerns
Regional Differences
Manufacturers
Distributors
End-Users
Global Trends
Regional Focus Areas
Regulatory Landscape & Compliance Challenges
High Consensus: Safety, grid automation, and durability remain universal priorities.
Key Variances
A one-size-fits-all strategy won’t work-companies must tailor product portfolios to regional demands (e.g., automation-driven growth in the US, sustainable designs in Europe, compact solutions in Asia).
| Country/Region | Government Regulations & Mandatory Certifications |
|---|---|
| United States | Regulatory Bodies: OSHA (Occupational Safety and Health Administration), IEEE (Institute of Electrical and Electronics Engineers), and ANSI (American National Standards Institute). - Key Regulations: Compliance with IEEE C37.20.4 (standards for medium-voltage switchgear) and OSHA electrical safety standards. - Certifications: UL (Underwriters Laboratories) and ANSI C37.20.3 for load break switches in industrial and utility applications. |
| Western Europe | Regulatory Bodies: European Committee for Electrotechnical Standardization (CENELEC), International Electrotechnical Commission (IEC), and the EU Energy Efficiency Directives. - Key Regulations: Compliance with IEC 62271-103 (switchgear and control gear for medium-voltage applications). - Certifications: CE Marking is mandatory for all electrical switchgear to meet EU safety and performance standards. - Sustainability Focus: The EU’s Eco-design Directive promotes energy-efficient switchgear, impacting material selection and product design. |
| Japan | Regulatory Bodies: Japan Electrical Manufacturers’ Association (JEMA) and Ministry of Economy, Trade, and Industry (METI). - Key Regulations: Compliance with JIS C 4600 (Japanese Industrial Standards for high-voltage switchgear). - Certifications: PSE (Product Safety Electrical Appliance & Material Act) certification is required for electrical components, including load break switches. - Market Challenges: Japan’s regulations are stricter on compact and space-efficient designs, given urban infrastructure constraints. |
| South Korea | Regulatory Bodies: Korea Electrical Safety Corporation (KESCO) and Korea Industrial Standards (KS). - Key Regulations: Compliance with KS C IEC 62271 (safety standards for medium-voltage switchgear). - Certifications: KC (Korea Certification Mark) is mandatory for electrical switchgear to ensure product safety. - Industry Modernization: Government incentives are driving investments in smart grids, increasing demand for IoT-enabled load break switches. |
| China | Regulatory Bodies: China Compulsory Certification (CCC), State Grid Corporation of China (SGCC), and National Energy Administration (NEA). - Key Regulations: Compliance with GB 1984 to 2014 (China’s national standard for high-voltage switchgear). - Certifications: CCC (China Compulsory Certification) is mandatory for switchgear before entering the industry. - Growth Driver: Government initiatives such as the "Made in China 2025" policy promote local manufacturing of smart electrical components. |
| India | Regulatory Bodies: Bureau of Indian Standards (BIS) and Central Electricity Authority (CEA). - Key Regulations: Compliance with IS 9920:2022 (Indian standards for medium-voltage switchgear). - Certifications: BIS certification is required for electrical switchgear used in utility and industrial applications. - Government Initiatives: Programs like "Saubhagya" (rural electrification) and smart grid implementation are driving industry expansion. |

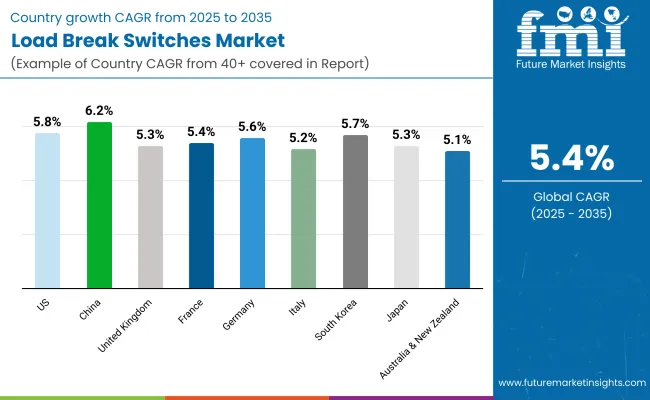
The USA load break switches industry will increase at a 5.8% CAGR between 2025 and 2035. The increasing modernization of ageing power infrastructure and smart grid investments are key drivers of its growth.
Utility companies and the USA Department of Energy (DOE) are investing in making the grid more resilient, contributing to greater demand for automated and IoT-based load break switches. Growing take-up of renewable energy sources, especially solar and wind, fuels industry growth further, with effective load management being essential.
FMI opines that the United States load break switches sales will grow at nearly 5.8% CAGR through 2025 to 2035.
The load break switches industry in the United Kingdom is poised to expand at a CAGR of 5.3% during the forecast period. The nation’s efforts to meet net-zero emissions target by 2050 are driving investments in smart grid and renewable energy.
Further, the United Kingdom’s Energy Networks Association (ENA) is engaged in upgrading transmission and distribution networks, leading to high demand for medium-voltage and high-voltage load break switches.
The industry is also being supported by the growth of offshore wind energy projects, which demand load isolation solutions that are reliable.
FMI opines that the United Kingdom load break switches sales will grow at nearly 5.3% CAGR through 2025 to 2035.
France's load break switches industry is expected to grow at a 5.4% CAGR between 2025 and 2035. The growth of the industry is led by the nation's renewable energy policy and government-supported grid modernization efforts. As EDF (Électricité de France) is heavily investing in smart grids, there is rising demand for high-performance remotely controllable load break switches.
France also complies with stringent EU energy laws, especially the EU Pressure Equipment Directive (PED), to apply high safety and performance criteria to electrical switchgear. The energy sector nuclear, which provides almost 70% of the nation's electricity, is also a large driver of demand, necessitating robust and dependable load isolation solutions.
FMI opines that France’s load break switches sales will grow at nearly 5.4% CAGR through 2025 to 2035.
Germany's load break switches industry will grow at a 5.6% CAGR through 2025 to 2035, led by the nation's ambitious Energiewende (Energy Transition) program. Spending on renewable energy infrastructure growth, power distribution automation, and energy storage systems is promoting demand for smart load break switches.
The DIN VDE 0670-3 standard prevalent in the nation, governing the safety of switchgear, has ensured compliance and has become a prime consideration for entry into the industry. In addition, there are a number of Germany-based prominent electrical equipment manufacturers creating compact, high-efficiency switchgear innovations.
The industry is also getting a boost from electrification trends in sectors such as automotive (EV infrastructure) and smart factories. High production costs and pressure from Eastern European suppliers are the challenges.
FMI opines that Germany load break switches sales will grow at nearly 5.6% CAGR through 2025 to 2035.
Italy's load break switches industry is likely to see a 5.2% CAGR between 2025 and 2035. The growth of the industry is driven by investments in smart grids, renewable energy, and industrial automation.
The PNIEC (National Energy and Climate Plan) of the Italian government plans to bring more solar and wind power into the grid, boosting demand for medium-voltage and high-voltage load break switches.
Italy also adheres to EU regulatory guidelines, making switchgear IEC and CE-compliant for safety. Urban electrification and metro rail development schemes are also generating demand for space-saving, high-performance switchgear solutions.
FMI opines that Italy load break switches sales will grow at nearly 5.2% CAGR through 2025 to 2035.
South Korea's load break switches industry will develop at a 5.7% CAGR between 2025 and 2035, driven by South Korea's Smart Grid Roadmap 2030 and industrialization drive. KEPCO (Korea Electric Power Corporation) is driving investment in smart power distribution systems, opening opportunities for smart, IoT-enabled load break switches.
Adherence to KS C IEC 62271 standards provides safety and quality throughout the industry. Further, there is a growing demand for compact switchgear solutions because of limited space in urban infrastructure.
FMI opines that the South Korean load break switches sales will grow at nearly 5.7% CAGR through 2025 to 2035.
Japan's load break switches industry is anticipated to grow at a 5.3% CAGR between 2025 and 2035, marginally lower than the global average owing to relatively sluggish grid modernization activities. Japan is dependent on high-performance switchgear for its industrial and urban power grids, with compliance under JIS C 4600 standards. However smart, automated switchgear adoption has been relatively slow compared to the USA and Europe, primarily due to high prices and fear of over-engineering.
FMI opines that Japan's load break switches sales will grow at nearly 5.3% CAGR through 2025 to 2035.
The Chinese load break switches industry will witness a 6.2% CAGR from 2025 to 2035, representing one of the fastest-growing industries in the world. Government policy initiatives like "Made in China 2025" and expansive smart grid investment are major catalysts. High-voltage switchgear infrastructure investments by the country's State Grid Corporation of China (SGCC) and regulation through GB 1984 to 2014 standards are other forces driving the industry.
The quick upscaling of renewable power projects and industrial sector electrification also increases the demand further. The competition, though, is heightened due to the availability of cheap local producers.
FMI opines that China’s load break switches sales will grow at nearly 6.2% CAGR through 2025 to 2035.
The Australia-New Zealand (ANZ) load break switches industry is expected to grow at a 5.1% CAGR from 2025 to 2035, aligning with the global average. Investments in renewable energy (especially solar and wind) and regional electrification are major growth drivers.
Compliance with AS/NZS 62271 standards ensures product safety and reliability. However, high import costs and logistical challenges remain obstacles.
FMI opines that the Australia-NZ load break switches sales will grow at nearly 5.1% CAGR through 2025 to 2035.
| 2020 to 2024 | 2025 to 2035 |
|---|---|
| Consistent Market Growth: The industry grew steadily, fueled by growing power distribution investments and urbanization. | Accelerated Growth: Increased investment in smart grids, renewable integration, and industrial electrification will propel faster growth. |
| Gas-Insulated Switch Dominance: Gas-insulated load break switches were the most popular type because of their small size and high performance. | Green Transformation: SF6-free solutions will take center stage as environmental standards get stricter, leading to gas-insulated technology innovation. |
| Limited Adoption of Smart Switches: Conventional manual and semi-automatic load break switches prevailed because of cost limitations in developing industries. | Growth of IoT & Smart Switchgear: Automation and real-time monitoring features will be the industry norm, with greater efficiency and reliability. |
| Regional Market Gaps: The developed industries have been witnessing steady demand in the sectors. While developing nations experienced limited adoption due to cost pressures and ageing grid infrastructure. | Broadening Market Penetration: Emerging economies will accelerate adoption as governments advocate for power grid modernization and electrification. |
| Supply Chain Disruptions: A pandemic like Covid 19 and other geographical tensions posed several challenges such as component shortages, which induced production and installation delays. | Supply Chain Resilience: Diversified sourcing and local manufacturing will lower reliance on single-region vendors, enhancing industry resilience. |
| Increasing Utility Investments: Electricity utilities commanded a substantial share of demand, replacing ageing grid networks to enhance reliability. | Utility & Industrial Growth: The industrial industry will use advanced load break switches more extensively to improve safety and energy efficiency. |
| Moderate Adoption of High-Voltage Switches: The 33-60 kV segment experienced limited growth as a result of high costs and dependence on conventional switchgear. | Increased Demand for High-Voltage Solutions: Grid expansion and renewable energy schemes will fuel high-voltage switchgear solution demand. |
| Carbon Emissions Concerns: Environmental regulations began to impact product development, but extensive change continued to be slow. | Sustainability-Focused Innovations: Green materials, recyclable parts, and energy-efficient design will be the future trends of the industry. |
| Mixed Regulatory Compliance: Differences in standards from region to region caused difficulties for manufacturers, which resulted in the delay of product certification and industry entry. | Tougher Global Regulations: Tighter regulations on emissions, safety, and energy efficiency will promote standardization and compliance-led innovation. |
| Consolidation & Mergers: Large industry players concentrated on acquisitions to reinforce their industry presence. | Tech-Driven Competition: Firms will concentrate on R&D spending in automation, AI-based diagnostics, and hybrid switchgear technology. |
The load break switches industry belongs to the electrical equipment and power distribution infrastructure segment, which is a major sector of the larger energy and utilities sector. It is directly linked to power generation, transmission, and distribution. Hence, it is being exposed to macroeconomic drivers like industrial growth, energy policies, and infrastructure spending.
The worldwide load break switches industry is driven significantly by infrastructure development, energy transition regulations, and industrialization patterns. With nations investing in smart grids and power transmission improvements, demand for dependable switchgear solutions grows. Developed nations concentrate on upgrading ageing electrical networks while emerging economies emphasize electrification and industrial growth.
Energy policies that encourage the use of renewable energy integration and grid modernization are defining the industry. Increased decentralized power generation like solar and wind farms creates the need for sophisticated switchgear that can manage changing power loads, which in turn increases demand for automated and smart load break switches.
Leading players in the load break switches industry are emphasizing technological advancements, strategic collaborations, and international expansion to acquire competitive advantage. As there is growing demand for intelligent and automated switchgear, businesses are adding IoT and AI-based monitoring systems to their products so that they can have real-time diagnostics and predictive maintenance.
In order to meet tough environmental standards, industry leaders like ABB, Schneider Electric, Siemens, and Eaton are investing in SF6-free and green switchgear products that minimize carbon footprints.
Pricing approaches differ between industries, with leading players using their brand stature and technology leadership to command higher margins, and local manufacturers competing on cost-effective solutions for emerging economies.
Grid modernization, renewable energy growth, and industrial automation are key drivers.
Stricter policies are pushing manufacturers toward SF6-free and eco-friendly alternatives.
Utilities, manufacturing, oil & gas, and commercial infrastructure are major adopters.
IoT-enabled switchgear enables real-time monitoring, remote operation, and predictive maintenance.
Rising raw material costs affect pricing, leading manufacturers to explore hybrid materials and local production.


Full Research Suite comprises of:
Market outlook & trends analysis
Interviews & case studies
Strategic recommendations
Vendor profiles & capabilities analysis
5-year forecasts
8 regions and 60+ country-level data splits
Market segment data splits
12 months of continuous data updates
DELIVERED AS:
PDF EXCEL ONLINE
Loader Bucket Market Size and Share Forecast Outlook 2025 to 2035
Loader Bucket Attachments Market Size and Share Forecast Outlook 2025 to 2035
Loading Spout Market Growth - Trends & Forecast 2024 to 2034
Top Loading Cartoning Machine Market Forecast and Outlook 2025 to 2035
LED Loading Dock Light Market Size and Share Forecast Outlook 2025 to 2035
Overload Protection Tools Market Analysis - Size, Share, and Forecast Outlook 2025 to 2035
Side Load Case Packing Machines Market Size and Share Forecast Outlook 2025 to 2035
Rear Loader Trucks Market Size and Share Forecast Outlook 2025 to 2035
Mass Loaded Vinyl (MLV) Market Size and Share Forecast Outlook 2025 to 2035
Side Loader Trucks Market Size and Share Forecast Outlook 2025 to 2035
Self-loading Feed Mixer Market Growth – Trends & Forecast 2024-2034
Self loading Trailer Market
Tray Loader Market
Wheel Loader Scales Market Size and Share Forecast Outlook 2025 to 2035
Wheel Loader Market Size and Share Forecast Outlook 2025 to 2035
Truck Loader Crane Market Size and Share Forecast Outlook 2025 to 2035
Train Loaders Market Size and Share Forecast Outlook 2025 to 2035
Cloud Load Balancers Market Analysis by Component, Vertical, and Region Through 2025 to 2035
Paper Loading Machine Market Trend Analysis Based on Product, End-Use, Loading Mechanism, Machine Size/Capacity, Automation Level and Regions 2025 to 2035
Power Load Switches Market

Thank you!
You will receive an email from our Business Development Manager. Please be sure to check your SPAM/JUNK folder too.
Chat With
MaRIA