Top Loading Cartoning Machine Market Outlook

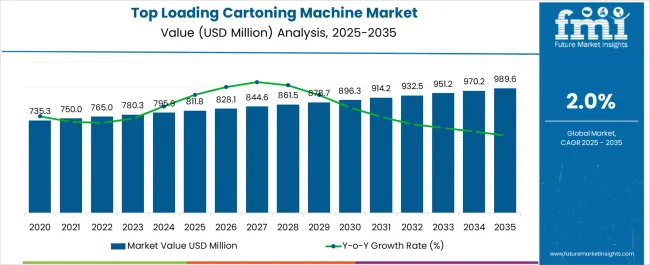
Future Market Insights’ recently updated report on the top loading cartoning machine market reveals a sluggish yet positive future. Analyses of macro and micro growth trends reveals that the market is expected to clock a valuation of USD 795.9 million in 2024.

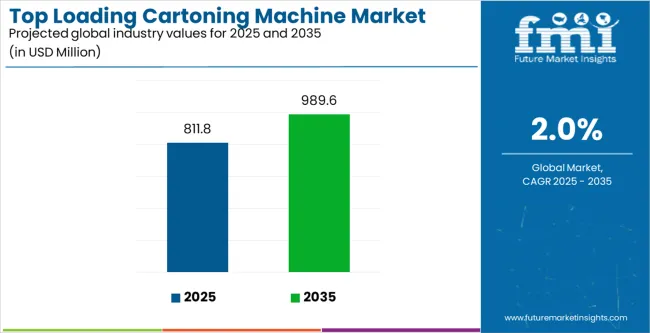
Looking to the future, from 2024 to 2034, the top loading cartoning machine market is set to progress at a 2% CAGR. Lead analysts in Future Market Insights’ packaging domain estimate a valuation exceeding USD 1 billion by 2034. The market is likely to grow 1.4x from 2024 to 2034.

Attributes Key Insights
Estimated Market Size in 2024 USD 795.9 million
Projected Market Value in 2034 USD 1.09 billion
Value-based CAGR from 2024 to 2034 2.00%

Key Market Trends and Highlights

  • Developed technological infrastructure is contributing wholesomely to the global top loading cartoning market. Integrating technology into traditional packaging systems revolutionizes the subject market, which is a key market trend.
  • Currently, the world is focusing more on sustainability. Biodegradable and recyclable products are manufactured. Also, the packaging of products needs to meet sustainability demands. Hence, this is another key trend in the market.
  • The growing food and beverage industry supports the subject market. As consumers have started to shift toward consuming packaged food, attractive packaging is more emphasized by food companies. Hence, this creates lucrative opportunities for the market, defining its scope.
  • Investments made by key players help the market diversify regarding its openings. Hence, this is another key market trend propelling its growth.

Demand Analysis of Top Loading Cartoning Machine Market from 2019 to 2023 vs. Outlook from 2024 to 2034

Reflecting a 1.4% historical CAGR, sales of top loading cartoning machines experienced sluggish expansion from 2019 to 2023. The market exhibited a potential worth USD 771.2 million in value terms as of 2023.

The market demand surged due to the emergence of the E-commerce platform. The requirement for advanced packaging of goods during the pandemic period surged the subject market. Also, innovative packaging solutions were surging the market.

Customization was another market driver propelling the market growth in the historical period. Due to customized packaging solutions required for different industries during this period, the demand surged.

Historical CAGR from 2019 to 2023 1.40%
Forecast CAGR from 2024 to 2034 2.00%

The forecasted period focused more on integrating cutting-edge technology with traditional packaging solutions. Due to technological advancement, efficient packaging solutions can be given to industries like the pharmaceutical sector, the food and beverage industry, and many more. Hence, this is the prime market driver.

Changing consumer perspective is another key market demand in the forecasted period. Consumers are relying on sustainable solutions. The packaging industry is propelled as sustainable packaging can efficiently meet changing consumer demands.

Market Drivers

  • Continuously evolving technology fuels the market. The main reason behind this is the upgradation of existing systems to deliver supreme output.
  • Growing consumer awareness regarding sustainability and environmental safety drives the subject market. Consumers are looking for a sustainable alternative to their existing solutions. This creates a lucrative opportunity to expand in the market niche.
  • The growth of the e-commerce platform will assist the market as it requires packaging solutions extensively.
  • The growth of different industries, including the pharmaceutical market, the food and beverage industry, and the manufacturing sector, propels the development of the global top loading cartoning machine market. These machines find diversified applications in the abovementioned industries, which drives the market.

Market Challenges

  • Lack of flexibility is the primary market restraint for the top loading cartoning machine market. The same top loading machines might not be useful for different-sized products. This limits the scope of the market.
  • High investment cost is another key challenge for the subject market. Due to technological acquisition and rapidly changing technology, the initial investment needed to be made is high. This limits the entry of new entrants to the market.

Country-wise Analysis

Forecast CAGRs from 2024 to 2034

Countries Forecasted CAGR
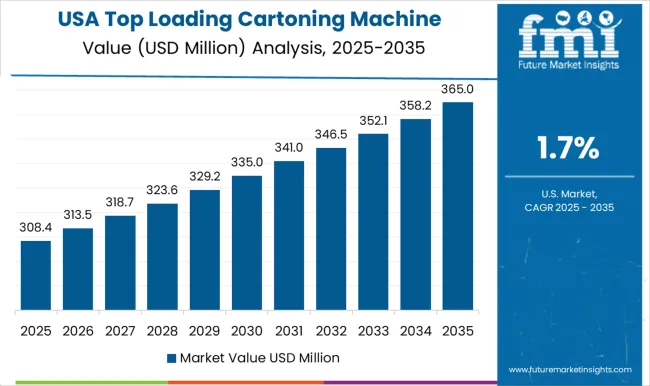
The United States of America 0.7%
Italy 1.2%
Spain 2.3%
China 3.3%
India 4.1%

Enhanced Automation Drives the Top Loading Cartoning Machine Market in the United States of America

  • The technological framework in the United States of America has been developing. This promises the evolution of several industries.
  • Due to this, automation is sought by organizations in packaging and delivering products to enhance operational speed.
  • Hence, this surges the demand for automated cartoning machines, surging the subject market.
  • This market demand encourages the emergence of new entrants in the market.
  • The United States of America registers progress at an estimated CAGR of 0.7%.

Demand for Precision Elevates the Italian Market of the Top Loading Cartoning Machine Market

  • Italy estimates the market progression at a CAGR of 1.2% through 2034.
  • Italian businesses have fostered standardization norms that adhere to international standards. Consequently, it requires high-quality precision.
  • Many markets, including food, pharmaceutical, and cosmetics, seek precision packaging for better accuracy.
  • Also, stringent quality standards in Italy can be met by using top loading cartoning machines, which surges the demand for machines.
  • Thus, with the rising demand for precise and standardized outcomes, businesses surge the subject market to fulfil their requirement.

Investing in Cutting-Edge Manufacturing Boosts the Spanish Market

  • The Spanish government is focusing on enhancing its manufacturing and processing industry to meet the standards of Industry 4.0.
  • The government’s investments propel the production of cartoning machines.
  • Also, technology integration into these systems fuels the advancement of the market. Hence, this is a crucial market driver.
  • Apart from this, enhanced competitiveness on the global landscape surges foreign investment, propelling market growth.
  • These factors drive the top loading cartoning machine market at a CAGR of 2.3%, making Spain lead Europe in terms of its growth rate.

Skilled Labor Ease the Manufacturing, Leveraging the Chinese Market

  • China has been emerging as a technological giant, developing its technological infrastructure significantly.
  • Further, skilled operators leverage the efficient operation of this system, fueling the packaging industry.
  • The availability of labor helps the market to produce better quality output with mass quantity.
  • Therefore, these are critical market drivers for the Chinese market.
  • These factors elevate the Chinese market’s advancement at a CAGR of 3.3%.

Increasing Packaged Food Consumption Drives the Indian Top Loading Cartoning Machines Market

  • The Indian market creates the maximum lucrative opportunities for the subject market. It is projected to propel with a CAGR of 4.1%, the highest among all the countries.
  • The average disposable income of an individual is rising, raising the demand for the food industry. Moreover, packaged food has been in demand.
  • This surges the packaging industry to ensure the safety of the food.
  • Consequently, this drives the top loading cartoning machines market in India

Category-wise Insights

Category Orientation - Horizontal
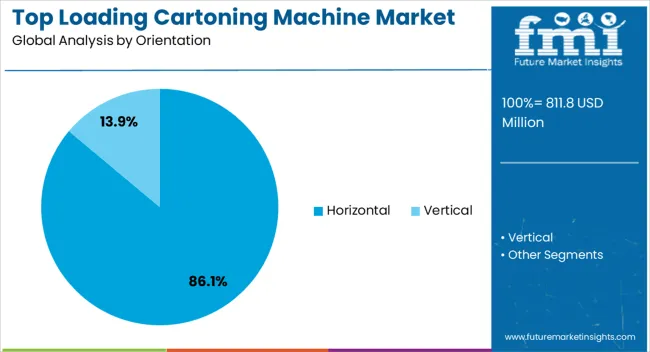
Market Share in 2024 86.1%
Market Segment Drivers
  • The ability of the continuous working increases the popularity of the market segment. Hence, this surges the market segment.
  • The wider application range increases the usability of horizontal cartoning machines. Hence, this surges the demand for these machines. Thus, it propels the market segment.
  • Automation enhances the efficiency of operations drastically, surging the market segment.
Category End Use - Food
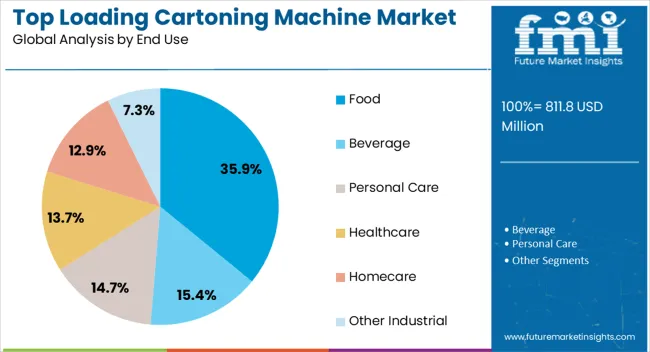
Market Share in 2024 35.9%
Market Segment Drivers
  • The operational speed of food packaging leverages the efficiency of food delivery to consumers. Cartoning machines elevate this speed; hence, they are largely used in the food industry.
  • Simple quality control process is another key factor that surges the demand in the market segment.
  • Cost-effectiveness is another factor that encourages the food industry to use cartoning machines, driving the market segment.

Competitive Landscape

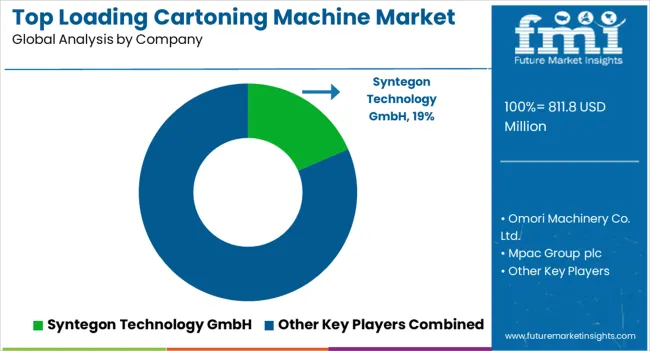
Various marketers mark their positions in the competitive landscape of the top loading cartoning machine market. Due to their cluttered presence in the market, the competitive force exerted on individual players is substantial.

To withstand this competition, organizations must adhere to innovative market expansion strategies like strategic partnerships, mergers and acquisitions, diversification, product development and innovation, and so on. These key strategies allow an individual to penetrate the market more deeply.

The new entrant must adopt changing market dynamics to help the new business induce a differentiator. Differentiating the product portfolio is the key suggested strategy for the new entrants to gain a significant competitive advantage.

Key Market Developments

  • In January 2021, Omori Machinery Co. Ltd. acquired more shares of Omori North America, a subsidiary of the organization. This helped the business undergo a digital transformation process.
  • In June 2023, Mpac Group plc collaborated with Freyr Battery. This move helped the business to create a market niche in Georgia, Giga America. These organizations collaborated on the casting and unit cell assembly system.
  • In January 2024, Tetra Pak International S.A. collaborated with Absolicon. This strategic partnership helped the organization innovate and launch a renewable thermal supply powering UHT equipment line.
  • In March 2024, Syntegon Technology GmbH introduced new SBM line sterilizers. This diversified the product portfolio of the organization. The product launch also helped the organization gain more space in the competitive landscape.

Key Coverage of Top loading Cartoning Machine Market Report

  • In-depth analysis of company shares.
  • Analysing market dynamics with different market forces influencing the market.
  • Competitive scope and emergence of new entrants.
  • Opportunities, restraints, threats, and driving forces for the market.
  • Growth strategies adopted by key players.
  • Key coverage of the market forecasts.

Report Scope

Attributes Details
Estimated Market Size in 2024 USD 795.9 million
Projected Market Valuation in 2034 USD 1.09 billion
Value-based CAGR 2024 to 2034 2.00%
Forecast Period 2024 to 2034
Historical Data Available for 2019 to 2023
Market Analysis Value in USD million/billion
Key Regions Covered North America; Latin America; Western Europe; Eastern Europe; South Asia and Pacific; East Asia; The Middle East and Africa
Key Market Segments Covered Orientation, Capacity, End Use, Region
Key Countries Profiled The United States, Canada, Brazil, Mexico, Germany, The United Kingdom, France, Spain, Italy, Poland, Russia, Czech Republic, Romania, India, Bangladesh, Australia, New Zealand, China, Japan, South Korea, GCC Countries, South Africa, Israel
Key Companies Profiled Syntegon Technology GmbH; Omori Machinery Co. Ltd.; Mpac Group plc; R.A Jones; Tetra Pak International S.A.; Rovema GmbH; Cama Group; Econocorp Inc.; PMI Cartoning, Inc.; Bradman Lake Group Ltd.; ADCO Manufacturing

Top Loading Cartoning Machine Market - Key Segments

By Orientation:

  • Horizontal
  • Vertical

By Capacity:

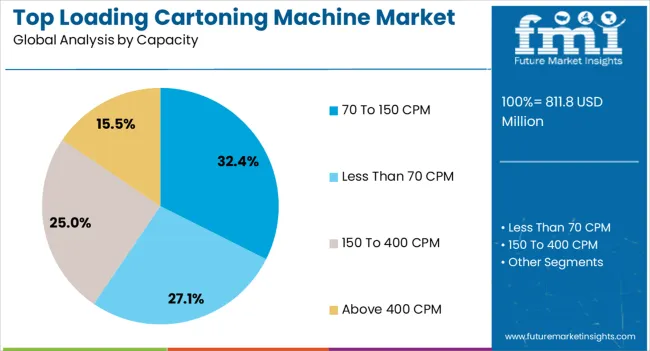
  • Less than 70 CPM
  • 70 to 150 CPM
  • 150 to 400 CPM
  • Above 400 CPM

By End Use:

  • Food
  • Beverage
  • Personal Care
  • Healthcare
  • Homecare
  • Other Industrial

By Region:

  • North America
  • Latin America
  • Western Europe
  • Eastern Europe
  • South Asia and Pacific
  • East Asia
  • The Middle East and Africa

Table of Content

  • 1. Executive Summary
  • 2. Market Overview
  • 3. Market Background
  • 4. Global Market Analysis 2019 to 2023 and Forecast, 2024 to 2034
  • 5. Global Market Analysis 2019 to 2023 and Forecast 2024 to 2034, By Orientation
    • 5.1. Horizontal
    • 5.2. Vertical
  • 6. Global Market Analysis 2019 to 2023 and Forecast 2024 to 2034, By Capacity
    • 6.1. Less than 70 CPM
    • 6.2. 70 to 150 CPM
    • 6.3. 150 to 400 CPM
    • 6.4. Above 400 CPM
  • 7. Global Market Analysis 2019 to 2023 and Forecast 2024 to 2034, By End Use
    • 7.1. Food
    • 7.2. Beverage
    • 7.3. Personal Care
    • 7.4. Healthcare
    • 7.5. Homecare
    • 7.6. Other Industrial
  • 8. Global Market Analysis 2019 to 2023 and Forecast 2024 to 2034, By Region
    • 8.1. North America
    • 8.2. Latin America
    • 8.3. Western Europe
    • 8.4. Eastern Europe
    • 8.5. South Asia and Pacific
    • 8.6. East Asia
    • 8.7. Middle East and Africa
  • 9. North America Market Analysis 2019 to 2023 and Forecast 2024 to 2034, By Country
  • 10. Latin America Market Analysis 2019 to 2023 and Forecast 2024 to 2034, By Country
  • 11. Western Europe Market Analysis 2019 to 2023 and Forecast 2024 to 2034, By Country
  • 12. Eastern Europe Market Analysis 2019 to 2023 and Forecast 2024 to 2034, By Country
  • 13. South Asia and Pacific Market Analysis 2019 to 2023 and Forecast 2024 to 2034, By Country
  • 14. East Asia Market Analysis 2019 to 2023 and Forecast 2024 to 2034, By Country
  • 15. Middle East and Africa Market Analysis 2019 to 2023 and Forecast 2024 to 2034, By Country
  • 16. Key Countries Market Analysis
  • 17. Market Structure Analysis
  • 18. Competition Analysis
    • 18.1. Syntegon Technology GmbH
    • 18.2. Omori Machinery Co. Ltd.
    • 18.3. Mpac Group plc
    • 18.4. R.A Jones
    • 18.5. Tetra Pak International S.A.
    • 18.6. Rovema GmbH
    • 18.7. Cama Group
    • 18.8. Econocorp Inc.
    • 18.9. PMI Cartoning, Inc.
    • 18.10. Bradman Lake Group Ltd.
    • 18.11. ADCO Manufacturing
  • 19. Assumptions & Acronyms Used
  • 20. Research Methodology

List of Tables

Table 1: Global Market Value (US$ Million) Forecast by Region, 2019 to 2034

Table 2: Global Market Volume (Units) Forecast by Region, 2019 to 2034

Table 3: Global Market Value (US$ Million) Forecast by Orientation, 2019 to 2034

Table 4: Global Market Volume (Units) Forecast by Orientation, 2019 to 2034

Table 5: Global Market Value (US$ Million) Forecast by Capacity, 2019 to 2034

Table 6: Global Market Volume (Units) Forecast by Capacity, 2019 to 2034

Table 7: Global Market Value (US$ Million) Forecast by End Use, 2019 to 2034

Table 8: Global Market Volume (Units) Forecast by End Use, 2019 to 2034

Table 9: North America Market Value (US$ Million) Forecast by Country, 2019 to 2034

Table 10: North America Market Volume (Units) Forecast by Country, 2019 to 2034

Table 11: North America Market Value (US$ Million) Forecast by Orientation, 2019 to 2034

Table 12: North America Market Volume (Units) Forecast by Orientation, 2019 to 2034

Table 13: North America Market Value (US$ Million) Forecast by Capacity, 2019 to 2034

Table 14: North America Market Volume (Units) Forecast by Capacity, 2019 to 2034

Table 15: North America Market Value (US$ Million) Forecast by End Use, 2019 to 2034

Table 16: North America Market Volume (Units) Forecast by End Use, 2019 to 2034

Table 17: Latin America Market Value (US$ Million) Forecast by Country, 2019 to 2034

Table 18: Latin America Market Volume (Units) Forecast by Country, 2019 to 2034

Table 19: Latin America Market Value (US$ Million) Forecast by Orientation, 2019 to 2034

Table 20: Latin America Market Volume (Units) Forecast by Orientation, 2019 to 2034

Table 21: Latin America Market Value (US$ Million) Forecast by Capacity, 2019 to 2034

Table 22: Latin America Market Volume (Units) Forecast by Capacity, 2019 to 2034

Table 23: Latin America Market Value (US$ Million) Forecast by End Use, 2019 to 2034

Table 24: Latin America Market Volume (Units) Forecast by End Use, 2019 to 2034

Table 25: Western Europe Market Value (US$ Million) Forecast by Country, 2019 to 2034

Table 26: Western Europe Market Volume (Units) Forecast by Country, 2019 to 2034

Table 27: Western Europe Market Value (US$ Million) Forecast by Orientation, 2019 to 2034

Table 28: Western Europe Market Volume (Units) Forecast by Orientation, 2019 to 2034

Table 29: Western Europe Market Value (US$ Million) Forecast by Capacity, 2019 to 2034

Table 30: Western Europe Market Volume (Units) Forecast by Capacity, 2019 to 2034

Table 31: Western Europe Market Value (US$ Million) Forecast by End Use, 2019 to 2034

Table 32: Western Europe Market Volume (Units) Forecast by End Use, 2019 to 2034

Table 33: Eastern Europe Market Value (US$ Million) Forecast by Country, 2019 to 2034

Table 34: Eastern Europe Market Volume (Units) Forecast by Country, 2019 to 2034

Table 35: Eastern Europe Market Value (US$ Million) Forecast by Orientation, 2019 to 2034

Table 36: Eastern Europe Market Volume (Units) Forecast by Orientation, 2019 to 2034

Table 37: Eastern Europe Market Value (US$ Million) Forecast by Capacity, 2019 to 2034

Table 38: Eastern Europe Market Volume (Units) Forecast by Capacity, 2019 to 2034

Table 39: Eastern Europe Market Value (US$ Million) Forecast by End Use, 2019 to 2034

Table 40: Eastern Europe Market Volume (Units) Forecast by End Use, 2019 to 2034

Table 41: South Asia and Pacific Market Value (US$ Million) Forecast by Country, 2019 to 2034

Table 42: South Asia and Pacific Market Volume (Units) Forecast by Country, 2019 to 2034

Table 43: South Asia and Pacific Market Value (US$ Million) Forecast by Orientation, 2019 to 2034

Table 44: South Asia and Pacific Market Volume (Units) Forecast by Orientation, 2019 to 2034

Table 45: South Asia and Pacific Market Value (US$ Million) Forecast by Capacity, 2019 to 2034

Table 46: South Asia and Pacific Market Volume (Units) Forecast by Capacity, 2019 to 2034

Table 47: South Asia and Pacific Market Value (US$ Million) Forecast by End Use, 2019 to 2034

Table 48: South Asia and Pacific Market Volume (Units) Forecast by End Use, 2019 to 2034

Table 49: East Asia Market Value (US$ Million) Forecast by Country, 2019 to 2034

Table 50: East Asia Market Volume (Units) Forecast by Country, 2019 to 2034

Table 51: East Asia Market Value (US$ Million) Forecast by Orientation, 2019 to 2034

Table 52: East Asia Market Volume (Units) Forecast by Orientation, 2019 to 2034

Table 53: East Asia Market Value (US$ Million) Forecast by Capacity, 2019 to 2034

Table 54: East Asia Market Volume (Units) Forecast by Capacity, 2019 to 2034

Table 55: East Asia Market Value (US$ Million) Forecast by End Use, 2019 to 2034

Table 56: East Asia Market Volume (Units) Forecast by End Use, 2019 to 2034

Table 57: Middle East and Africa Market Value (US$ Million) Forecast by Country, 2019 to 2034

Table 58: Middle East and Africa Market Volume (Units) Forecast by Country, 2019 to 2034

Table 59: Middle East and Africa Market Value (US$ Million) Forecast by Orientation, 2019 to 2034

Table 60: Middle East and Africa Market Volume (Units) Forecast by Orientation, 2019 to 2034

Table 61: Middle East and Africa Market Value (US$ Million) Forecast by Capacity, 2019 to 2034

Table 62: Middle East and Africa Market Volume (Units) Forecast by Capacity, 2019 to 2034

Table 63: Middle East and Africa Market Value (US$ Million) Forecast by End Use, 2019 to 2034

Table 64: Middle East and Africa Market Volume (Units) Forecast by End Use, 2019 to 2034

List of Figures

Figure 1: Global Market Value (US$ Million) by Orientation, 2024 to 2034

Figure 2: Global Market Value (US$ Million) by Capacity, 2024 to 2034

Figure 3: Global Market Value (US$ Million) by End Use, 2024 to 2034

Figure 4: Global Market Value (US$ Million) by Region, 2024 to 2034

Figure 5: Global Market Value (US$ Million) Analysis by Region, 2019 to 2034

Figure 6: Global Market Volume (Units) Analysis by Region, 2019 to 2034

Figure 7: Global Market Value Share (%) and BPS Analysis by Region, 2024 to 2034

Figure 8: Global Market Y-o-Y Growth (%) Projections by Region, 2024 to 2034

Figure 9: Global Market Value (US$ Million) Analysis by Orientation, 2019 to 2034

Figure 10: Global Market Volume (Units) Analysis by Orientation, 2019 to 2034

Figure 11: Global Market Value Share (%) and BPS Analysis by Orientation, 2024 to 2034

Figure 12: Global Market Y-o-Y Growth (%) Projections by Orientation, 2024 to 2034

Figure 13: Global Market Value (US$ Million) Analysis by Capacity, 2019 to 2034

Figure 14: Global Market Volume (Units) Analysis by Capacity, 2019 to 2034

Figure 15: Global Market Value Share (%) and BPS Analysis by Capacity, 2024 to 2034

Figure 16: Global Market Y-o-Y Growth (%) Projections by Capacity, 2024 to 2034

Figure 17: Global Market Value (US$ Million) Analysis by End Use, 2019 to 2034

Figure 18: Global Market Volume (Units) Analysis by End Use, 2019 to 2034

Figure 19: Global Market Value Share (%) and BPS Analysis by End Use, 2024 to 2034

Figure 20: Global Market Y-o-Y Growth (%) Projections by End Use, 2024 to 2034

Figure 21: Global Market Attractiveness by Orientation, 2024 to 2034

Figure 22: Global Market Attractiveness by Capacity, 2024 to 2034

Figure 23: Global Market Attractiveness by End Use, 2024 to 2034

Figure 24: Global Market Attractiveness by Region, 2024 to 2034

Figure 25: North America Market Value (US$ Million) by Orientation, 2024 to 2034

Figure 26: North America Market Value (US$ Million) by Capacity, 2024 to 2034

Figure 27: North America Market Value (US$ Million) by End Use, 2024 to 2034

Figure 28: North America Market Value (US$ Million) by Country, 2024 to 2034

Figure 29: North America Market Value (US$ Million) Analysis by Country, 2019 to 2034

Figure 30: North America Market Volume (Units) Analysis by Country, 2019 to 2034

Figure 31: North America Market Value Share (%) and BPS Analysis by Country, 2024 to 2034

Figure 32: North America Market Y-o-Y Growth (%) Projections by Country, 2024 to 2034

Figure 33: North America Market Value (US$ Million) Analysis by Orientation, 2019 to 2034

Figure 34: North America Market Volume (Units) Analysis by Orientation, 2019 to 2034

Figure 35: North America Market Value Share (%) and BPS Analysis by Orientation, 2024 to 2034

Figure 36: North America Market Y-o-Y Growth (%) Projections by Orientation, 2024 to 2034

Figure 37: North America Market Value (US$ Million) Analysis by Capacity, 2019 to 2034

Figure 38: North America Market Volume (Units) Analysis by Capacity, 2019 to 2034

Figure 39: North America Market Value Share (%) and BPS Analysis by Capacity, 2024 to 2034

Figure 40: North America Market Y-o-Y Growth (%) Projections by Capacity, 2024 to 2034

Figure 41: North America Market Value (US$ Million) Analysis by End Use, 2019 to 2034

Figure 42: North America Market Volume (Units) Analysis by End Use, 2019 to 2034

Figure 43: North America Market Value Share (%) and BPS Analysis by End Use, 2024 to 2034

Figure 44: North America Market Y-o-Y Growth (%) Projections by End Use, 2024 to 2034

Figure 45: North America Market Attractiveness by Orientation, 2024 to 2034

Figure 46: North America Market Attractiveness by Capacity, 2024 to 2034

Figure 47: North America Market Attractiveness by End Use, 2024 to 2034

Figure 48: North America Market Attractiveness by Country, 2024 to 2034

Figure 49: Latin America Market Value (US$ Million) by Orientation, 2024 to 2034

Figure 50: Latin America Market Value (US$ Million) by Capacity, 2024 to 2034

Figure 51: Latin America Market Value (US$ Million) by End Use, 2024 to 2034

Figure 52: Latin America Market Value (US$ Million) by Country, 2024 to 2034

Figure 53: Latin America Market Value (US$ Million) Analysis by Country, 2019 to 2034

Figure 54: Latin America Market Volume (Units) Analysis by Country, 2019 to 2034

Figure 55: Latin America Market Value Share (%) and BPS Analysis by Country, 2024 to 2034

Figure 56: Latin America Market Y-o-Y Growth (%) Projections by Country, 2024 to 2034

Figure 57: Latin America Market Value (US$ Million) Analysis by Orientation, 2019 to 2034

Figure 58: Latin America Market Volume (Units) Analysis by Orientation, 2019 to 2034

Figure 59: Latin America Market Value Share (%) and BPS Analysis by Orientation, 2024 to 2034

Figure 60: Latin America Market Y-o-Y Growth (%) Projections by Orientation, 2024 to 2034

Figure 61: Latin America Market Value (US$ Million) Analysis by Capacity, 2019 to 2034

Figure 62: Latin America Market Volume (Units) Analysis by Capacity, 2019 to 2034

Figure 63: Latin America Market Value Share (%) and BPS Analysis by Capacity, 2024 to 2034

Figure 64: Latin America Market Y-o-Y Growth (%) Projections by Capacity, 2024 to 2034

Figure 65: Latin America Market Value (US$ Million) Analysis by End Use, 2019 to 2034

Figure 66: Latin America Market Volume (Units) Analysis by End Use, 2019 to 2034

Figure 67: Latin America Market Value Share (%) and BPS Analysis by End Use, 2024 to 2034

Figure 68: Latin America Market Y-o-Y Growth (%) Projections by End Use, 2024 to 2034

Figure 69: Latin America Market Attractiveness by Orientation, 2024 to 2034

Figure 70: Latin America Market Attractiveness by Capacity, 2024 to 2034

Figure 71: Latin America Market Attractiveness by End Use, 2024 to 2034

Figure 72: Latin America Market Attractiveness by Country, 2024 to 2034

Figure 73: Western Europe Market Value (US$ Million) by Orientation, 2024 to 2034

Figure 74: Western Europe Market Value (US$ Million) by Capacity, 2024 to 2034

Figure 75: Western Europe Market Value (US$ Million) by End Use, 2024 to 2034

Figure 76: Western Europe Market Value (US$ Million) by Country, 2024 to 2034

Figure 77: Western Europe Market Value (US$ Million) Analysis by Country, 2019 to 2034

Figure 78: Western Europe Market Volume (Units) Analysis by Country, 2019 to 2034

Figure 79: Western Europe Market Value Share (%) and BPS Analysis by Country, 2024 to 2034

Figure 80: Western Europe Market Y-o-Y Growth (%) Projections by Country, 2024 to 2034

Figure 81: Western Europe Market Value (US$ Million) Analysis by Orientation, 2019 to 2034

Figure 82: Western Europe Market Volume (Units) Analysis by Orientation, 2019 to 2034

Figure 83: Western Europe Market Value Share (%) and BPS Analysis by Orientation, 2024 to 2034

Figure 84: Western Europe Market Y-o-Y Growth (%) Projections by Orientation, 2024 to 2034

Figure 85: Western Europe Market Value (US$ Million) Analysis by Capacity, 2019 to 2034

Figure 86: Western Europe Market Volume (Units) Analysis by Capacity, 2019 to 2034

Figure 87: Western Europe Market Value Share (%) and BPS Analysis by Capacity, 2024 to 2034

Figure 88: Western Europe Market Y-o-Y Growth (%) Projections by Capacity, 2024 to 2034

Figure 89: Western Europe Market Value (US$ Million) Analysis by End Use, 2019 to 2034

Figure 90: Western Europe Market Volume (Units) Analysis by End Use, 2019 to 2034

Figure 91: Western Europe Market Value Share (%) and BPS Analysis by End Use, 2024 to 2034

Figure 92: Western Europe Market Y-o-Y Growth (%) Projections by End Use, 2024 to 2034

Figure 93: Western Europe Market Attractiveness by Orientation, 2024 to 2034

Figure 94: Western Europe Market Attractiveness by Capacity, 2024 to 2034

Figure 95: Western Europe Market Attractiveness by End Use, 2024 to 2034

Figure 96: Western Europe Market Attractiveness by Country, 2024 to 2034

Figure 97: Eastern Europe Market Value (US$ Million) by Orientation, 2024 to 2034

Figure 98: Eastern Europe Market Value (US$ Million) by Capacity, 2024 to 2034

Figure 99: Eastern Europe Market Value (US$ Million) by End Use, 2024 to 2034

Figure 100: Eastern Europe Market Value (US$ Million) by Country, 2024 to 2034

Figure 101: Eastern Europe Market Value (US$ Million) Analysis by Country, 2019 to 2034

Figure 102: Eastern Europe Market Volume (Units) Analysis by Country, 2019 to 2034

Figure 103: Eastern Europe Market Value Share (%) and BPS Analysis by Country, 2024 to 2034

Figure 104: Eastern Europe Market Y-o-Y Growth (%) Projections by Country, 2024 to 2034

Figure 105: Eastern Europe Market Value (US$ Million) Analysis by Orientation, 2019 to 2034

Figure 106: Eastern Europe Market Volume (Units) Analysis by Orientation, 2019 to 2034

Figure 107: Eastern Europe Market Value Share (%) and BPS Analysis by Orientation, 2024 to 2034

Figure 108: Eastern Europe Market Y-o-Y Growth (%) Projections by Orientation, 2024 to 2034

Figure 109: Eastern Europe Market Value (US$ Million) Analysis by Capacity, 2019 to 2034

Figure 110: Eastern Europe Market Volume (Units) Analysis by Capacity, 2019 to 2034

Figure 111: Eastern Europe Market Value Share (%) and BPS Analysis by Capacity, 2024 to 2034

Figure 112: Eastern Europe Market Y-o-Y Growth (%) Projections by Capacity, 2024 to 2034

Figure 113: Eastern Europe Market Value (US$ Million) Analysis by End Use, 2019 to 2034

Figure 114: Eastern Europe Market Volume (Units) Analysis by End Use, 2019 to 2034

Figure 115: Eastern Europe Market Value Share (%) and BPS Analysis by End Use, 2024 to 2034

Figure 116: Eastern Europe Market Y-o-Y Growth (%) Projections by End Use, 2024 to 2034

Figure 117: Eastern Europe Market Attractiveness by Orientation, 2024 to 2034

Figure 118: Eastern Europe Market Attractiveness by Capacity, 2024 to 2034

Figure 119: Eastern Europe Market Attractiveness by End Use, 2024 to 2034

Figure 120: Eastern Europe Market Attractiveness by Country, 2024 to 2034

Figure 121: South Asia and Pacific Market Value (US$ Million) by Orientation, 2024 to 2034

Figure 122: South Asia and Pacific Market Value (US$ Million) by Capacity, 2024 to 2034

Figure 123: South Asia and Pacific Market Value (US$ Million) by End Use, 2024 to 2034

Figure 124: South Asia and Pacific Market Value (US$ Million) by Country, 2024 to 2034

Figure 125: South Asia and Pacific Market Value (US$ Million) Analysis by Country, 2019 to 2034

Figure 126: South Asia and Pacific Market Volume (Units) Analysis by Country, 2019 to 2034

Figure 127: South Asia and Pacific Market Value Share (%) and BPS Analysis by Country, 2024 to 2034

Figure 128: South Asia and Pacific Market Y-o-Y Growth (%) Projections by Country, 2024 to 2034

Figure 129: South Asia and Pacific Market Value (US$ Million) Analysis by Orientation, 2019 to 2034

Figure 130: South Asia and Pacific Market Volume (Units) Analysis by Orientation, 2019 to 2034

Figure 131: South Asia and Pacific Market Value Share (%) and BPS Analysis by Orientation, 2024 to 2034

Figure 132: South Asia and Pacific Market Y-o-Y Growth (%) Projections by Orientation, 2024 to 2034

Figure 133: South Asia and Pacific Market Value (US$ Million) Analysis by Capacity, 2019 to 2034

Figure 134: South Asia and Pacific Market Volume (Units) Analysis by Capacity, 2019 to 2034

Figure 135: South Asia and Pacific Market Value Share (%) and BPS Analysis by Capacity, 2024 to 2034

Figure 136: South Asia and Pacific Market Y-o-Y Growth (%) Projections by Capacity, 2024 to 2034

Figure 137: South Asia and Pacific Market Value (US$ Million) Analysis by End Use, 2019 to 2034

Figure 138: South Asia and Pacific Market Volume (Units) Analysis by End Use, 2019 to 2034

Figure 139: South Asia and Pacific Market Value Share (%) and BPS Analysis by End Use, 2024 to 2034

Figure 140: South Asia and Pacific Market Y-o-Y Growth (%) Projections by End Use, 2024 to 2034

Figure 141: South Asia and Pacific Market Attractiveness by Orientation, 2024 to 2034

Figure 142: South Asia and Pacific Market Attractiveness by Capacity, 2024 to 2034

Figure 143: South Asia and Pacific Market Attractiveness by End Use, 2024 to 2034

Figure 144: South Asia and Pacific Market Attractiveness by Country, 2024 to 2034

Figure 145: East Asia Market Value (US$ Million) by Orientation, 2024 to 2034

Figure 146: East Asia Market Value (US$ Million) by Capacity, 2024 to 2034

Figure 147: East Asia Market Value (US$ Million) by End Use, 2024 to 2034

Figure 148: East Asia Market Value (US$ Million) by Country, 2024 to 2034

Figure 149: East Asia Market Value (US$ Million) Analysis by Country, 2019 to 2034

Figure 150: East Asia Market Volume (Units) Analysis by Country, 2019 to 2034

Figure 151: East Asia Market Value Share (%) and BPS Analysis by Country, 2024 to 2034

Figure 152: East Asia Market Y-o-Y Growth (%) Projections by Country, 2024 to 2034

Figure 153: East Asia Market Value (US$ Million) Analysis by Orientation, 2019 to 2034

Figure 154: East Asia Market Volume (Units) Analysis by Orientation, 2019 to 2034

Figure 155: East Asia Market Value Share (%) and BPS Analysis by Orientation, 2024 to 2034

Figure 156: East Asia Market Y-o-Y Growth (%) Projections by Orientation, 2024 to 2034

Figure 157: East Asia Market Value (US$ Million) Analysis by Capacity, 2019 to 2034

Figure 158: East Asia Market Volume (Units) Analysis by Capacity, 2019 to 2034

Figure 159: East Asia Market Value Share (%) and BPS Analysis by Capacity, 2024 to 2034

Figure 160: East Asia Market Y-o-Y Growth (%) Projections by Capacity, 2024 to 2034

Figure 161: East Asia Market Value (US$ Million) Analysis by End Use, 2019 to 2034

Figure 162: East Asia Market Volume (Units) Analysis by End Use, 2019 to 2034

Figure 163: East Asia Market Value Share (%) and BPS Analysis by End Use, 2024 to 2034

Figure 164: East Asia Market Y-o-Y Growth (%) Projections by End Use, 2024 to 2034

Figure 165: East Asia Market Attractiveness by Orientation, 2024 to 2034

Figure 166: East Asia Market Attractiveness by Capacity, 2024 to 2034

Figure 167: East Asia Market Attractiveness by End Use, 2024 to 2034

Figure 168: East Asia Market Attractiveness by Country, 2024 to 2034

Figure 169: Middle East and Africa Market Value (US$ Million) by Orientation, 2024 to 2034

Figure 170: Middle East and Africa Market Value (US$ Million) by Capacity, 2024 to 2034

Figure 171: Middle East and Africa Market Value (US$ Million) by End Use, 2024 to 2034

Figure 172: Middle East and Africa Market Value (US$ Million) by Country, 2024 to 2034

Figure 173: Middle East and Africa Market Value (US$ Million) Analysis by Country, 2019 to 2034

Figure 174: Middle East and Africa Market Volume (Units) Analysis by Country, 2019 to 2034

Figure 175: Middle East and Africa Market Value Share (%) and BPS Analysis by Country, 2024 to 2034

Figure 176: Middle East and Africa Market Y-o-Y Growth (%) Projections by Country, 2024 to 2034

Figure 177: Middle East and Africa Market Value (US$ Million) Analysis by Orientation, 2019 to 2034

Figure 178: Middle East and Africa Market Volume (Units) Analysis by Orientation, 2019 to 2034

Figure 179: Middle East and Africa Market Value Share (%) and BPS Analysis by Orientation, 2024 to 2034

Figure 180: Middle East and Africa Market Y-o-Y Growth (%) Projections by Orientation, 2024 to 2034

Figure 181: Middle East and Africa Market Value (US$ Million) Analysis by Capacity, 2019 to 2034

Figure 182: Middle East and Africa Market Volume (Units) Analysis by Capacity, 2019 to 2034

Figure 183: Middle East and Africa Market Value Share (%) and BPS Analysis by Capacity, 2024 to 2034

Figure 184: Middle East and Africa Market Y-o-Y Growth (%) Projections by Capacity, 2024 to 2034

Figure 185: Middle East and Africa Market Value (US$ Million) Analysis by End Use, 2019 to 2034

Figure 186: Middle East and Africa Market Volume (Units) Analysis by End Use, 2019 to 2034

Figure 187: Middle East and Africa Market Value Share (%) and BPS Analysis by End Use, 2024 to 2034

Figure 188: Middle East and Africa Market Y-o-Y Growth (%) Projections by End Use, 2024 to 2034

Figure 189: Middle East and Africa Market Attractiveness by Orientation, 2024 to 2034

Figure 190: Middle East and Africa Market Attractiveness by Capacity, 2024 to 2034

Figure 191: Middle East and Africa Market Attractiveness by End Use, 2024 to 2034

Figure 192: Middle East and Africa Market Attractiveness by Country, 2024 to 2034

Frequently Asked Questions

At what estimated rate does the top loading cartoning machine market propels?

The top loading cartoning machine market is forecasted to propel at a CAGR of 2.00% through 2034.

What is the estimated market valuation of the top loading cartoning machine market by 2034?

The top loading cartoning machine market will reach USD 1,090.6 million by 2034.

What will the market size of the top loading cartoning machine market be by 2024?

The top loading cartoning machine market will reach USD 795.9 million in 2024.

Based on the orientation, which top loading cartoning machine segment holds the largest market share in 2024?

The top loading cartoning machine market's horizontal segment will hold about 86.1% in 2024.

Based on the end use, which top loading cartoning machine segment holds the largest market share in 2024?

The top loading cartoning machine market's food segment will hold about 35.9% in 2024.

Explore Similar Insights

Future Market Insights

Top Loading Cartoning Machine Market