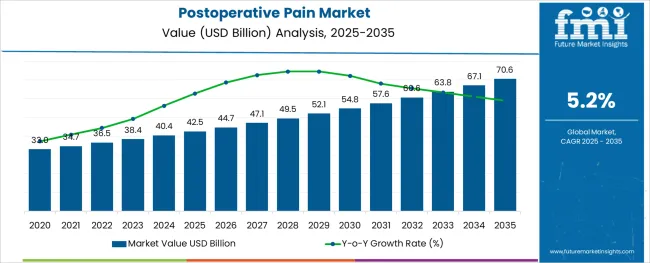
The Postoperative Pain Market is estimated to be valued at USD 42.5 billion in 2025 and is projected to reach USD 70.6 billion by 2035, registering a compound annual growth rate (CAGR) of 5.2% over the forecast period.
The postoperative pain market is undergoing significant transformation as healthcare providers, regulators, and patients seek safer, more effective, and accessible pain management solutions.
Rising surgical volumes, coupled with growing awareness of the impact of unmanaged postoperative pain on recovery and outcomes, are driving the adoption of diverse therapeutic options. Stringent regulations surrounding opioid use and increasing focus on multimodal pain management are shaping innovation and prescribing patterns.
Advances in drug delivery technologies and hospital protocols emphasizing patient-centric care are paving the way for newer formulations and administration routes. Future growth opportunities are expected to arise from the integration of digital monitoring tools, development of non-opioid therapies, and expanded access to pain relief in emerging markets, supporting the market’s long-term evolution and resilience.
The market is segmented by Drug Class, Route of Administration, and Distribution Channel and region. By Drug Class, the market is divided into Opioids, NSAIDs, Local Anesthetic, and Acetaminophen. In terms of Route of Administration, the market is classified into Injectable, Oral, Topical, Transdermal, and Others. Based on Distribution Channel, the market is segmented into Hospital Pharmacies, Retail Pharmacies, Drug Stores, Clinics, and Others. Regionally, the market is classified into North America, Latin America, Western Europe, Eastern Europe, Balkan & Baltic Countries, Russia & Belarus, Central Asia, East Asia, South Asia & Pacific, and the Middle East & Africa.
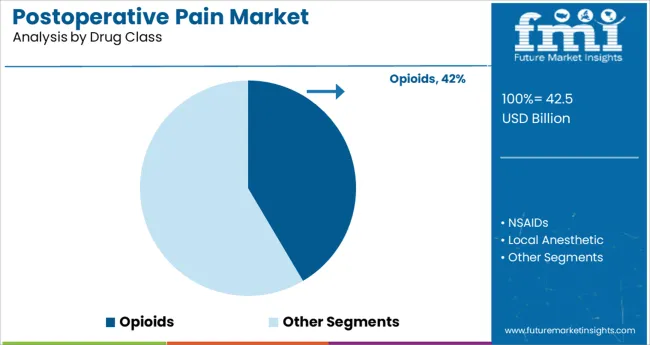
When segmented by drug class, opioids are expected to hold 41.5% of the total market revenue in 2025, making them the leading segment. This leadership is attributed to their strong efficacy in managing moderate to severe postoperative pain and their entrenched role in surgical care protocols.
Despite growing regulatory scrutiny and concerns over dependence, opioids continue to be widely prescribed due to their rapid onset of action and proven clinical effectiveness. Their accessibility, familiarity among practitioners, and ability to address acute pain that other drug classes may not sufficiently control have reinforced their dominance.
Additionally, ongoing development of abuse-deterrent formulations and controlled delivery systems has helped mitigate risks while maintaining their clinical utility, ensuring continued reliance on this class in high-intensity pain scenarios.
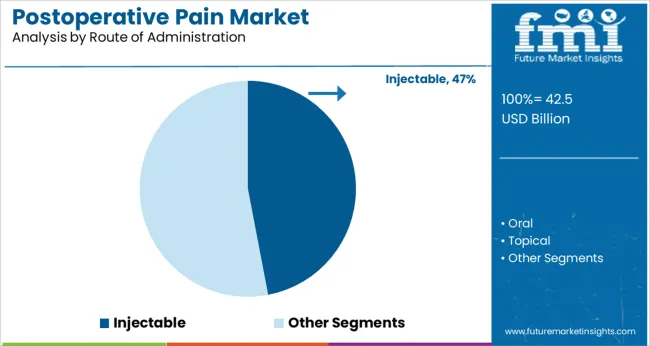
When segmented by route of administration, injectables are projected to command 47.0% of the market revenue in 2025, positioning them as the top choice. This prominence is driven by their rapid onset of action, precise dosing, and suitability for hospital settings where immediate pain relief is critical.
Clinical practice patterns have consistently favored injectables in perioperative care due to their ability to deliver consistent, predictable effects during the crucial postoperative period.
Their versatility in both inpatient and outpatient surgical environments, along with advancements in formulations that improve safety and extend duration of action, have supported their continued preference. Moreover, the widespread availability of skilled healthcare professionals to administer injections and the alignment with standardized hospital protocols have further reinforced this segment’s leading share.
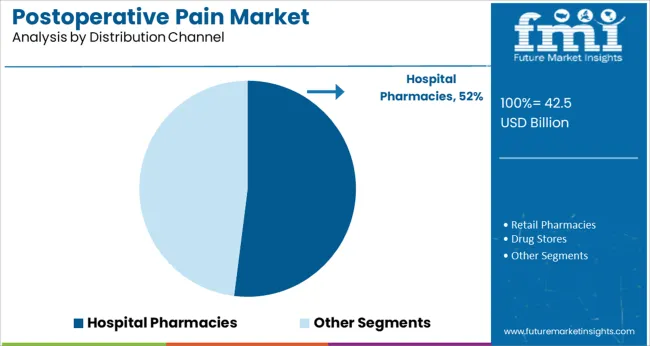
When segmented by distribution channel, hospital pharmacies are anticipated to capture 52.0% of the market revenue in 2025, maintaining their leadership. This dominance stems from their central role in dispensing postoperative pain medications within the controlled environment of hospitals and surgical centers.
Hospital pharmacies ensure proper storage, monitoring, and distribution of high-potency drugs while adhering to strict regulatory requirements. Their integration into multidisciplinary care teams facilitates timely and appropriate pain management, enhancing patient outcomes. Additionally, the concentration of surgical procedures in hospitals and the need for immediate access to a wide range of pain relief options have cemented hospital pharmacies as the preferred channel.
Their ability to oversee compliance, minimize diversion risks, and support evidence-based prescribing practices has solidified their position at the forefront of postoperative pain management delivery.
According to health experts, surgery is linked to long-lasting chronic postoperative pain that typically lasts between three and six months. The demand for postoperative pain is anticipated to rise as phantom pain is one of the frequent postoperative disorders that follows breast surgery, a cesarean section, a thoracotomy, limb amputation, or inguinal hernia repair. Numerous studies carried out in nations with highly established healthcare systems have shown that between one-third and fifty percent of patients do not have adequate postoperative pain management.
The global market for postoperative pain treatments is predicted to experience growth over the forecast period due to an increase in surgical procedures and the intensity of postoperative pain. The global postoperative pain treatment market is anticipated to grow as a result of the development of numerous novel medications. Wide safety margins and advantageous characteristics are being used in the development of new medications.
The importance of non-opioid adjuncts and alternatives has increased for postoperative pain management. Examples of medications that have been popular in the postoperative pain market include intravenous (IV) acetaminophen, non-steroidal anti-inflammatory medicines (NSAIDs), magnesium, ketamine, dexmedetomidine, and liposomal bupivacaine. As a result, postoperative pain therapies now predominate in both emerging and developed markets due to innovative drugs, rising demand, better access, and improved pain management.
| Attribute | Details |
|---|---|
| Postoperative Pain Market Size (2025) | USD 42.5 billion |
| Postoperative Pain Projected Market Value (2035) | USD 70.6 billion |
| Global Postoperative Pain CAGR (2025 to 2035) | 5.2% |
| Market Share of Top 5 Countries | 65% |
Historically, the demand for postoperative pain drugs increased at a CAGR of 4.7% from 2020 to 2025. The market for postoperative pain was worth USD 33 billion in 2020, the market surpassed USD 42.5 billion by 2025. The demand for postoperative pain treatment is anticipated to increase in the future due to an increase in the number of traffic accidents, relative trauma injuries, and relative trauma injuries.
| Attribute | Valuation |
|---|---|
| 2025 | USD 42.53 billion |
| 2035 | USD 70.6 billion |
| 2035 | USD 60.65 billion |
The market is anticipated to grow at a CAGR of 5.2% from 2025 to 2035, surpassing USD 70.6 billion by 2035.
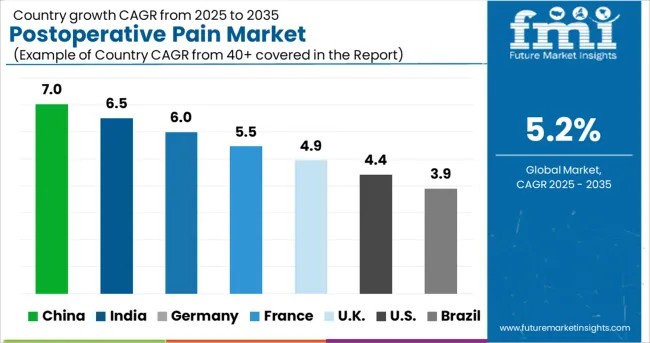
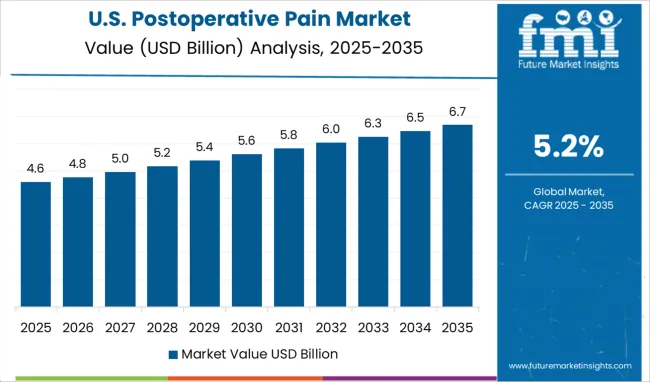
According to projections, the USA is likely to control 87.9% of the market for postoperative pain in North America by 2025. The adoption of opioid treatment is anticipated to lessen the opioid epidemic's rising prevalence in North America, particularly in the United States. For instance, more than 33 million opioid medications were prescribed and given to patients in the United States in 2020.
Furthermore, it is anticipated that the usage of postoperative pain medications would rise in this region due to the strong drug pipeline with effective medications up for FDA clearance. Patients' attitudes have improved in the United States as a result of better compliance with pain treatment suggestions. The country's demand for postoperative pain management pharmaceuticals is probably going to rise as a result of these figures, which will help the industry grow.
Several industry participants are putting strategic plans into action, which is helping the market expand. For instance, Allay Therapeutics, a clinical-stage biotechnology company that has been at the forefront of developing ultra-sustained analgesic products to revolutionize postsurgical pain management and recovery, released the first-ever clinical data demonstrating non-opioid pain relief lasting two weeks after a single administration in May 2024.
In 2025, Germany is anticipated to represent 26.9% of the market for postoperative pain in Europe. The market has grown due to the increasing prevalence and severity of postoperative pain, the launch of promising medications, an increase in surgical operations, and a high rate of pain procedures in developed nations like Germany.
Demand for postoperative pain medications is rising across Germany as opioid maintenance therapy (OMT) for treating opioid dependence (OD) becomes more widely accepted.
Due to the country's rising surgical rate, the postoperative pain market in South Korea is anticipated to grow at a 6.3% CAGR during the forecast period. Many manufacturers of painkillers are forming partnerships, and distribution agreements, and introducing postoperative painkillers in Korea. To increase their position in the worldwide market, major market players are concentrating on various business methods, such as obtaining product approval from regulatory bodies. On May 1, 2020, Grunenthal and Mundipharma struck a distribution and license deal, enabling Mundipharma to market and sell Grunenthal's Tramal (tramadol).
In Japan, opioids are usually prescribed for postoperative pain, but due to an increase in opioid use for non-medical reasons, governing bodies are pressuring doctors to prescribe non-opioid medications, which presents an opportunity for businesses to launch novel non-opioid medications. However, rising concerns about the opioid epidemic in the region and the rising burden of pain on providers of reimbursement are projected to limit the market's ability to grow to some extent.
By drug class, the opioids segment is predicted to grow at a 4% CAGR throughout the projection period to represent a significant proportion of 61.3% in 2025.
Adults who experience moderate to severe post-operative pain are typically treated with opioids, according to the NIH. As a result, over the past ten years, opioid use has increased. Opioid medications are recognized to be useful for treating postoperative pain and have demonstrated the capacity to support patients in accomplishing their clinical goals based on research studies and current trials.
High Demand for Oral Postoperative Pain Procedures
Oral postoperative pain is anticipated to hold 37.8% of the market in 2025 in terms of route of administration. For patients, especially the elderly, the oral route of administration is more convenient and widely accepted, which contributes to a bigger market share in the postoperative pain market. The high share of the market is ascribed to the segment's simplicity and patients' preference for oral drug administration.
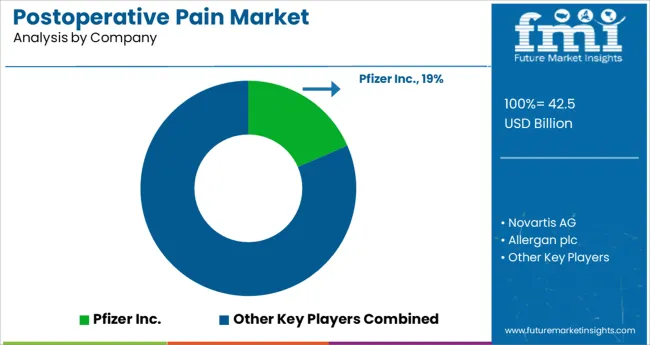
Leading providers of postoperative pain medications are collaborating and acquiring other pharmaceutical firms as their primary approach for the creation of new product lines of pain medications. The demand for painkiller pharmaceuticals is increasing as key stakeholders put more emphasis on the creation of abuse-deterrent opioid drugs and the launch of extended-release non-opioid drugs for post-surgery pain. Similar to this, greater non-narcotic drug discovery and commercialization as well as growing awareness of post-surgery pain management are supporting market expansion.
The market is anticipated to expand as a result of rising acute disease prevalence and an increase in the elderly population in emerging economies. Manufacturers of painkilling drugs should expect great opportunities as patient awareness of procedures and operations grows and as research into pain management expands. Market expansion is anticipated to expand as government efforts to encourage improved postoperative pain management increase.
Recent Developments in the Postoperative Pain Industry:
| Attribute | Details |
|---|---|
| Forecast Period | 2025 to 2035 |
| Historical Data Available for | 2020 to 2024 |
| Market Analysis | billion for Value |
| Key Countries Covered | The USA, Canada, Germany, The United Kingdom, France, Italy, Spain, BENELUX, Russia, China, Japan, South Korea, India, Thailand, Malaysia, Indonesia, Australia, New Zealand, GCC Countries, Turkey, South Africa |
| Key Market Segments Covered | By Drug Class, By Route of Administration, By Distribution Channel, By Region |
| Key Companies Profiled | Novartis AG; Allergan plc; Teva Pharmaceutical Industries Ltd.; Mylan N.V.; Pfizer Inc.; Purdue Pharma L.P; Janssen Pharmaceuticals, Inc.; Endo International plc.; Pacira Pharmaceuticals Inc.; Egalet Corporation; GlaxoSmithKline Plc. |
| Report Coverage | Market Forecast, Competition Intelligence, DROT Analysis, Market Dynamics and Challenges, Strategic Growth Initiatives |
| Customization & Pricing | Available upon Request |
The global postoperative pain market is estimated to be valued at USD 42.5 billion in 2025.
It is projected to reach USD 70.6 billion by 2035.
The market is expected to grow at a 5.2% CAGR between 2025 and 2035.
The key product types are opioids, nsaids, local anesthetic and acetaminophen.
injectable segment is expected to dominate with a 47.0% industry share in 2025.


Our Research Products

The "Full Research Suite" delivers actionable market intel, deep dives on markets or technologies, so clients act faster, cut risk, and unlock growth.

The Leaderboard benchmarks and ranks top vendors, classifying them as Established Leaders, Leading Challengers, or Disruptors & Challengers.

Locates where complements amplify value and substitutes erode it, forecasting net impact by horizon

We deliver granular, decision-grade intel: market sizing, 5-year forecasts, pricing, adoption, usage, revenue, and operational KPIs—plus competitor tracking, regulation, and value chains—across 60 countries broadly.

Spot the shifts before they hit your P&L. We track inflection points, adoption curves, pricing moves, and ecosystem plays to show where demand is heading, why it is changing, and what to do next across high-growth markets and disruptive tech

Real-time reads of user behavior. We track shifting priorities, perceptions of today’s and next-gen services, and provider experience, then pace how fast tech moves from trial to adoption, blending buyer, consumer, and channel inputs with social signals (#WhySwitch, #UX).

Partner with our analyst team to build a custom report designed around your business priorities. From analysing market trends to assessing competitors or crafting bespoke datasets, we tailor insights to your needs.
Supplier Intelligence
Discovery & Profiling
Capacity & Footprint
Performance & Risk
Compliance & Governance
Commercial Readiness
Who Supplies Whom
Scorecards & Shortlists
Playbooks & Docs
Category Intelligence
Definition & Scope
Demand & Use Cases
Cost Drivers
Market Structure
Supply Chain Map
Trade & Policy
Operating Norms
Deliverables
Buyer Intelligence
Account Basics
Spend & Scope
Procurement Model
Vendor Requirements
Terms & Policies
Entry Strategy
Pain Points & Triggers
Outputs
Pricing Analysis
Benchmarks
Trends
Should-Cost
Indexation
Landed Cost
Commercial Terms
Deliverables
Brand Analysis
Positioning & Value Prop
Share & Presence
Customer Evidence
Go-to-Market
Digital & Reputation
Compliance & Trust
KPIs & Gaps
Outputs
Full Research Suite comprises of:
Market outlook & trends analysis
Interviews & case studies
Strategic recommendations
Vendor profiles & capabilities analysis
5-year forecasts
8 regions and 60+ country-level data splits
Market segment data splits
12 months of continuous data updates
DELIVERED AS:
PDF EXCEL ONLINE
Postoperative Nausea and Vomiting (PONV) Management Market Size and Share Forecast Outlook 2025 to 2035
Postoperative Panniculus Retractor Market Trends - Growth & Forecast 2025 to 2035
Paint Cans Market Size and Share Forecast Outlook 2025 to 2035
Painting Robots Market Size and Share Forecast Outlook 2025 to 2035
Pain Monitoring Devices Market Size and Share Forecast Outlook 2025 to 2035
Paint Curing Lamp Market Size and Share Forecast Outlook 2025 to 2035
Paint Booth Market Size and Share Forecast Outlook 2025 to 2035
Pain Therapeutic Injectables Market Size and Share Forecast Outlook 2025 to 2035
Painkillers Market Size and Share Forecast Outlook 2025 to 2035
Painting Tool Market Size and Share Forecast Outlook 2025 to 2035
Pain Therapeutic Solutions Market Size and Share Forecast Outlook 2025 to 2035
Paint Rollers Market Size and Share Forecast Outlook 2025 to 2035
Paint Ingredient Market Size and Share Forecast Outlook 2025 to 2035
Paint Tester Market Size and Share Forecast Outlook 2025 to 2035
Paint Knife Market Size and Share Forecast Outlook 2025 to 2035
Paint Buckets Market Size, Share & Forecast 2025 to 2035
Paint Mixing Market Analysis - Size, Share, and Forecast Outlook for 2025-2035
Pain Management Devices Market Growth - Trends & Forecast 2025 to 2035
Market Share Breakdown of Paint Protection Film Manufacturers
Market Share Insights of Paint Can Manufacturers

Thank you!
You will receive an email from our Business Development Manager. Please be sure to check your SPAM/JUNK folder too.
Chat With
MaRIA