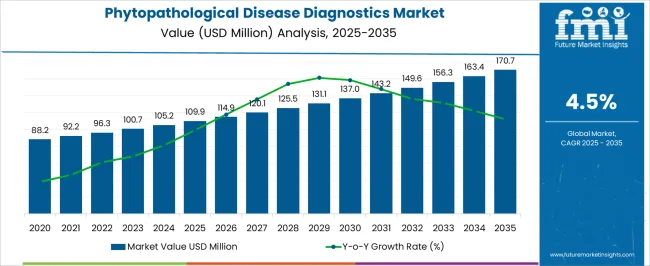
The Phytopathological Disease Diagnostics Market is estimated to be valued at USD 109.9 million in 2025 and is projected to reach USD 170.7 million by 2035, registering a compound annual growth rate (CAGR) of 4.5% over the forecast period.
The phytopathological disease diagnostics market is witnessing accelerated growth, propelled by the increasing incidence of plant diseases and rising global awareness around sustainable crop protection. Agricultural journals and bioscience press releases have emphasized the urgent need for early disease detection tools to mitigate crop losses and ensure food security.
Government-backed agricultural reforms and policies are further encouraging the use of diagnostic tools to support integrated pest management and precision agriculture. Technological advancements in molecular biology have significantly improved diagnostic accuracy, allowing faster identification of pathogens at both pre- and post-harvest stages.
Collaborations between biotechnology firms and agricultural research institutions have led to the development of affordable, field-deployable test kits, expanding diagnostic access in emerging economies. Additionally, climate variability and intensified global trade have contributed to the emergence and spread of new phytopathogens, increasing the demand for robust, scalable diagnostic systems. Market growth is expected to be driven by increasing adoption of ELISA kits for routine surveillance, PCR-based assays for molecular confirmation, and a growing emphasis on seed screening to prevent large-scale disease outbreaks.

| Metric | Value |
|---|---|
| Phytopathological Disease Diagnostics Market Estimated Value in (2025 E) | USD 109.9 million |
| Phytopathological Disease Diagnostics Market Forecast Value in (2035 F) | USD 170.7 million |
| Forecast CAGR (2025 to 2035) | 4.5% |
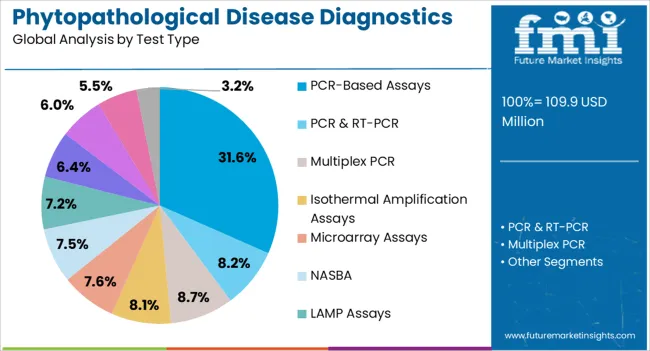
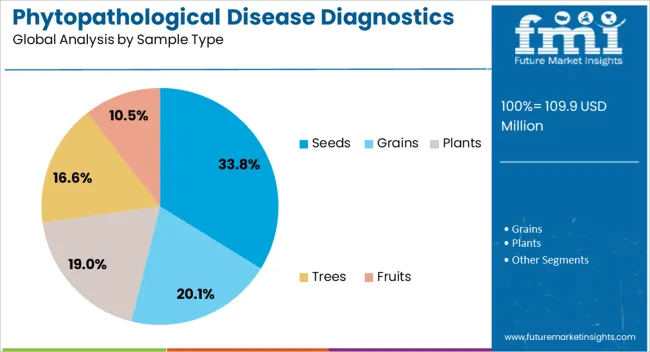
The market is segmented by Product Type, Test Type, Sample Type, and End User and region. By Product Type, the market is divided into ELISA Kits, DNA-Based Diagnostics Kits, Protein-Based Diagnostics Kits, Lateral Flow Devices, DNA/RNA Probes, Accessories And Other Consumables, and Software And Cloud Databases. In terms of Test Type, the market is classified into PCR-Based Assays, PCR & RT-PCR, Multiplex PCR, Isothermal Amplification Assays, Microarray Assays, NASBA, LAMP Assays, ELISA, TBIA, QCMI, and Electronic Technology Tests. Based on Sample Type, the market is segmented into Seeds, Grains, Plants, Trees, and Fruits. By End User, the market is divided into Agricultural Laboratories, Academic And Research Institutes, Food Processing Laboratories, Contract Research Organizations, and Others. Regionally, the market is classified into North America, Latin America, Western Europe, Eastern Europe, Balkan & Baltic Countries, Russia & Belarus, Central Asia, East Asia, South Asia & Pacific, and the Middle East & Africa.

The ELISA Kits segment is projected to contribute 27.4% of the phytopathological disease diagnostics market revenue in 2025, maintaining a strong presence in field and laboratory testing. Growth in this segment has been supported by the ease of use, cost-efficiency, and broad applicability of ELISA-based detection methods in identifying bacterial, fungal, and viral pathogens in crops.
Agricultural extension services and plant health clinics have favored ELISA kits due to their reliability and adaptability to high-throughput screening, especially in resource-limited settings. The simplicity of sample processing and visual readout formats have made ELISA a preferred tool for routine plant health monitoring.
Moreover, commercial availability of crop-specific ELISA kits has facilitated large-scale adoption in seed certification programs and quality assurance processes. As demand for rapid, affordable, and decentralized diagnostic solutions continues to rise, the ELISA Kits segment is expected to remain integral to plant disease surveillance strategies across developed and developing agricultural systems.

The PCR-Based Assays segment is projected to account for 31.6% of the phytopathological disease diagnostics market revenue in 2025, emerging as the leading test type due to its precision, sensitivity, and capacity for early pathogen detection. Growth in this segment has been fueled by the increasing need for molecular diagnostics that can identify pathogens at the genomic level before visible symptoms appear.
Research institutions and commercial labs have relied on PCR for its ability to detect low pathogen loads and differentiate between closely related species, especially in regulated trade environments. Advancements in multiplex and real-time PCR technologies have improved throughput and data accuracy, encouraging wider use in both government and private-sector surveillance programs.
PCR-based assays have also been integrated into automated platforms, streamlining workflows and reducing diagnostic turnaround times. As plant biosecurity becomes a global priority and molecular testing gains mainstream acceptance, the PCR-Based Assays segment is expected to sustain its leadership in high-precision phytopathogen detection.

The Seeds segment is projected to contribute 33.8% of the phytopathological disease diagnostics market revenue in 2025, representing the largest sample type by volume and economic impact. This segment’s growth has been driven by stringent phytosanitary regulations and the need to prevent pathogen transmission through contaminated seed lots.
Seed-borne diseases can result in widespread outbreaks, reduced germination rates, and compromised crop quality, making seed health testing a critical component of agricultural biosecurity. Regulatory authorities and certification bodies have mandated rigorous testing of seed lots for bacterial, viral, and fungal pathogens, supporting demand for diagnostics across commercial seed producers and exporters.
ELISA and PCR technologies have been widely adopted in seed testing labs for their ability to detect infections before sowing, ensuring that only pathogen-free seeds enter the supply chain. The globalization of seed trade and increased enforcement of seed certification programs are expected to reinforce the prominence of the Seeds segment in diagnostic applications.
The Use of DNA Barcoding Picking Up in Accurate Disease Identification
The phytopathological disease diagnostics industry is witnessing a surge in the adoption of DNA barcoding, a technique used for pinpointing organisms in high precision through the use of short, standardized gene sequences.
This allows rapid and high-accuracy detection of plant pathogens. Consequently, the technique will empower farmers and agricultural professionals to use targeted treatment strategies that will avoid unnecessary use of broad-spectrum fungicides.
Mobile Apps Debut for On-Field Disease Detection
Mobile apps are now replacing the very painstaking process of transporting samples to laboratories. User-friendly mobile applications capable of recognizing an image will soon hit the market.
Through these applications, farmers can take images of affected plants in the field. Analysis of these images by the app will provide potential diagnoses that can allow informed decisions about disease management right at the point of detection.
Biosensors for Health Continuous Monitoring
Continuous monitoring, based on biosensor technology is likely the future of plant health management. The sensors are being devised for early symptom and sign detection of diseases by continuous monitoring of physiological parameters like plant respiration or chemical imbalances.
In turn, the detection of early diseases allows timely intervention and, hence, a reduction in crop losses, which permits improved agricultural efficiency.
Quicker and More Accurate Diagnostic Results Using AI
Artificial intelligence has penetrated most scientific fields for a long time, and phytopathological diagnostics should not be an exception.
Indeed, nowadays, AI algorithms are gradually entering modern diagnostic systems that analyze data from numerous sources, including images and sensor readings. All this facilitates quicker and more accurate identification for a faster response to outbreaks and better disease control.
The Rise of Remote Sensing for Large-Scale Disease Tracking
Surveillance for the presence of disease in large fields has been an expensive affair. This is likely to change with the use of drones and satellite remote sensing. The techniques capture high-resolution aerial images of a large area, showing subtle differences in plant health, which will enable the identification of plant disease occurrence and prediction of outbreaks.
This has unlocked large-scale disease surveillance that could predict the possibility of outbreaks, thus facilitating proactive disease management.
Nanotechnology Permits Controlled Release of Pesticides
Nanotechnology is one such area that is promising to provide precision and to be eco-friendly in the management of pests. Research is being carried out to develop nanoparticles, which encapsulate pesticides in a way that allows them to be directly delivered into infected plant tissues.
This approach, again, not only saves the amount of pesticide applied in total to achieve a desired effect but also reduces harm to beneficial insects and environmental systems and brings sustainable changes to the agricultural landscape.
Biocontrol Demand for Eco-Friendly Diagnostics Spurs Biocontrol Growth
With a growing emphasis on sustainability, farmers are increasingly looking for green alternatives in plant disease management. This drives the biocontrol agents market for natural organisms or compounds that can suppress plant pathogens. It will further drive the trend with an increased use of eco-friendly diagnostics tools, for the ability to identify the right biocontrol solutions by the disease.
The global phytopathological disease diagnostics sector has exhibited a trend of continuous growth, with a CAGR of 4% from 2020 to 2025. This phenomenon is brought about by the influence of several major driving forces.
Farmers, as the ones who are familiar with the losses of crops caused by plant diseases, are switching from traditional techniques to using advanced tools for early disease detection and more efficient management.
The development of precise agriculture, the branch of agriculture that uses data for better decision-making, has resulted in a sharp growth in the demand for precise disease diagnostics. Last but not least, government incentives advocating sustainable agricultural practices have contributed a lot to the rise of the sector that was rooted in green diagnostic tools.
By 2035, the phytopathological disease diagnostics demand outlook appears quite promising, and a CAGR of 4.5% is forecasted. On the other hand, better technologies might be the reason for the more gradual growth.
As discussed in the trends section, new technologies, like AI, biosensors, and DNA barcoding, are being incorporated into tools for diagnosis that are faster, more precise, and more user-friendly, and they hold the promise of more efficient disease identification.
Also, an accelerating adoption of subscription-based services that deliver long-term disease management and expert consulting is expected to be the main driving force behind growth. In addition, the increasing attention to ecological agriculture approaches will contribute to the consumption extension of biocontrol agents and diagnostic tools, which are designed for their targeted usage.
Moving to sustained growth is not without its own possible barriers. An economic downturn may put a brake on technological investments in agriculture, and this slowdown may be one of the hindrances to expansion.
Supply chain disruptions that lead to difficulties in the distribution and affordability of diagnostic tools are also a potential issue. The appearance of unpredicted plant diseases may force the diagnostic tools to be changed quickly, which may be a source of further risks to the stability of markets.
The phytopathological disease diagnostics industry witnesses a spike in demand in India and China. Hence, these countries are forecast to offer new players and established companies plenty of opportunities to expand or thrive. Meanwhile, industries in the United States, the United Kingdom, and Germany are moving steadily toward maturation with an average CAGR of 3% over the forecast period.
Countries CAGR 2025 to 2035 United States 3.9% United Kingdom 2.2% Germany 3.1% India 6% China 5.1% Phytopathological Disease Diagnostics Companies in the United States Turn Toward Consistent Innovation The United States remains a leader in the agriculture sector, with its market for phytopathological disease diagnostics expected to hold a constant 3.9% CAGR through 2035.
This is expected, given the country's pace of development in agriculture through consistent and dedicated investment in agricultural research and development. Significant among the observations is the regular investment that the nation keeps making in agricultural research and development, with advancements made more routinely through biosensors and artificial intelligence-driven diagnostics that possibly hold new promises for more accurate and efficient disease identification.
However, it is already placed in the infrastructure for controlling diseases compared to developing countries in the USA agricultural sector. Additionally, basic diagnostic tools will have a potentially higher rate of saturation in the USA sector, requiring stronger value propositions for such tools to the farmers using these technologies. United Kingdom Braces for A Measured Approach Amidst Existing Infrastructure The United Kingdom represents a CAGR of 2.2%, a more measured and cautious reflection of growth in the phytopathological disease diagnostics sector.
The country has the same base as the United States, as there have been long-established, well-defined measures for disease control and a tradition of strong agricultural practices. Although there will be significant penetration of advanced diagnostics into the market, the extent of transition may not be as rapid as for emerging economies.
Such a measured approach is likely because of reasons such as a cost-sensitive approach and because proper maintenance of existing facilities is on the backbone of the agricultural sector in the UK However, ongoing research, coupled with an increasing focus on sustainable farming, is set to propel this industry toward more advanced diagnostic technologies in the long run. India Turns into A Market Primed for Untapped Opportunities India is growing to become one of the potential countries for companies having a CAGR of 6% through 2035.
The reasons for such exponential growth are many and peculiar to the agricultural state of affairs in India. First, agriculture is one of the major support systems of the Indian economy, and early and accurate disease detection is required to protect the large population from hunger and malnutrition. Second, Indian farmers are also becoming increasingly aware that plant diseases are responsible for huge economic losses; therefore, there is a swift movement towards advanced diagnostic tools.
This is not so in developed economies, like the USA and UK, where the existing infrastructure and practices would require a less drastic move toward diagnostic approaches. Better disposable income among farmers and a growing middle class further consolidate potential in the market, giving enough room for these technologies to grow.
The conjuncture of these factors makes India a market ripe for exponential growth in the phytopathological disease diagnostics sector in the coming decade.
By product type, kits emerge as the most popular sales magnet segment with a dominant share in 2025. Also, by test type, the serological tests turn into a potential business driver for companies during the forecast period.
| Segment | Kits (Product Type) |
|---|---|
| Value Share (2035) | 43.4% |
Among the products in the category, diagnostic kits are the most dominant, with a market share of 43.4% by 2025. The kits in the diagnostic kit category go beyond being just a comprehensive and user-friendly strategy for diagnosing disease.
Generally, the kits have everything that is needed for testing on the site, like reagents, devices, and instructions, and these are pre-packaged, which makes the diagnosing process simpler for farmers and agricultural experts. The instrumentalization of user-friendliness implies a positive impact, especially on people with low familiarity with laboratory procedures.
This flexibility in the use of these kits in several disease types makes them a valuable product to address different issues related to crop production.
Growers can opt for sets that are tailored to the types of crops they produce and the diseases they are mostly worried about. The selective strategy significantly reduces the waste of resources while increasing the efficiency of disease management.
| Segment | Serological Tests (Test Type) |
|---|---|
| Value Share (2035) | 58.1% |
By test types, serological tests are leading with a notable share of 58.1% in 2025. These tests, in turn, focus on the detection of antibodies, which are products of the plant’s immune system, in response to specific types of pathogens.
Their efficacy resides in their possibility to detect a disease even in a few minutes so that it can be stopped in its tracks and the crops can be protected from further spread. The timely identification of the disease at this stage is what is required for the implementation of the management measures and reduction of the losses in yield.
Moreover, as a rule, serological tests are usually inexpensive compared with other diagnostic methods and, therefore, serological tests are a cost-effective option for farmers of all scales.
The anticipated widespread use of serological tests puts them in a position to become a key driving force for companies in the diagnostic sub-field of phytopathological diseases. Such a capability of making tests cheaper and faster could be a key competitive advantage in the market of diagnostics.
Moreover, the continuous progress in serological technology, like the invention of multiplex tests that can simultaneously detect pathogens could significantly increase the efficiency of this section in the near future.

The competitive scenario of the phytopathological disease diagnostics industry is anticipated to turn difficult for startups as significant players battle for market share. Established companies are likely to employ several different tactics to hold their places.
Firstly, the ongoing research and development efforts will be the vital stepping stone for the development of advanced diagnostic tools, which will provide greater accuracy, speed, and ease of use.
In the second place, cooperative arrangements with agricultural research institutions and seed enterprises can be of great essence as they will ensure that the product is in the market and also enable the development of tailored solutions for individual crops and diseases.
In the end, well-established companies have a chance to use their distribution chains and brand names as their financial tools in order to remain competitive.
New players, on the other hand, may pose a threat by discarding the conventional and expensive diagnostic methods and by creating less expensive and user-friendly tools.
Moreover, the company can give special attention to niche areas or the implementation of the bio-sensors technology that may help to differentiate itself from competitors. Collaborations among established players and tech startups can give rise to a more vibrant and competitive market. Such a scenario is likely to promote rapid progress and a diversity of solutions for agripreneurs worldwide.
Industry Updates
Product segments in the industry include kits such as ELISA kits, DNA-based diagnostics kits, and protein-based diagnostics kits. Additionally, there are lateral flow devices, DNA/RNA probes, and accessories and other consumables. software and cloud databases are also part of this category.
Test segments encompass molecular tests, which consist of PCR-based assays, PCR & RT-PCR, and multiplex PCR. isothermal amplification assays, microarray assays, NASBA, and LAMP assays are also included. serological tests, like ELSIA, TBIA, and QCMI, along with tests using electronic technology, complete this category.
Sample types for testing include seeds, grains, plants, trees, and fruits.
End users of these products and tests can be agricultural laboratories, academic and research institutes, food processing laboratories, contract research organizations, and others who utilize these tools and technologies for various purposes.
The industry is segmented by regions which are North America, Latin America, Europe, East Asia, South Asia and Pacific, and the Middle East and Africa.
The global phytopathological disease diagnostics market is estimated to be valued at USD 109.9 million in 2025.
The market size for the phytopathological disease diagnostics market is projected to reach USD 170.7 million by 2035.
The phytopathological disease diagnostics market is expected to grow at a 4.5% CAGR between 2025 and 2035.
The key product types in phytopathological disease diagnostics market are elisa kits, dna-based diagnostics kits, protein-based diagnostics kits, lateral flow devices, dna/rna probes, accessories and other consumables and software and cloud databases.
In terms of test type, pcr-based assays segment to command 31.6% share in the phytopathological disease diagnostics market in 2025.


Our Research Products

The "Full Research Suite" delivers actionable market intel, deep dives on markets or technologies, so clients act faster, cut risk, and unlock growth.

The Leaderboard benchmarks and ranks top vendors, classifying them as Established Leaders, Leading Challengers, or Disruptors & Challengers.

Locates where complements amplify value and substitutes erode it, forecasting net impact by horizon

We deliver granular, decision-grade intel: market sizing, 5-year forecasts, pricing, adoption, usage, revenue, and operational KPIs—plus competitor tracking, regulation, and value chains—across 60 countries broadly.

Spot the shifts before they hit your P&L. We track inflection points, adoption curves, pricing moves, and ecosystem plays to show where demand is heading, why it is changing, and what to do next across high-growth markets and disruptive tech

Real-time reads of user behavior. We track shifting priorities, perceptions of today’s and next-gen services, and provider experience, then pace how fast tech moves from trial to adoption, blending buyer, consumer, and channel inputs with social signals (#WhySwitch, #UX).

Partner with our analyst team to build a custom report designed around your business priorities. From analysing market trends to assessing competitors or crafting bespoke datasets, we tailor insights to your needs.
Supplier Intelligence
Discovery & Profiling
Capacity & Footprint
Performance & Risk
Compliance & Governance
Commercial Readiness
Who Supplies Whom
Scorecards & Shortlists
Playbooks & Docs
Category Intelligence
Definition & Scope
Demand & Use Cases
Cost Drivers
Market Structure
Supply Chain Map
Trade & Policy
Operating Norms
Deliverables
Buyer Intelligence
Account Basics
Spend & Scope
Procurement Model
Vendor Requirements
Terms & Policies
Entry Strategy
Pain Points & Triggers
Outputs
Pricing Analysis
Benchmarks
Trends
Should-Cost
Indexation
Landed Cost
Commercial Terms
Deliverables
Brand Analysis
Positioning & Value Prop
Share & Presence
Customer Evidence
Go-to-Market
Digital & Reputation
Compliance & Trust
KPIs & Gaps
Outputs
Full Research Suite comprises of:
Market outlook & trends analysis
Interviews & case studies
Strategic recommendations
Vendor profiles & capabilities analysis
5-year forecasts
8 regions and 60+ country-level data splits
Market segment data splits
12 months of continuous data updates
DELIVERED AS:
PDF EXCEL ONLINE
Liver Disease Diagnostics Market Size and Share Forecast Outlook 2025 to 2035
Celiac Disease Diagnostics Market Analysis - Size, Share & Forecast 2025 to 2035
Shrimps Disease Diagnostics Market Size and Share Forecast Outlook 2025 to 2035
Wilson’s Disease Diagnostics Market Analysis – Size, Share & Forecast 2023-2033
Infectious Disease Diagnostics Market Size and Share Forecast Outlook 2025 to 2035
Infectious Disease Molecular Diagnostics Market Size and Share Forecast Outlook 2025 to 2035
Neuro-Auto-Immune Disease Diagnostics Market Size and Share Forecast Outlook 2025 to 2035
Animal Auto-Immune Disease Diagnostics Market Size and Share Forecast Outlook 2025 to 2035
Sexually Transmitted Diseases (STD) Diagnostics Market Analysis by Laboratory Devices & Point of Sales Through 2034
Veterinary Infectious Disease Diagnostics Market Size and Share Forecast Outlook 2025 to 2035
Veterinary Neurodegenerative Disease Diagnostics Market Size and Share Forecast Outlook 2025 to 2035
Blood-based Biomarker For Alzheimer's Disease Diagnostics Market Size and Share Forecast Outlook 2025 to 2035
Disease Resistant Mask Market Analysis - By Type, Material, End-User, Distribution Channel, and Region - Trends, Growth & Forecast 2025 to 2035
DNA Diagnostics Market Size and Share Forecast Outlook 2025 to 2035
HIV Diagnostics Market Size and Share Forecast Outlook 2025 to 2035
Rare Disease Clinical Trials Market Size and Share Forecast Outlook 2025 to 2035
Food Diagnostics Services Market Size, Growth, and Forecast for 2025–2035
The lung disease therapeutics market is segmented by disease type, treatment type and distribution channel from 2025 to 2035
Rare Disease Gene Therapy Market
Swine Disease Diagnostic Kit Market Size and Share Forecast Outlook 2025 to 2035

Thank you!
You will receive an email from our Business Development Manager. Please be sure to check your SPAM/JUNK folder too.
Chat With
MaRIA