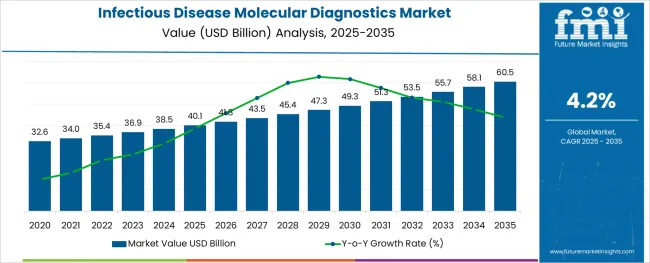
The Infectious Disease Molecular Diagnostics Market is estimated to be valued at USD 40.1 billion in 2025 and is projected to reach USD 60.5 billion by 2035, registering a compound annual growth rate (CAGR) of 4.2% over the forecast period.
The alginic acid market is undergoing consistent growth, propelled by rising demand from food processing, pharmaceutical formulations, and cosmetic applications. A growing focus on natural and sustainable ingredients in manufacturing processes has positioned alginic acid as a preferred biopolymer across industries.
The market is further supported by its diverse functional benefits, including water retention, gelling, and stabilizing properties, which make it indispensable in high-performance formulations. Increased regulatory acceptance of alginates as safe additives and the push towards cleaner labeling in food and personal care products have reinforced their adoption.
Ongoing innovation in extraction technologies and the utilization of algae as a renewable resource are paving the way for cost-effective production and expanded applications, ensuring sustained market expansion in the coming years.
The market is segmented by Technology, Product Type, End Use, and Application and region. By Technology, the market is divided into Polymerase chain reaction (PCR), In Situ Hybridization, Isothermal Nucleic Acid Amplification Technology (INAAT), Chips and Microarrays, Mass Spectrometry, Sequencing, and Others. In terms of Product Type, the market is classified into Instruments, Reagents, and Services. Based on End Use, the market is segmented into Hospitals, Clinics, Diagnostics Laboratories, and Research Institutes. By Application, the market is divided into Respiratory Diseases, Tuberculosis, Meningitis, Gastrointestinal Tract Infections, HPV, Sexually Transmitted Infections, Sepsis, Drug Resistance Diseases, and Other Infectious Diseases. Regionally, the market is classified into North America, Latin America, Western Europe, Eastern Europe, Balkan & Baltic Countries, Russia & Belarus, Central Asia, East Asia, South Asia & Pacific, and the Middle East & Africa.
The market is segmented by Technology, Product Type, End Use, and Application and region. By Technology, the market is divided into Polymerase chain reaction (PCR), In Situ Hybridization, Isothermal Nucleic Acid Amplification Technology (INAAT), Chips and Microarrays, Mass Spectrometry, Sequencing, and Others. In terms of Product Type, the market is classified into Instruments, Reagents, and Services. Based on End Use, the market is segmented into Hospitals, Clinics, Diagnostics Laboratories, and Research Institutes. By Application, the market is divided into Respiratory Diseases, Tuberculosis, Meningitis, Gastrointestinal Tract Infections, HPV, Sexually Transmitted Infections, Sepsis, Drug Resistance Diseases, and Other Infectious Diseases. Regionally, the market is classified into North America, Latin America, Western Europe, Eastern Europe, Balkan & Baltic Countries, Russia & Belarus, Central Asia, East Asia, South Asia & Pacific, and the Middle East & Africa.
When segmented by salts, sodium alginate is expected to command 27.5% of the market revenue in 2025, marking it as the leading subsegment in this category. This leadership has been driven by its superior solubility, ease of incorporation into formulations, and versatility in a wide range of applications.
Its ability to form stable gels and maintain viscosity under varying conditions has made it highly sought after in both food and pharmaceutical sectors. Manufacturers have prioritized sodium alginate due to its consistent performance, cost-effectiveness, and regulatory acceptance, which have collectively strengthened its position.
The segment’s prominence has also been enhanced by its adaptability to evolving consumer preferences for plant-derived and sustainable ingredients, reinforcing its market share.
Segmented by end user industry, the food industry is projected to hold 33.0% of the market revenue in 2025, positioning it as the most prominent sector. This dominance has been shaped by the industry’s increasing reliance on alginic acid and its derivatives to deliver desirable textures, stabilize emulsions, and improve shelf life of processed foods.
As consumer demand for clean label and natural additives has intensified, the food sector has responded by integrating alginates into bakery, dairy, and confectionery products. Enhanced production efficiency and compliance with food safety standards have further encouraged widespread use.
The segment’s leadership has also been supported by product differentiation strategies where alginates contribute to premium quality and innovation, securing their role in modern food formulations.
When analyzed by functionality, thickening agents are forecast to account for 29.0% of the market revenue in 2025, establishing themselves as the dominant functional category. This preeminence has been underpinned by the growing need for consistent texture and viscosity in a wide array of end products.
Alginic acid’s natural origin and high efficiency in creating uniform, stable thickness without altering taste or color have solidified its appeal. The demand for thickeners in both edible and topical applications has expanded, with manufacturers leveraging its rheological properties to meet performance and regulatory requirements.
The functionality’s leading share has also been reinforced by the ability to deliver cost savings through lower dosages and its compatibility with other ingredients, securing its position as an indispensable component in formulation strategies.
The global market for the Infectious Disease Molecular Diagnostics Market expanded at a CAGR of 3.8% over the last four years (2020 to 2024). Future Market Insights’ analysis reveals that in 2025 revenue through the market is estimated at USD 40.1 billion. With an absolute dollar opportunity of USD 18 billion from 2025 to 2035, the market is projected to reach a valuation of USD 60.5 billion by 2035.
The USA will continue to be the largest consumer of the Infectious Disease Molecular Diagnostics Market throughout the analysis period accounting for over USD 5.8 billion absolute dollar opportunity in the coming 10-year period
Global outbreaks of deadly infectious diseases caused by pathogenic microorganisms have threatened public health worldwide and significantly motivated researchers to develop rapid and accurate detection methods for pathogens. Culture-based techniques are considered gold standards for pathogen detection globally.
However, the long result time associated with these techniques due to overnight culturing and limited pathogen isolation has slowed their demand to a certain extent. Over the past several years, innovations in molecular diagnostic technology and their use have fundamentally altered the ability to handle infectious diseases. It provides quicker and more reliable results at 30% less cost to the customers.
Although still in its infancy, pharmacogenomics has the potential to grow into a rich industry as demand for tailored medication rises. As the driving force behind the transition to personalized medicine, many pharmaceutical companies are assessing revenue models based on molecular diagnostics for pharmacogenomics testing.
One of the key factors limiting the growth of the infectious disease molecular diagnostics market is inadequate reimbursements. The hurdles to getting Medicare insurance to pay for diagnostic tests are a significant concern for diagnostic organizations.
In 2020, Medicare in the USA tightened constraints on I.V.D. diagnostic claims, which affected molecular diagnostic tests in particular. These molecular pathology tests might be billed using unlisted medical codes rather than the American Medical Association's Current Procedural Terminology (CPT) numbers. Medicare Administrative Contractors (MACs) set the allowable cost amount for the billing locality in these cases.
The entirety of the clinical lab will gradually be expected to execute molecular diagnostics testing on a regular basis. Venture capitalists, who formerly preferred not to make investments in this area, will progressively grow more enthusiastic about investing in molecular diagnostic businesses as the field of molecular diagnostics progresses.
The American Cancer Society estimates that there will be 1.7 million new instances of cancer in the US this year and more than 606 thousand cancer-related deaths. Therefore, it is predicted that over the forecast period, the demand for molecular diagnostics would expand due to the rising incidence of cancer and increased public awareness of the importance of early cancer detection.
The development and global distribution agreement for molecular testing in Mexico to find new sexually-transmitted infections were announced by Becton Dickinson and Euroclone in February 2020. The market is projected to expand in the future due to rising diseases and innovation in North America.
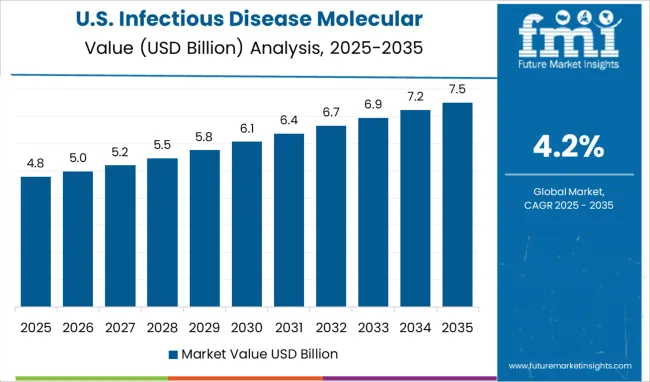
The USA will account for over USD 60.5 billion of the global market by 2035. 6 out of 10 of America's adults have a chronic disease, and 4 out of 10 people have two or more diseases. , as of January 2024, according to a report made public by the National Center for Chronic Disease Prevention and Health Promotion.
The US FDA had received emergency use authorization requests from Becton, Dickinson, and Company, and BioGX Inc. for novel diagnostic tests, the two businesses announced in March 2024.
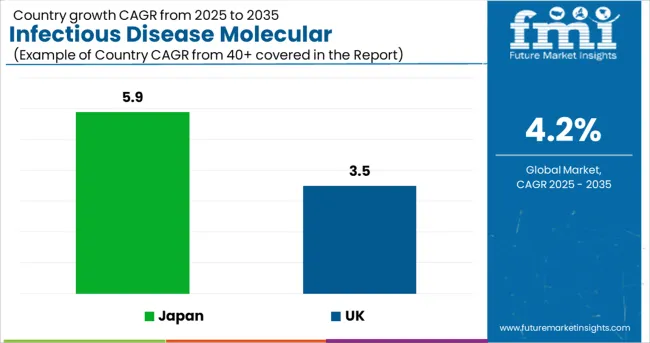
The market in the UK is expected to reach USD 38.5 billion, growing from USD 1.5 billion in 2024. The market in the country is projected to expand at a CAGR of 3.5% from 2025 to 2035, and prosper with an absolute dollar opportunity of USD 644 million.
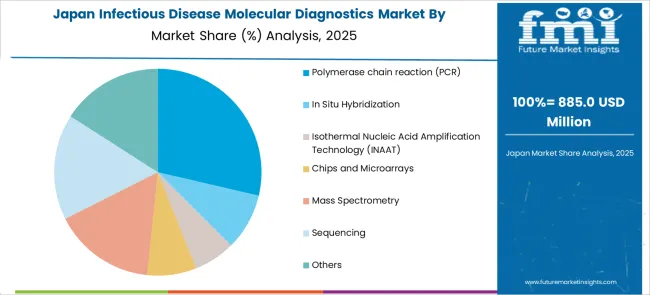
The market in Japan is expected to gross an absolute dollar opportunity of USD 40.1 million from 2025 to 2035. During this period, the market is projected to register a CAGR of 5.9% to reach a market size of USD 2.3 billion by 2035.
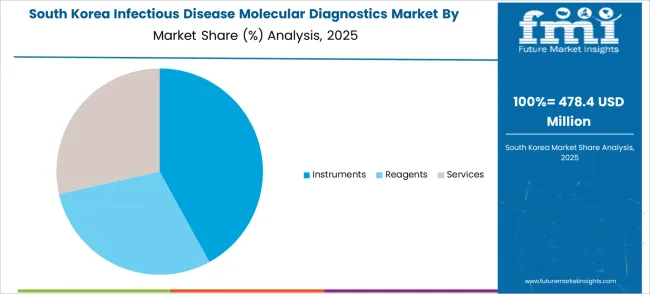
The market in South Korea is expected to gross an absolute dollar opportunity of USD 400 million from 2025 to 2035. The market is likely to reach a valuation of USD 1.1 billion by 2035.
The Polymerase Chain Reaction (PCR) segment account for over 30% of the technology category of the global Infectious Disease Molecular Diagnostics Market. The market growth from 2020 to 2024 was estimated at 4.4% CAGR. A qualitative outcome of a PCR investigation may be required for the detection of genetic polymorphisms, inherited disorders, somatic mutations, including cancer, and the presence of viral or microbial infections.
Quantitative PCR is increasingly needed, for instance, to assess a pathogen's titer, the quantity of infected or altered cells in a tissue, and the concentration of particular mRNAs.
PCR has several uses in medicine, including tissue typing for organ and tissue transplants. Commercially, HLA DQa locus analysis kits are currently readily available. The application of PCR for forensic purposes is associated with this application. The PCR can use this area, in particular, to take advantage of its extreme sensitivity.
At present, many diagnostics firms that were under-represented in this area have sought partners or acquisitions to gain exposure, reflecting the growing interest in personalized medicine.
The key companies operating in the market include F. Hoffmann-La Roche Ltd., Hologic, Inc., Thermo Fisher Scientific, Inc., PerkinElmer, Inc., Abbott Laboratories, bioMérieux SA, QIAGEN N.V., Myriad Genetics, Inc., Siemens Healthineers AG, Danaher Corporation, Illumina, Inc., Becton Dickinson and Company, Grifols, S.A., Quidel Corporation, Agilent Technologies, Inc., DiaSorin S.p.a. (Italy), Exact Sciences Corporation, Genetic Signatures, MDx Health, Biocartis NV, TBG Diagnostics Limited, HTG Molecular Diagnostics, Inc., Vela Diagnostics, Amoy Diagnostics Co., Ltd., ELITechGroup, Molbio Diagnostics Pvt. Ltd., Savyon Diagnostics, Abacus Diagnostica Oy, and geneOmbio Technologies Pvt. Ltd.
Some of the recent developments by key providers of Infectious Disease Molecular Diagnostics are as follows:
Similarly, recent developments related to companies manufacturing infectious disease molecular diagnostics kits have been tracked by the team at Future Market Insights, which is available in the full report.
The global infectious disease molecular diagnostics market is estimated to be valued at USD 40.1 billion in 2025.
It is projected to reach USD 60.5 billion by 2035.
The market is expected to grow at a 4.2% CAGR between 2025 and 2035.
The key product types are polymerase chain reaction (pcr), in situ hybridization, isothermal nucleic acid amplification technology (inaat), chips and microarrays, mass spectrometry, sequencing and others.
instruments segment is expected to dominate with a 42.7% industry share in 2025.


Full Research Suite comprises of:
Market outlook & trends analysis
Interviews & case studies
Strategic recommendations
Vendor profiles & capabilities analysis
5-year forecasts
8 regions and 60+ country-level data splits
Market segment data splits
12 months of continuous data updates
DELIVERED AS:
PDF EXCEL ONLINE
Infectious Enteritis Treatment Market
Infectious Disease Diagnostics Market Size and Share Forecast Outlook 2025 to 2035
Veterinary Infectious Disease Therapeutics Market
Veterinary Infectious Disease Diagnostics Market Size and Share Forecast Outlook 2025 to 2035
Disease Resistant Mask Market Analysis - By Type, Material, End-User, Distribution Channel, and Region - Trends, Growth & Forecast 2025 to 2035
Rare Disease Clinical Trials Market Size and Share Forecast Outlook 2025 to 2035
The lung disease therapeutics market is segmented by disease type, treatment type and distribution channel from 2025 to 2035
Rare Disease Gene Therapy Market
Swine Disease Diagnostic Kit Market Size and Share Forecast Outlook 2025 to 2035
Fabry Disease Market Size and Share Forecast Outlook 2025 to 2035
Byler Disease Market
Liver Disease Diagnostics Market Size and Share Forecast Outlook 2025 to 2035
Airway Disease Treatment Market Size and Share Forecast Outlook 2025 to 2035
Celiac Disease Diagnostics Market Analysis - Size, Share & Forecast 2025 to 2035
Chronic Disease Management Market Size and Share Forecast Outlook 2025 to 2035
The Addison Disease Testing Market Is Segmented by Test Type, and End User from 2025 To 2035
Pleural Diseases Therapeutics Market – Drug Trends & Future Outlook 2025 to 2035
Crohn’s Disease (CD) Treatment Market Analysis & Forecast by Drug Type, Distribution Channel and Region through 2035
Shrimps Disease Diagnostics Market Size and Share Forecast Outlook 2025 to 2035
Sandhoff Disease Therapeutics Market Size and Share Forecast Outlook 2025 to 2035

Thank you!
You will receive an email from our Business Development Manager. Please be sure to check your SPAM/JUNK folder too.
Chat With
MaRIA