Methodology

Seabed Crawler Market Forecast and Outlook 2025 to 2035

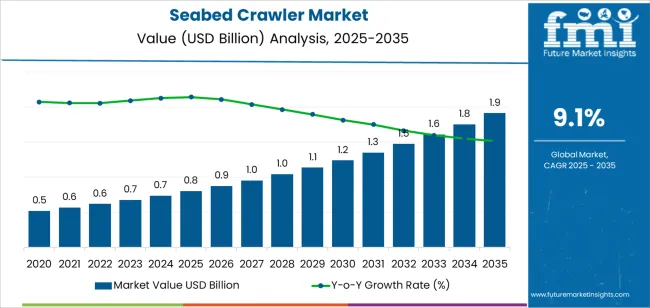
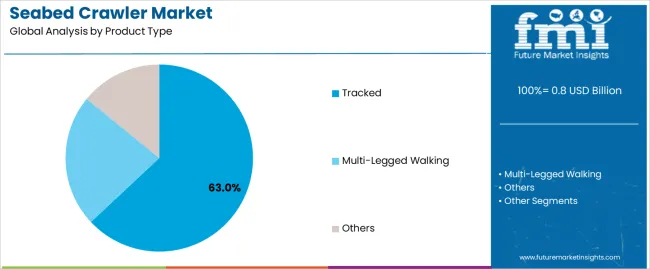
The seabed crawler market is forecast to expand from USD 0.8 billion in 2025 to USD 1.9 billion by 2035, at a CAGR of 9.1%, driven primarily by segment-level demand across propulsion formats and end-use missions. Tracked crawlers dominate with a 63.0% share due to their superior traction, load-handling stability, and ability to move across soft sediments, sloped terrain, and irregular substrates. This segment aligns with high-intensity commercial operations such as trenching, cable burial, deepwater inspection, and heavy-duty geotechnical work. Their compatibility with modular trenchers, cutters, survey sleds, and intervention tool skids further reinforces segment leadership in both shallow and deepwater deployments. Multi-legged walking crawlers constitute a 27.0% specialized segment used in research, ecological surveys, and inspection tasks that require precise negotiation of fragile or rocky environments.

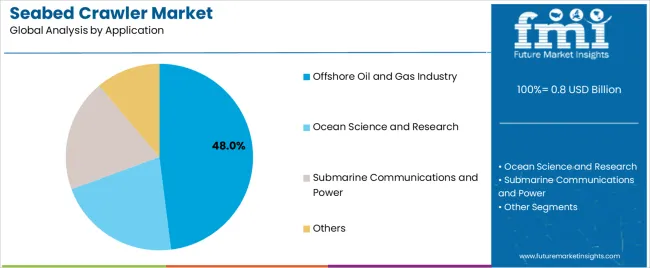
The offshore oil and gas industry leads application segmentation at 48.0%, where crawlers support pipeline inspection, structural monitoring, umbilical placement, route clearance, and seabed preparation for subsea installations. Their high endurance, stable positioning, and integration with HD imaging, sonar, and multi-sensor survey payloads make them essential for deepwater maintenance and expansion projects. Ocean science and research, at 28.0%, relies on compact crawlers equipped with sediment-sampling tools, imaging suites, and benthic-habitat mapping systems. Submarine communications and power, representing 17.0%, deploy crawlers for cable laying, burial, inspection, and repair across long-distance marine routes.
Quick Stats for Seabed Crawler Market

  • Seabed Crawler Market Value (2025): USD 0.8 billion
  • Seabed Crawler Market Forecast Value (2035): USD 1.9 billion
  • Seabed Crawler Market Forecast CAGR (2025–2035): 9.1%
  • Leading Type in Seabed Crawler Market: Tracked.
  • Key Growth Regions in Seabed Crawler Market: Asia Pacific, Europe, North America.
  • Top Players in Seabed Crawler Market: Royal IHC, Saab Seaeye, Oceaneering International, ECA Group, Fugro, Soil Machine Dynamics, TechnipFMC, Forum Energy Technologies, Kawasaki Heavy Industries, Hyundai Heavy Industries.

Seabed Crawler Market Market Value Analysis

Asia Pacific leads market growth, supported by expanding offshore energy and subsea mapping programs in China, Japan, and Australia. Europe and North America maintain strong demand through offshore wind expansion, subsea cables, and oil and gas activities. Key companies include Royal IHC, Saab Seaeye, Oceaneering International, ECA Group, Fugro, and Soil Machine Dynamics, focusing on crawler durability, modular tooling, and enhanced subsea mobility.

What is the Growth Forecast for the Seabed Crawler Market through 2035?

Breakpoint analysis shows two key transition phases shaped by subsea mining activity, offshore energy expansion, and advances in underwater robotics. The first breakpoint, expected between 2026 and 2029, will occur as seabed crawlers gain wider use in offshore oilfield inspection, pipeline monitoring, and deep-sea mineral exploration. Rising investment in autonomous underwater systems and improved crawler mobility will accelerate adoption during this period.

A second breakpoint is likely between 2031 and 2033 as the market transitions from capability-driven expansion to structured operational deployment. During this stage, demand will shift toward high-endurance crawlers with advanced sensing, navigation stability, and low-impact sediment interaction for regulated marine environments. Growth will stabilize as major offshore operators standardize the use of crawlers across maintenance routines and exploration projects. The progression across these breakpoints reflects a market moving from early technology integration to mature operational adoption, supported by robotics enhancements, subsea infrastructure development, and an increasing reliance on unmanned systems for deep-water inspection and resource-assessment tasks.

Seabed Crawler Market Key Takeaways

Metric Value
Market Value (2025) USD 0.8 billion
Market Forecast Value (2035) USD 1.9 billion
Forecast CAGR (2025-2035) 9.1%

Why is the Seabed Crawler Market Growing?

The seabed crawler market is growing because offshore infrastructure development, underwater resource extraction and subsea inspection tasks require vehicles capable of operating on the seabed. Crawlers provide mobility and stability on the ocean floor, making them well suited for pipeline inspection, cable burial, subsea mining operations and marine research. Demand is rising in oil & gas, offshore wind, deep-sea mining and defence sectors where precise and reliable underwater work is critical. Advances in crawler technology, including autonomous navigation, real-time sensor payloads and improved manoeuvrability on uneven seabeds, expand the utility of the platform under challenging conditions.

Growth is also supported by increased global investment in subsea infrastructure, rising exploration of deep ocean resources and focus on maintaining existing assets. The market faces constraints such as extremely high development and operational costs, complex regulatory requirements related to environmental impact and subsea operations and technical challenges associated with deep-water pressure, remote communication and maintenance. The niche nature of the market means volume growth is limited compared to broader subsea equipment segments.

Which Product Type and Application Segments Lead the Seabed Crawler Market?

The seabed crawler market is segmented by product type and application. By product type, the market includes tracked, multi-legged walking, and others. Based on application, it is categorized into offshore oil and gas industry, ocean science and research, submarine communications and power, and others. Regionally, the market is divided into Asia Pacific, Europe, North America, and other key regions.
By Product Type, the Tracked Segment Accounts for the Largest Market Share

Seabed Crawler Market Analysis By Product Type

The tracked segment holds the leading position in the seabed crawler market, representing an estimated 63.0% of total market share in 2025. Tracked crawlers provide high traction, stability, and load-bearing capability on soft sediments, slopes, and uneven seabed terrains. These characteristics support their widespread use in offshore inspection, pipeline intervention, and seabed trenching operations.

Tracked platforms also offer strong operational endurance and compatibility with heavy tooling systems, making them suitable for long-duration subsea tasks. The multi-legged walking segment, estimated at 27.0%, serves specialized missions requiring precise maneuvering around obstacles, fragile ecosystems, or irregular seabed structures. The others category, representing roughly 10.0%, includes hybrid mobility systems and emerging crawler concepts used in low-intensity research missions.

Key factors supporting the tracked segment include:
  • High operational stability on varied seabed substrates.
  • Strong integration capability with trenching, cutting, and inspection tools.
  • Broad adoption across commercial subsea infrastructure projects.
  • Reliable performance under deepwater pressure and harsh marine conditions.

By Application, the Offshore Oil and Gas Industry Segment Represents the Dominant Market Category

Seabed Crawler Market Analysis By Application

The offshore oil and gas industry segment accounts for approximately 48.0% of the seabed crawler market in 2025. Crawlers are used for pipeline inspection, seabed trenching, cable burial, structural monitoring, and maintenance support in offshore production fields. Demand is driven by the need for reliable subsea intervention systems that can operate at significant depths with minimal human risk.

The ocean science and research segment follows with an estimated 28.0%, using crawlers for benthic habitat studies, sediment sampling, and environmental monitoring. The submarine communications and power segment, representing about 17.0%, employs crawlers for cable laying, inspection, and protective trenching. The others category, at around 7.0%, includes defense applications and underwater archaeological work.

Primary dynamics driving demand from the offshore oil and gas industry segment include:

  • Extensive subsea infrastructure requiring regular inspection and maintenance.
  • Increased use of robotic systems to reduce operational risk and cost.
  • Demand for precise trenching and burial systems for pipelines and umbilicals.
  • Growth in deepwater field development and extended subsea production systems.

What are the Drivers, Restraints, and Key Trends of the Seabed Crawler Market?

Rising demand for subsea mineral exploration, increased offshore energy development, and growth in seabed inspection and maintenance activities are driving market growth.

The seabed crawler market is expanding as offshore industries adopt robotic systems designed for stable movement and heavy-duty operations on the ocean floor. Deep-sea mineral exploration projects rely on crawlers to survey, sample, and transport seabed materials in environments where traditional vessels or divers cannot operate safely. Offshore oil, gas, and renewable energy operators use crawlers for structural inspection, buried pipeline tracking, sediment analysis, and seabed preparation. Growing construction of offshore wind farms increases the need for seabed levelling and cable burial systems, which strengthens crawler demand. Advances in hydrodynamic design, traction control, and subsea navigation improve crawler reliability in soft sediments and uneven terrain. Rising use of high-resolution sonar, imaging units, and autonomous capabilities further supports adoption across research and industrial applications.

High capital cost, strict regulatory oversight, and operational challenges in extreme deep-sea environments are restraining adoption.

Seabed crawlers require specialised engineering, corrosion-resistant materials, sealed electronic housings, and robust propulsion systems, which increase manufacturing and deployment costs. Regulatory requirements for environmental protection, sediment disturbance management, and resource extraction approvals add complexity, especially for deep-sea mining activities. Operating at high pressure and low visibility can lead to performance limitations, greater maintenance needs, and higher mission risk. Smaller enterprises or academic institutions may face budget constraints that limit access to large-scale crawler systems, particularly those equipped for deep water. Logistics for deployment, retrieval, and vessel support further increase operational cost.

Growth in autonomous subsea systems, expansion of deep-sea research programs, and development of hybrid crawler-remotely operated platforms are shaping industry trends.

Manufacturers are introducing crawlers with advanced autonomy, real-time mapping, and adaptive traction for long-duration missions. Research institutions are increasing investment in benthic ecosystem monitoring, seafloor mapping, and subsea geology, which expands demand for compact scientific crawlers. Hybrid platforms that combine crawler stability with ROV mobility are gaining traction for cable burial, trenching, and targeted sampling. These innovations support broader adoption across exploration, environmental assessment, and offshore infrastructure maintenance.

Analysis of the Seabed Crawler Market by Key Country

The global seabed crawler market is expanding through 2035, supported by increased offshore exploration, wider adoption of underwater inspection systems, and rising demand for seabed-intervention equipment in energy, research, and marine-engineering operations. China leads with a 12.3% CAGR, followed by India at 11.4%, reflecting strong investment in ocean-technology capabilities and offshore infrastructure. Germany grows at 10.5%, supported by engineering expertise and regulated marine-technology applications. Brazil records 9.6%, driven by offshore oil-and-gas activity. The United States grows at 8.6%, while the United Kingdom (7.7%) and Japan (6.8%) sustain steady demand through established marine-research and subsea-engineering programs.
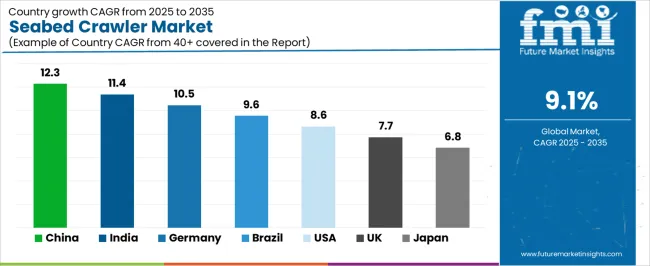
Seabed Crawler Market Cagr Analysis By Country

Country CAGR (%)
China 12.3
India 11.4
Germany 10.5
Brazil 9.6
USA 8.6
UK 7.7
Japan 6.8

How is China leading the Seabed Crawler Market?

China’s market grows at 12.3% CAGR, driven by expanding offshore-energy operations, rapid development of marine-engineering capabilities, and rising investment in ocean-technology infrastructure. Seabed crawlers are used for underwater inspection, pipeline monitoring, sediment profiling, and shallow-depth intervention tasks across coastal industrial zones. Universities, marine-research institutes, and offshore-engineering firms adopt crawler platforms equipped with sonar imaging, laser-based profiling tools, sediment-sampling modules, and high-capacity mobility systems designed to operate on varied seabed textures. Growth in offshore-wind deployment and subsea-infrastructure expansion strengthens long-term procurement of advanced robotic crawlers. Domestic developers introduce corrosion-resistant housings, modular toolheads, and integrated control systems suited for continuous offshore operations in harsh environments.

Key Market Factors:

  • Strong expansion in offshore-wind, oil-and-gas, and subsea-infrastructure projects.
  • Increased deployment of sonar-equipped and modular robotic crawlers.
  • Growth in marine-research programs adopting profiling and sampling tools.
  • Development of corrosion-resistant crawler systems for long-duration use.

How is India advancing the Seabed Crawler Market?

India’s market grows at 11.4% CAGR, supported by expanding offshore-exploration activities, coastal-infrastructure development, and increased use of underwater-inspection robotics. Seabed crawlers are deployed for port-survey operations, pipeline monitoring, benthic-habitat assessment, and sediment-mobility studies aligned with coastal-protection projects. Marine-research centers and ocean-technology institutes incorporate crawlers into seabed-mapping programs using structured-light imaging, wide-band sonar, and sediment-sampling attachments. Offshore-energy and maritime-infrastructure projects increase demand for corrosion-resistant, low-profile crawler designs operated in silt-rich and variable-terrain conditions. Broader national investments in ocean-research capabilities reinforce recurring procurement across research, dredging, and coastal-engineering units.

Market Development Factors:
  • Growing use in port surveys, sediment analysis, and coastal-engineering projects.
  • Increased adoption by marine-research institutes for benthic studies.
  • Demand for crawlers suited to shallow-water and variable-terrain conditions.
  • Broader deployment in offshore-energy and maritime-infrastructure operations.

How is Germany advancing the Seabed Crawler Market?

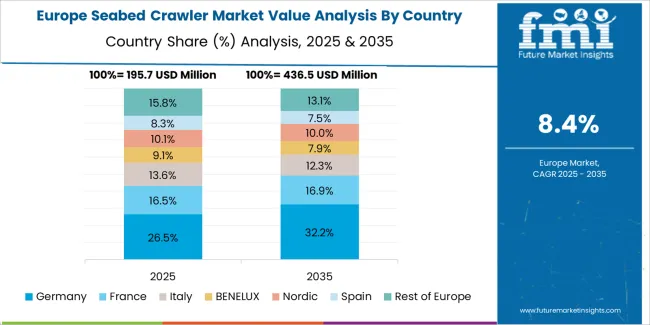
Seabed Crawler Market Europe Country Market Share Analysis, 2025 & 2035

Germany’s market grows at 10.5% CAGR, supported by mature marine-engineering sectors, structured environmental-monitoring requirements, and consistent use of seabed crawlers in offshore-wind and coastal-infrastructure applications. Crawlers are used for seabed-impact assessments, turbine-foundation inspections, erosion-pattern mapping, and sediment-profiling tasks aligned with regulatory guidelines. Engineering consultancies integrate high-resolution sonar, optical-imaging units, and multi-sensor survey packages designed for North Sea and Baltic Sea operating conditions. Research institutions deploy crawlers for benthic-habitat analysis and substrate-characterization programs. Continuous upgrades in offshore-wind infrastructure sustain long-term demand for accurate and durable crawler platforms.

Key Market Characteristics:

  • High adoption in offshore-wind inspection and environmental-assessment programs.
  • Integration of sonar, optical, and sediment-profiling sensor suites.
  • Use across research institutes conducting benthic-habitat mapping.
  • Strong compliance requirements reinforcing precision-engineering solutions.

How is Brazil developing the Seabed Crawler Market?

Brazil’s market grows at 9.6% CAGR, driven by extensive offshore oil-and-gas activity, subsea-pipeline inspection requirements, and sediment-analysis needs across petroleum basins. Marine-engineering contractors adopt crawler systems with reinforced tracks, subsea imaging modules, and sampling tools to operate in deepwater and turbidity-affected conditions. Existing offshore fields require routine integrity assessments, strengthening demand for robust crawlers capable of capturing stable imagery and performing structural-monitoring tasks on risers and pipelines. Coastal-engineering and sediment-stability programs also contribute to annual deployment. Research organizations adopt crawlers for ecological-survey and seabed-structure analysis.

Market Development Factors:
  • High demand in deepwater pipeline inspection and riser-monitoring tasks.
  • Increased use of tracked crawlers in sediment and structural surveys.
  • Growth in offshore-exploration and coastal-engineering operations.
  • Adoption by research institutions conducting environmental seabed studies.

How is the United States progressing in the Seabed Crawler Market?

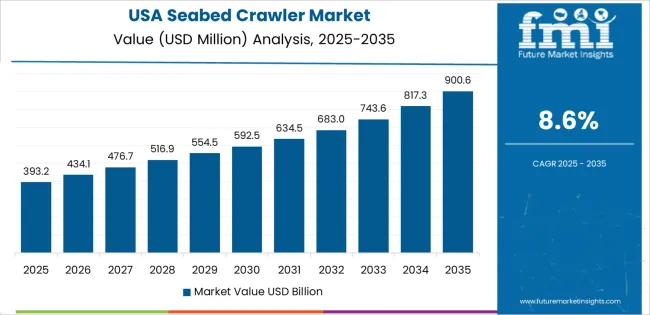
Seabed Crawler Market Country Value Analysis

The United States grows at 8.6% CAGR, supported by established marine-science programs, offshore-energy operations, and strong adoption of underwater-inspection equipment for subsea-infrastructure monitoring. Research centers deploy crawlers for benthic mapping, coastal-erosion studies, and habitat-assessment activities. Offshore-energy operators integrate crawler systems for pipeline inspection, structural-condition surveys, and shallow-water maintenance tasks. Manufacturers supply crawler platforms incorporating sonar arrays, high-definition imaging systems, sediment-profiling modules, and modular tooling attachments. Expanding coastal-resilience and environmental-monitoring programs reinforce demand for scalable seabed-crawler solutions.

Key Market Factors:

  • Broad adoption across marine-science and offshore-inspection operations.
  • High use in pipeline surveys and coastal-erosion assessments.
  • Development of sensor-integrated crawler systems for research and industry.
  • Consistent demand from coastal-management and infrastructure projects.

How is the United Kingdom developing the Seabed Crawler Market?

The United Kingdom’s market grows at 7.7% CAGR, supported by offshore-wind expansion, underwater-cable inspection needs, and strong marine-research capabilities. Seabed crawlers support turbine-foundation assessment, sediment-transport analysis, and ecological-monitoring programs across North Sea environments. Engineering contractors adopt crawler platforms with imaging, sonar, and sampling tools for routine maintenance and seabed-stability evaluation. Academic institutions deploy crawlers for benthic-habitat studies and coastal-impact assessments. Increased offshore-infrastructure installations maintain steady use of crawler-based inspection solutions.

Market Development Factors:
  • High use in offshore-wind foundation and underwater-cable inspection.
  • Increased adoption for sediment-transport and ecological-survey programs.
  • Broad deployment across research institutions and marine-science units.
  • Demand from subsea-engineering contractors supporting routine maintenance.

How is Japan maintaining the Seabed Crawler Market?

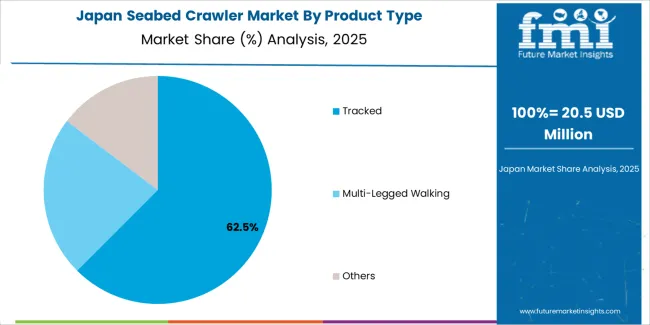
Seabed Crawler Market Japan Market Share Analysis By Product Type

Japan’s market grows at 6.8% CAGR, supported by strong marine-research institutions, seismic-risk assessment needs, and coastal-engineering projects requiring reliable seabed-intervention tools. Research centers use crawlers for benthic-habitat mapping, substrate analysis, underwater imaging, and sediment-stability evaluations in earthquake-prone regions. Engineering firms adopt crawlers for structural-inspection tasks related to coastal infrastructure, harbor development, and offshore-maintenance operations. Domestic manufacturers design compact crawler systems optimized for rocky, sloped, and irregular seabed terrain. Stable investment in ocean-monitoring programs reinforces long-term market activity.

Key Market Characteristics:

  • Strong demand in seismic-risk and coastal-engineering studies.
  • High adoption in benthic-mapping and substrate-characterization tasks.
  • Development of compact crawlers suited to complex seafloor terrain.
  • Consistent procurement across research and offshore-maintenance sectors.

What is the competitive landscape of the Seabed Crawler Market?

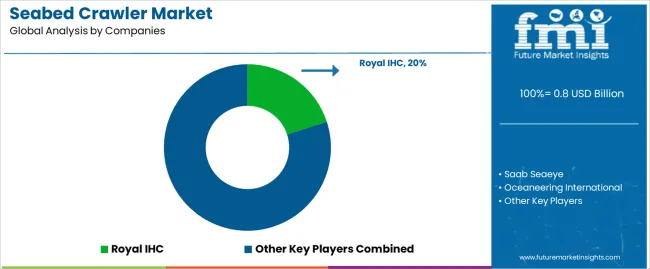
The seabed crawler market is moderately consolidated, with about ten manufacturers supplying tracked subsea vehicles for pipeline inspection, deepwater construction support, mineral surveys, and geotechnical operations. Royal IHC leads the market with an estimated 20.0% global share, supported by its long-standing offshore engineering capability, proven crawler designs, and integration with dredging, trenching, and seabed intervention systems. Its position is reinforced by reliable traction performance, robust subsea hydraulics, and documented operational stability in challenging seabed conditions.

Saab Seaeye, Oceaneering International, and ECA Group follow as major competitors, offering hybrid and electric-powered crawlers configured for inspection, maintenance, and light construction tasks. Their competitive strengths include stable control systems, sensor integration, and compatibility with existing ROV and vessel-based support infrastructure. Fugro and Soil Machine Dynamics maintain strong positions through geotechnical and trenching-focused crawler platforms, supported by detailed survey capability and high-pull subsea tooling.

Large industrial firms such as TechnipFMC, Forum Energy Technologies, Kawasaki Heavy Industries, and Hyundai Heavy Industries contribute to the market through specialized heavy-duty crawlers for pipeline burial, seabed preparation, and subsea construction support. Their competitiveness depends on engineering scale, subsea reliability, and integration with broader offshore installation services.

Competition centers on traction stability, payload capacity, sensor integration accuracy, and endurance under high-pressure conditions. Market growth is driven by offshore renewable energy expansion, greater demand for deep-sea survey capability, and continued investment in seabed intervention equipment across oil, gas, and infrastructure sectors.
Key Players in the Seabed Crawler Market

Seabed Crawler Market Analysis By Company

  • Royal IHC
  • Saab Seaeye
  • Oceaneering International
  • ECA Group
  • Fugro
  • Soil Machine Dynamics
  • TechnipFMC
  • Forum Energy Technologies
  • Kawasaki Heavy Industries
  • Hyundai Heavy Industries

Scope of the Report

Items Values
Quantitative Units USD billion
Product Type Tracked, Multi-Legged Walking, Others
Application Offshore Oil and Gas Industry, Ocean Science and Research, Submarine Communications and Power, Others
Regions Covered Asia Pacific, Europe, North America, Latin America, Middle East & Africa
Countries Covered India, China, USA, Germany, South Korea, Japan, Italy, and 40+ countries
Key Companies Profiled Royal IHC, Saab Seaeye, Oceaneering International, ECA Group, Fugro, Soil Machine Dynamics, TechnipFMC, Forum Energy Technologies, Kawasaki Heavy Industries, Hyundai Heavy Industries
Additional Attributes Dollar sales by product type and application categories; regional adoption trends across Asia Pacific, Europe, and North America; competitive landscape of subsea robotics and seabed intervention system manufacturers; advancements in deep-sea mobility, autonomous operation, and high-pressure durability; integration with offshore energy operations, marine research missions, and subsea cable installation and maintenance.

Seabed Crawler Market by Segment

Product Type:

  • Tracked
  • Multi-Legged Walking
  • Others

Application:

  • Offshore Oil and Gas Industry
  • Ocean Science and Research
  • Submarine Communications and Power
  • Others

Region:

  • Asia Pacific
    • China
    • Japan
    • South Korea
    • India
    • Australia & New Zealand
    • ASEAN
    • Rest of Asia Pacific
  • Europe
    • Germany
    • United Kingdom
    • France
    • Italy
    • Spain
    • Nordic
    • BENELUX
    • Rest of Europe
  • North America
    • United States
    • Canada
    • Mexico
  • Latin America
    • Brazil
    • Chile
    • Rest of Latin America
  • Middle East & Africa
    • Kingdom of Saudi Arabia
    • Other GCC Countries
    • Turkey
    • South Africa
    • Other African Union
    • Rest of Middle East & Africa

Frequently Asked Questions

How big is the seabed crawler market in 2025?

The global seabed crawler market is estimated to be valued at USD 0.8 billion in 2025.

What will be the size of seabed crawler market in 2035?

The market size for the seabed crawler market is projected to reach USD 1.9 billion by 2035.

How much will be the seabed crawler market growth between 2025 and 2035?

The seabed crawler market is expected to grow at a 9.1% CAGR between 2025 and 2035.

What are the key product types in the seabed crawler market?

The key product types in seabed crawler market are tracked, multi-legged walking and others.

Which application segment to contribute significant share in the seabed crawler market in 2025?

In terms of application, offshore oil and gas industry segment to command 48.0% share in the seabed crawler market in 2025.

Table of Content

  1. Executive Summary
    • Global Market Outlook
    • Demand to side Trends
    • Supply to side Trends
    • Technology Roadmap Analysis
    • Analysis and Recommendations
  2. Market Overview
    • Market Coverage / Taxonomy
    • Market Definition / Scope / Limitations
  3. Market Background
    • Market Dynamics
      • Drivers
      • Restraints
      • Opportunity
      • Trends
    • Scenario Forecast
      • Demand in Optimistic Scenario
      • Demand in Likely Scenario
      • Demand in Conservative Scenario
    • Opportunity Map Analysis
    • Product Life Cycle Analysis
    • Supply Chain Analysis
    • Investment Feasibility Matrix
    • Value Chain Analysis
    • PESTLE and Porter’s Analysis
    • Regulatory Landscape
    • Regional Parent Market Outlook
    • Production and Consumption Statistics
    • Import and Export Statistics
  4. Global Market Analysis 2020 to 2024 and Forecast, 2025 to 2035
    • Historical Market Size Value (USD Million) Analysis, 2020 to 2024
    • Current and Future Market Size Value (USD Million) Projections, 2025 to 2035
      • Y to o to Y Growth Trend Analysis
      • Absolute $ Opportunity Analysis
  5. Global Market Pricing Analysis 2020 to 2024 and Forecast 2025 to 2035
  6. Global Market Analysis 2020 to 2024 and Forecast 2025 to 2035, By Product Type
    • Introduction / Key Findings
    • Historical Market Size Value (USD Million) Analysis By Product Type , 2020 to 2024
    • Current and Future Market Size Value (USD Million) Analysis and Forecast By Product Type , 2025 to 2035
      • Tracked
      • Multi-Legged Walking
      • Others
    • Y to o to Y Growth Trend Analysis By Product Type , 2020 to 2024
    • Absolute $ Opportunity Analysis By Product Type , 2025 to 2035
  7. Global Market Analysis 2020 to 2024 and Forecast 2025 to 2035, By Application
    • Introduction / Key Findings
    • Historical Market Size Value (USD Million) Analysis By Application, 2020 to 2024
    • Current and Future Market Size Value (USD Million) Analysis and Forecast By Application, 2025 to 2035
      • Offshore Oil and Gas Industry
      • Ocean Science and Research
      • Submarine Communications and Power
      • Others
    • Y to o to Y Growth Trend Analysis By Application, 2020 to 2024
    • Absolute $ Opportunity Analysis By Application, 2025 to 2035
  8. Global Market Analysis 2020 to 2024 and Forecast 2025 to 2035, By Region
    • Introduction
    • Historical Market Size Value (USD Million) Analysis By Region, 2020 to 2024
    • Current Market Size Value (USD Million) Analysis and Forecast By Region, 2025 to 2035
      • North America
      • Latin America
      • Western Europe
      • Eastern Europe
      • East Asia
      • South Asia and Pacific
      • Middle East & Africa
    • Market Attractiveness Analysis By Region
  9. North America Market Analysis 2020 to 2024 and Forecast 2025 to 2035, By Country
    • Historical Market Size Value (USD Million) Trend Analysis By Market Taxonomy, 2020 to 2024
    • Market Size Value (USD Million) Forecast By Market Taxonomy, 2025 to 2035
      • By Country
        • USA
        • Canada
        • Mexico
      • By Product Type
      • By Application
    • Market Attractiveness Analysis
      • By Country
      • By Product Type
      • By Application
    • Key Takeaways
  10. Latin America Market Analysis 2020 to 2024 and Forecast 2025 to 2035, By Country
    • Historical Market Size Value (USD Million) Trend Analysis By Market Taxonomy, 2020 to 2024
    • Market Size Value (USD Million) Forecast By Market Taxonomy, 2025 to 2035
      • By Country
        • Brazil
        • Chile
        • Rest of Latin America
      • By Product Type
      • By Application
    • Market Attractiveness Analysis
      • By Country
      • By Product Type
      • By Application
    • Key Takeaways
  11. Western Europe Market Analysis 2020 to 2024 and Forecast 2025 to 2035, By Country
    • Historical Market Size Value (USD Million) Trend Analysis By Market Taxonomy, 2020 to 2024
    • Market Size Value (USD Million) Forecast By Market Taxonomy, 2025 to 2035
      • By Country
        • Germany
        • UK
        • Italy
        • Spain
        • France
        • Nordic
        • BENELUX
        • Rest of Western Europe
      • By Product Type
      • By Application
    • Market Attractiveness Analysis
      • By Country
      • By Product Type
      • By Application
    • Key Takeaways
  12. Eastern Europe Market Analysis 2020 to 2024 and Forecast 2025 to 2035, By Country
    • Historical Market Size Value (USD Million) Trend Analysis By Market Taxonomy, 2020 to 2024
    • Market Size Value (USD Million) Forecast By Market Taxonomy, 2025 to 2035
      • By Country
        • Russia
        • Poland
        • Hungary
        • Balkan & Baltic
        • Rest of Eastern Europe
      • By Product Type
      • By Application
    • Market Attractiveness Analysis
      • By Country
      • By Product Type
      • By Application
    • Key Takeaways
  13. East Asia Market Analysis 2020 to 2024 and Forecast 2025 to 2035, By Country
    • Historical Market Size Value (USD Million) Trend Analysis By Market Taxonomy, 2020 to 2024
    • Market Size Value (USD Million) Forecast By Market Taxonomy, 2025 to 2035
      • By Country
        • China
        • Japan
        • South Korea
      • By Product Type
      • By Application
    • Market Attractiveness Analysis
      • By Country
      • By Product Type
      • By Application
    • Key Takeaways
  14. South Asia and Pacific Market Analysis 2020 to 2024 and Forecast 2025 to 2035, By Country
    • Historical Market Size Value (USD Million) Trend Analysis By Market Taxonomy, 2020 to 2024
    • Market Size Value (USD Million) Forecast By Market Taxonomy, 2025 to 2035
      • By Country
        • India
        • ASEAN
        • Australia & New Zealand
        • Rest of South Asia and Pacific
      • By Product Type
      • By Application
    • Market Attractiveness Analysis
      • By Country
      • By Product Type
      • By Application
    • Key Takeaways
  15. Middle East & Africa Market Analysis 2020 to 2024 and Forecast 2025 to 2035, By Country
    • Historical Market Size Value (USD Million) Trend Analysis By Market Taxonomy, 2020 to 2024
    • Market Size Value (USD Million) Forecast By Market Taxonomy, 2025 to 2035
      • By Country
        • Kingdom of Saudi Arabia
        • Other GCC Countries
        • Turkiye
        • South Africa
        • Other African Union
        • Rest of Middle East & Africa
      • By Product Type
      • By Application
    • Market Attractiveness Analysis
      • By Country
      • By Product Type
      • By Application
    • Key Takeaways
  16. Key Countries Market Analysis
    • USA
      • Pricing Analysis
      • Market Share Analysis, 2024
        • By Product Type
        • By Application
    • Canada
      • Pricing Analysis
      • Market Share Analysis, 2024
        • By Product Type
        • By Application
    • Mexico
      • Pricing Analysis
      • Market Share Analysis, 2024
        • By Product Type
        • By Application
    • Brazil
      • Pricing Analysis
      • Market Share Analysis, 2024
        • By Product Type
        • By Application
    • Chile
      • Pricing Analysis
      • Market Share Analysis, 2024
        • By Product Type
        • By Application
    • Germany
      • Pricing Analysis
      • Market Share Analysis, 2024
        • By Product Type
        • By Application
    • UK
      • Pricing Analysis
      • Market Share Analysis, 2024
        • By Product Type
        • By Application
    • Italy
      • Pricing Analysis
      • Market Share Analysis, 2024
        • By Product Type
        • By Application
    • Spain
      • Pricing Analysis
      • Market Share Analysis, 2024
        • By Product Type
        • By Application
    • France
      • Pricing Analysis
      • Market Share Analysis, 2024
        • By Product Type
        • By Application
    • India
      • Pricing Analysis
      • Market Share Analysis, 2024
        • By Product Type
        • By Application
    • ASEAN
      • Pricing Analysis
      • Market Share Analysis, 2024
        • By Product Type
        • By Application
    • Australia & New Zealand
      • Pricing Analysis
      • Market Share Analysis, 2024
        • By Product Type
        • By Application
    • China
      • Pricing Analysis
      • Market Share Analysis, 2024
        • By Product Type
        • By Application
    • Japan
      • Pricing Analysis
      • Market Share Analysis, 2024
        • By Product Type
        • By Application
    • South Korea
      • Pricing Analysis
      • Market Share Analysis, 2024
        • By Product Type
        • By Application
    • Russia
      • Pricing Analysis
      • Market Share Analysis, 2024
        • By Product Type
        • By Application
    • Poland
      • Pricing Analysis
      • Market Share Analysis, 2024
        • By Product Type
        • By Application
    • Hungary
      • Pricing Analysis
      • Market Share Analysis, 2024
        • By Product Type
        • By Application
    • Kingdom of Saudi Arabia
      • Pricing Analysis
      • Market Share Analysis, 2024
        • By Product Type
        • By Application
    • Turkiye
      • Pricing Analysis
      • Market Share Analysis, 2024
        • By Product Type
        • By Application
    • South Africa
      • Pricing Analysis
      • Market Share Analysis, 2024
        • By Product Type
        • By Application
  17. Market Structure Analysis
    • Competition Dashboard
    • Competition Benchmarking
    • Market Share Analysis of Top Players
      • By Regional
      • By Product Type
      • By Application
  18. Competition Analysis
    • Competition Deep Dive
      • Royal IHC
        • Overview
        • Product Portfolio
        • Profitability by Market Segments (Product/Age /Sales Channel/Region)
        • Sales Footprint
        • Strategy Overview
          • Marketing Strategy
          • Product Strategy
          • Channel Strategy
      • Saab Seaeye
      • Oceaneering International
      • ECA Group
      • Fugro
      • Soil Machine Dynamics
      • TechnipFMC
      • Forum Energy Technologies
      • Kawasaki Heavy Industries
      • Hyundai Heavy Industries
  19. Assumptions & Acronyms Used
  20. Research Methodology

List of Tables

  • Table 1: Global Market Value (USD Million) Forecast by Region, 2020 to 2035
  • Table 2: Global Market Value (USD Million) Forecast by Product Type , 2020 to 2035
  • Table 3: Global Market Value (USD Million) Forecast by Application, 2020 to 2035
  • Table 4: North America Market Value (USD Million) Forecast by Country, 2020 to 2035
  • Table 5: North America Market Value (USD Million) Forecast by Product Type , 2020 to 2035
  • Table 6: North America Market Value (USD Million) Forecast by Application, 2020 to 2035
  • Table 7: Latin America Market Value (USD Million) Forecast by Country, 2020 to 2035
  • Table 8: Latin America Market Value (USD Million) Forecast by Product Type , 2020 to 2035
  • Table 9: Latin America Market Value (USD Million) Forecast by Application, 2020 to 2035
  • Table 10: Western Europe Market Value (USD Million) Forecast by Country, 2020 to 2035
  • Table 11: Western Europe Market Value (USD Million) Forecast by Product Type , 2020 to 2035
  • Table 12: Western Europe Market Value (USD Million) Forecast by Application, 2020 to 2035
  • Table 13: Eastern Europe Market Value (USD Million) Forecast by Country, 2020 to 2035
  • Table 14: Eastern Europe Market Value (USD Million) Forecast by Product Type , 2020 to 2035
  • Table 15: Eastern Europe Market Value (USD Million) Forecast by Application, 2020 to 2035
  • Table 16: East Asia Market Value (USD Million) Forecast by Country, 2020 to 2035
  • Table 17: East Asia Market Value (USD Million) Forecast by Product Type , 2020 to 2035
  • Table 18: East Asia Market Value (USD Million) Forecast by Application, 2020 to 2035
  • Table 19: South Asia and Pacific Market Value (USD Million) Forecast by Country, 2020 to 2035
  • Table 20: South Asia and Pacific Market Value (USD Million) Forecast by Product Type , 2020 to 2035
  • Table 21: South Asia and Pacific Market Value (USD Million) Forecast by Application, 2020 to 2035
  • Table 22: Middle East & Africa Market Value (USD Million) Forecast by Country, 2020 to 2035
  • Table 23: Middle East & Africa Market Value (USD Million) Forecast by Product Type , 2020 to 2035
  • Table 24: Middle East & Africa Market Value (USD Million) Forecast by Application, 2020 to 2035

List of Figures

  • Figure 1: Global Market Pricing Analysis
  • Figure 2: Global Market Value (USD Million) Forecast 2020-2035
  • Figure 3: Global Market Value Share and BPS Analysis by Product Type , 2025 and 2035
  • Figure 4: Global Market Y-o-Y Growth Comparison by Product Type , 2025-2035
  • Figure 5: Global Market Attractiveness Analysis by Product Type
  • Figure 6: Global Market Value Share and BPS Analysis by Application, 2025 and 2035
  • Figure 7: Global Market Y-o-Y Growth Comparison by Application, 2025-2035
  • Figure 8: Global Market Attractiveness Analysis by Application
  • Figure 9: Global Market Value (USD Million) Share and BPS Analysis by Region, 2025 and 2035
  • Figure 10: Global Market Y-o-Y Growth Comparison by Region, 2025-2035
  • Figure 11: Global Market Attractiveness Analysis by Region
  • Figure 12: North America Market Incremental Dollar Opportunity, 2025-2035
  • Figure 13: Latin America Market Incremental Dollar Opportunity, 2025-2035
  • Figure 14: Western Europe Market Incremental Dollar Opportunity, 2025-2035
  • Figure 15: Eastern Europe Market Incremental Dollar Opportunity, 2025-2035
  • Figure 16: East Asia Market Incremental Dollar Opportunity, 2025-2035
  • Figure 17: South Asia and Pacific Market Incremental Dollar Opportunity, 2025-2035
  • Figure 18: Middle East & Africa Market Incremental Dollar Opportunity, 2025-2035
  • Figure 19: North America Market Value Share and BPS Analysis by Country, 2025 and 2035
  • Figure 20: North America Market Value Share and BPS Analysis by Product Type , 2025 and 2035
  • Figure 21: North America Market Y-o-Y Growth Comparison by Product Type , 2025-2035
  • Figure 22: North America Market Attractiveness Analysis by Product Type
  • Figure 23: North America Market Value Share and BPS Analysis by Application, 2025 and 2035
  • Figure 24: North America Market Y-o-Y Growth Comparison by Application, 2025-2035
  • Figure 25: North America Market Attractiveness Analysis by Application
  • Figure 26: Latin America Market Value Share and BPS Analysis by Country, 2025 and 2035
  • Figure 27: Latin America Market Value Share and BPS Analysis by Product Type , 2025 and 2035
  • Figure 28: Latin America Market Y-o-Y Growth Comparison by Product Type , 2025-2035
  • Figure 29: Latin America Market Attractiveness Analysis by Product Type
  • Figure 30: Latin America Market Value Share and BPS Analysis by Application, 2025 and 2035
  • Figure 31: Latin America Market Y-o-Y Growth Comparison by Application, 2025-2035
  • Figure 32: Latin America Market Attractiveness Analysis by Application
  • Figure 33: Western Europe Market Value Share and BPS Analysis by Country, 2025 and 2035
  • Figure 34: Western Europe Market Value Share and BPS Analysis by Product Type , 2025 and 2035
  • Figure 35: Western Europe Market Y-o-Y Growth Comparison by Product Type , 2025-2035
  • Figure 36: Western Europe Market Attractiveness Analysis by Product Type
  • Figure 37: Western Europe Market Value Share and BPS Analysis by Application, 2025 and 2035
  • Figure 38: Western Europe Market Y-o-Y Growth Comparison by Application, 2025-2035
  • Figure 39: Western Europe Market Attractiveness Analysis by Application
  • Figure 40: Eastern Europe Market Value Share and BPS Analysis by Country, 2025 and 2035
  • Figure 41: Eastern Europe Market Value Share and BPS Analysis by Product Type , 2025 and 2035
  • Figure 42: Eastern Europe Market Y-o-Y Growth Comparison by Product Type , 2025-2035
  • Figure 43: Eastern Europe Market Attractiveness Analysis by Product Type
  • Figure 44: Eastern Europe Market Value Share and BPS Analysis by Application, 2025 and 2035
  • Figure 45: Eastern Europe Market Y-o-Y Growth Comparison by Application, 2025-2035
  • Figure 46: Eastern Europe Market Attractiveness Analysis by Application
  • Figure 47: East Asia Market Value Share and BPS Analysis by Country, 2025 and 2035
  • Figure 48: East Asia Market Value Share and BPS Analysis by Product Type , 2025 and 2035
  • Figure 49: East Asia Market Y-o-Y Growth Comparison by Product Type , 2025-2035
  • Figure 50: East Asia Market Attractiveness Analysis by Product Type
  • Figure 51: East Asia Market Value Share and BPS Analysis by Application, 2025 and 2035
  • Figure 52: East Asia Market Y-o-Y Growth Comparison by Application, 2025-2035
  • Figure 53: East Asia Market Attractiveness Analysis by Application
  • Figure 54: South Asia and Pacific Market Value Share and BPS Analysis by Country, 2025 and 2035
  • Figure 55: South Asia and Pacific Market Value Share and BPS Analysis by Product Type , 2025 and 2035
  • Figure 56: South Asia and Pacific Market Y-o-Y Growth Comparison by Product Type , 2025-2035
  • Figure 57: South Asia and Pacific Market Attractiveness Analysis by Product Type
  • Figure 58: South Asia and Pacific Market Value Share and BPS Analysis by Application, 2025 and 2035
  • Figure 59: South Asia and Pacific Market Y-o-Y Growth Comparison by Application, 2025-2035
  • Figure 60: South Asia and Pacific Market Attractiveness Analysis by Application
  • Figure 61: Middle East & Africa Market Value Share and BPS Analysis by Country, 2025 and 2035
  • Figure 62: Middle East & Africa Market Value Share and BPS Analysis by Product Type , 2025 and 2035
  • Figure 63: Middle East & Africa Market Y-o-Y Growth Comparison by Product Type , 2025-2035
  • Figure 64: Middle East & Africa Market Attractiveness Analysis by Product Type
  • Figure 65: Middle East & Africa Market Value Share and BPS Analysis by Application, 2025 and 2035
  • Figure 66: Middle East & Africa Market Y-o-Y Growth Comparison by Application, 2025-2035
  • Figure 67: Middle East & Africa Market Attractiveness Analysis by Application
  • Figure 68: Global Market - Tier Structure Analysis
  • Figure 69: Global Market - Company Share Analysis
Dashboard
Dashboard
Dashboard
Dashboard
Dashboard
Dashboard

Our Research Products

Full Research Suite

The "Full Research Suite" delivers actionable market intel, deep dives on markets or technologies, so clients act faster, cut risk, and unlock growth.

Competitor Leaderboard Report

The Leaderboard benchmarks and ranks top vendors, classifying them as Established Leaders, Leading Challengers, or Disruptors & Challengers.

Future Leaders Index

Locates where complements amplify value and substitutes erode it, forecasting net impact by horizon

Market Data & Forecasts

We deliver granular, decision-grade intel: market sizing, 5-year forecasts, pricing, adoption, usage, revenue, and operational KPIs—plus competitor tracking, regulation, and value chains—across 60 countries broadly.

Market Focus Report

Spot the shifts before they hit your P&L. We track inflection points, adoption curves, pricing moves, and ecosystem plays to show where demand is heading, why it is changing, and what to do next across high-growth markets and disruptive tech

Survey Report

Real-time reads of user behavior. We track shifting priorities, perceptions of today’s and next-gen services, and provider experience, then pace how fast tech moves from trial to adoption, blending buyer, consumer, and channel inputs with social signals (#WhySwitch, #UX).

Bespoke Reports

Partner with our analyst team to build a custom report designed around your business priorities. From analysing market trends to assessing competitors or crafting bespoke datasets, we tailor insights to your needs.

Supplier Intelligence

Discovery & Profiling

Capacity & Footprint

Performance & Risk

Compliance & Governance

Commercial Readiness

Who Supplies Whom

Scorecards & Shortlists

Playbooks & Docs

Category Intelligence

Definition & Scope

Demand & Use Cases

Cost Drivers

Market Structure

Supply Chain Map

Trade & Policy

Operating Norms

Deliverables

Buyer Intelligence

Account Basics

Spend & Scope

Procurement Model

Vendor Requirements

Terms & Policies

Entry Strategy

Pain Points & Triggers

Outputs

Pricing Analysis

Benchmarks

Trends

Should-Cost

Indexation

Landed Cost

Commercial Terms

Deliverables

Brand Analysis

Positioning & Value Prop

Share & Presence

Customer Evidence

Go-to-Market

Digital & Reputation

Compliance & Trust

KPIs & Gaps

Outputs

Full Research Suite comprises of:

Market outlook & trends analysis

Market outlook & trends analysis

Interviews & case studies

Interviews & case studies

Strategic recommendations

Strategic recommendations

Vendor profiles & capabilities analysis

Vendor profiles & capabilities analysis

5-year forecasts

5-year forecasts

8 regions and 60+ country-level data splits

8 regions and 60+ country-level data splits

Market segment data splits

Market segment data splits

12 months of continuous data updates

12 months of continuous data updates

DELIVERED AS:

PDF EXCEL ONLINE

Full Research Suite


$5000

$7500

$10000

Buy Report Now
Similar Industry Reports

Similar Industry Reports

Crawler Excavator Market

Crawler Excavator Market Growth - Trends & Forecast 2025 to 2035

Crawler Drilling Machine Market

Crawler Drilling Machine Market

Electric Crawler Crane Market

Electric Crawler Crane Market Size and Share Forecast Outlook 2025 to 2035

Future Market Insights

Seabed Crawler Market

Chat With MaRIA

Chat With

MaRIA

Hi There, I am MaRIA, Your Market Research Intelligence Assistant. How may I help you?