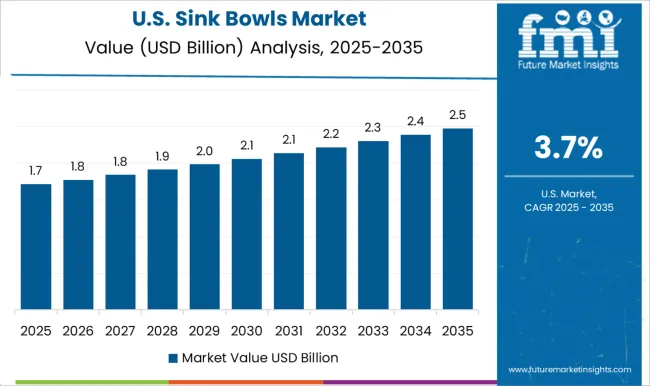
Sink Bowls Market
An Analysis of the Sink Bowls Market by Stainless Steel, Composite and Glass Type Bowls
The Sink Bowls Ecosystem welcomes New Entrants offering High-Quality Product Offerings. Peruse FMI's report for further details
Sink Bowls Market Snapshot (2023 to 2033)
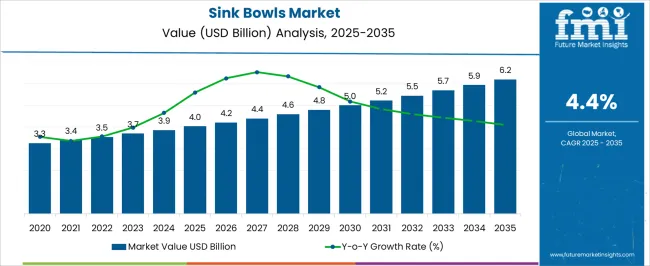
The global sink bowls market is expected to be valued at US$ 3.7 billion in 2023. Growing real estate and construction activities bolsters the overall scope for the sink bowls market, which is projected to grow at a CAGR of 4.4% between 2023 and 2033, totaling around US$ 5.7 billion by 2033.
Data Points | Key Statistics |
---|---|
Sink Bowls Market Value 2023 |
US$ 3.7 billion |
Sink Bowls Market Projected Value (2033) |
US$ 5.7 billion |
Sink Bowls Market CAGR (2023 to 2033) |
4.4% |
According to the analysis of Future Market Insights, sink bowls with antimicrobial surfaces have gained traction as they help inhibit the growth of microorganisms, including bacteria, viruses, and fungi. The surfaces are often coated with materials or treated with antimicrobial agents that actively prevent the proliferation of harmful pathogens. The antimicrobial properties contribute to maintaining a cleaner and more hygienic sink environment, reducing the risk of cross-contamination.
Consumers are increasingly opting for sink bowls made from materials that are easy to clean and maintain. Smooth and non-porous materials, such as stainless steel, quartz, or solid surface materials, discourage the accumulation of dirt, grime, and bacteria. Easy-to-clean sink bowls minimize the effort required for regular maintenance, ensuring a hygienic environment with reduced chances of bacterial growth.
The demand for touchless or hands-free sink solutions has surged during the pandemic. Touchless faucets and soap dispensers eliminate the need for direct contact, minimizing the potential transmission of pathogens. The sensor-activated systems detect the presence of hands or objects and automatically dispense water or soap, promoting better hygiene practices and reducing the risk of contamination from shared surfaces.
Sink bowls that incorporate additional hygiene features have gained popularity. Some sink bowls, for instance, come with built-in UV-C light systems that can disinfect the bowl's surface or water, helping to eliminate harmful bacteria and viruses. Others may include integrated hand sanitizers or hand drying mechanisms, providing a comprehensive hygiene solution within the sink area.
Don't pay for what you don't need
Customize your report by selecting specific countries or regions and save 30%!
Sink Bowls Demand Analysis (2018 to 2022) Vs Market Outlook (2023 to 2033)
The global demand for sink bowls is projected to increase at a CAGR of 2.3% during the forecast period between 2018 and 2022, reaching a total of US$ 5.7 billion in 2033.
According to Future Market Insights, a market research and competitive intelligence provider, the sink bowls market was valued at US$ 3.5 billion in 2022.
The growing adoption of smart sink bowls is driven by the increasing integration of smart home technology into residential spaces, which in turn is anticipated to boost the growth of the sink bowls market during the forecast period.
Smart sink bowls provide convenient and time-saving features that simplify daily tasks. Touchless faucets eliminate the need for manual operation, allowing users to start and stop the water flow with a simple gesture. Automated water temperature control ensures consistent and comfortable water temperatures, eliminating the need for manual adjustments. The features enhance user convenience and efficiency in the kitchen or bathroom, making tasks like handwashing, dishwashing, or food preparation more seamless and enjoyable.
The smart sink bowls promote enhanced hygiene and sanitation practices. Touchless operation minimizes the need for direct contact with the faucet, reducing the potential transmission of germs and bacteria. Integrated soap dispensers in smart sink bowls provide measured amounts of soap, ensuring proper hand hygiene. Some smart sink bowls also incorporate UV-C or other disinfection technologies to sterilize the sink surfaces, further enhancing cleanliness and reducing the risk of contamination.
Smart sink bowls often come equipped with water-saving features that contribute to sustainable water usage. The features include flow sensors that detect the presence of hands or objects and adjust the water flow accordingly, as well as timers that automatically shut off the water after a designated period of time. Smart sink bowls help conserve water resources and promote eco-friendly practices, by optimizing water usage and reducing wastage.
Which Drivers Underpin Sink Bowls Industry Expansion?
Increasing Demand for Stylish and Functional Sink Solutions to Fuel the Market Growth
The continually rising demand for stylish and functional sink solutions is driven by consumers' desire to elevate the aesthetic appeal of their kitchen and bathroom spaces. Sink bowls have evolved from being solely utilitarian elements to becoming important design features within these spaces.
Consumers are seeking sink bowls that seamlessly integrate with the overall design and style of their kitchens or bathrooms, and prefer sink bowls that complement the existing décor, whether it's a contemporary, traditional, or transitional design theme. The focus is on creating a cohesive and visually appealing space where the sink bowl serves as a design centerpiece.
There is a growing demand for sink bowls with unique shapes and sizes that deviate from traditional rectangular or circular designs. Irregular geometric shapes, asymmetrical designs, and custom sizes allow consumers to add a touch of individuality and uniqueness to their spaces. The distinctive sink bowl designs become conversation starters and create visually interesting focal points.
Sustainability and Eco-Friendly Materials to Accelerate the Market Growth
The growing emphasis on sustainability and eco-friendliness in the construction and home improvement industry has influenced consumer preferences toward eco-friendly sink bowls. The trend reflects a broader shift towards environmentally conscious choices and a desire to reduce the ecological footprint associated with everyday products.
Consumers are actively seeking sink bowls made from sustainable and eco-friendly materials. Materials like recycled glass, bamboo, and stainless steel are gaining popularity due to their renewable or recycled nature. Recycled glass sink bowls repurpose discarded glass, reducing waste and conserving resources. Bamboo, a fast-growing and renewable material, offers a sustainable alternative to traditional wood-based sink bowls. Stainless steel, a highly recyclable material, is known for its durability and longevity, reducing the need for frequent replacements.
Eco-friendly sink bowls are designed to have a minimal environmental impact throughout their lifecycle. Sustainable materials minimize the extraction of raw resources and reduce energy consumption during production. Eco-friendly manufacturing processes strive to minimize waste generation, water usage, and harmful emissions. Consumers, by choosing environmentally conscious options, can contribute to reducing their carbon footprint and preserving natural resources.
Which Factors are limiting the Growth of Sink Bowls Market?
Limited Consumer Awareness Regarding Sink Bowls to Restrain the Market Growth
Limited consumer awareness is a significant factor that is expected to restrain the growth of the sink bowls market over the analysis period. Traditional sink designs, such as stainless steel or porcelain sinks, have been widely used and familiar to consumers for many years. Consumers tend to have a higher level of awareness and familiarity with these conventional options. They, as a result, may not actively seek information or explore alternative options like sink bowls, especially if they are not aware of the benefits or unique features they provide.
The sink bowls market may not have received as much marketing and promotional attention as other household products. Manufacturers and retailers may focus their marketing efforts on more mainstream products, leaving sink bowls with limited exposure to the wider consumer audience. Insufficient marketing activities can contribute to a lack of consumer awareness about the range of options and features available in the sink bowls market.
Sink bowls often require physical presence or visual demonstration to effectively showcase their design, materials, and features. The availability and prominence of sink bowl displays in retail stores or showrooms may be limited compared to traditional sink options. Consumers may not have the opportunity to see and experience sink bowls firsthand, which can hinder their awareness and understanding of the product.
Region-wise Insights
Will North America Continue Dominance in the Global Sink Bowls Market?
Increasing Focus on Aesthetics in Kitchen in North America to Fuel the Market Growth
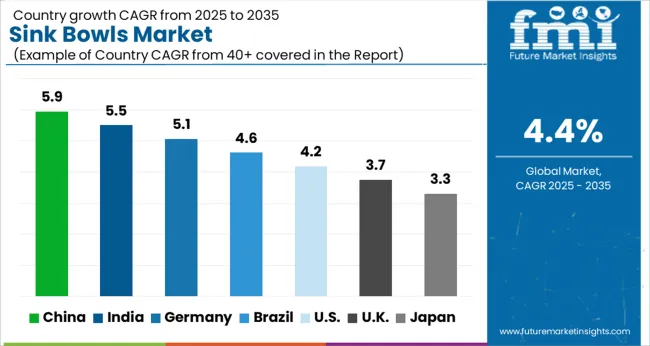
The sink bowls market in North America is expected to accumulate a prominent CAGR of 4.3% in 2023.
The regional market growth is attributed to the factors such as renovation and remodeling activities. Renovation and remodeling projects in residential and commercial sectors drive the demand for sink bowls. North America has a robust construction industry, with a significant number of renovation and remodeling activities taking place. The homeowners and businesses often consider replacing conventional sinks with modern and aesthetically appealing sink bowls, as they seek to upgrade their spaces.
The United States, for instance, experiences a high level of renovation and remodeling activities across various industries, including residential, hospitality, and commercial sectors. This contributes to increased demand for sink bowls as part of the upgrade process.
The increasing focus on interior design aesthetics in kitchens and bathrooms has led to a greater demand for visually appealing sink bowls. Consumers are seeking unique and stylish sink bowl designs that complement their overall decor. The factor drives the growth of the regional market as sink bowls have transitioned from purely functional elements to design features.
Canadian consumers, for instance, place importance on design aesthetics in their homes. The demand for stylish sink bowls that align with the overall interior decor has been growing, contributing to market expansion.
North America has witnessed a growing emphasis on sustainability and eco-friendliness in the construction and home improvement sectors. Consumers are increasingly seeking sink bowls made from environmentally friendly materials, such as recycled glass or bamboo, that have minimal environmental impact, which in turn is projected to augment the market growth.
How Will Growth of the Sink Bowls Market unfold in Asia Pacific?
Rapi Urbanization and Infrastructure Development in the Region to Fuel the Market Growth
The sink bowls market in Asia Pacific is expected to accumulate the highest CAGR of 4.2% in 2023.
The Asia Pacific Sink Bowls market is expected to witness significant growth attributed to rapid urbanization and infrastructure development. The region is experiencing rapid urbanization, along with significant infrastructure development in residential, commercial, and hospitality sectors. The demand for sink bowls as part of kitchen and bathroom installations increases, as new buildings are constructed and existing infrastructure is upgraded.
India, for instance, has been witnessing rapid urbanization and infrastructure growth, particularly in its major cities. The demand for sink bowls in residential and commercial projects rises, as the country experiences increased construction activity.
There is a noticeable shift in consumer preferences towards modern and contemporary kitchen and bathroom designs in the region. Consumers are increasingly moving away from traditional sink options and opting for sink bowls that offer unique shapes, colors, and materials.
Japan, for instance, with its penchant for minimalistic and functional design, has seen increased adoption of modern sink bowls. Japanese consumers appreciate the blend of functionality and aesthetics offered by sink bowls.
The thriving hospitality and tourism industry in the region, escalates the demand for high-quality and visually appealing sink bowls in hotels, resorts, and other accommodation facilities.
Thailand, for instance, is a popular tourist destination, attracting a significant number of visitors each year. The growth of the hospitality industry in the country creates a demand for sink bowls in hotels and resorts, as they aim to provide stylish and comfortable amenities to their guests.
Get the data you need at a Fraction of the cost
Personalize your report by choosing insights you need
and save 40%!
Category-wise Insights
By Material, which Sink Bowls Category will remain prominent?
Composite Material Segment to beat Competition in Untiring Market
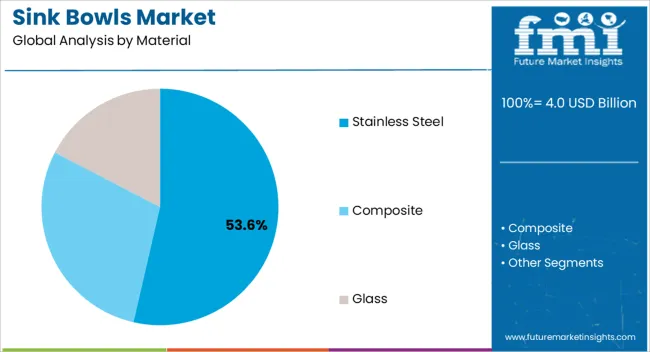
On the basis of material, the market is dominated by composite segment, which is expected to hold a CAGR of 4.3% over the analysis period.
Composite sink bowls are known for their durability and resistance to scratches, stains, and heat, which makes them a popular choice for busy kitchens or high-traffic areas where the sink is subjected to heavy use.
Composite sink bowls offer a wide range of colors, patterns, and textures, allowing homeowners to find a design that complements their kitchen or bathroom decor. The versatility of composite materials enables the creation of unique and visually appealing sink bowl options.
The sink bowls are generally easy to clean and maintain. They are non-porous, which helps prevent the absorption of stains and odors. Their smooth surfaces make it easier to wipe away dirt and grime, requiring minimal effort for upkeep.
The bowls are often resistant to chemicals commonly found in household cleaning products. The resistance ensures that the sink bowl's appearance and performance are not compromised when using standard cleaning solutions.
By Application, which Sink Bowls Category to dominate?
Kitchen Sinks Segment to Drive the Sink Bowls Market
Based on the application, the kitchen sinks segment is expected to expand at rapid rate of 4.2% CAGR over the analysis period.
The segmental growth can be attributed to the increasing Focus on kitchen renovations. There is a higher demand for stylish and functional kitchen sinks, with the growing trend of kitchen renovations and remodeling. Homeowners are looking for sink bowls that not only provide utility but also enhance the overall aesthetics of their kitchen.
The shift towards healthier eating and increased home cooking has led to higher kitchen usage, and as a result, there is a need for durable and versatile kitchen sinks that can withstand heavy usage and accommodate various cooking and cleaning tasks.
Kitchen sinks with innovative features and designs that offer multiple functionalities are gaining popularity, which includes sink bowls with integrated cutting boards, colanders, or accessories that enhance the efficiency and convenience of food preparation and cleanup.
Kitchen sinks that are easy to clean and maintain are in high demand. Consumers are looking for sink bowls with smooth surfaces, stain-resistant materials, and anti-bacterial properties, ensuring a hygienic environment in the kitchen.
The Start-up Ecosystem: How key Players are opening Frontiers for Future Growth?
Sink bowls market startup players are adopting various marketing strategies such as new product launches, geographical expansion, merger and acquisitions, partnerships and collaboration to to create a larger customer base.
For instance:
- The Gallery Ideal Workstation, established in 2011, is a startup specializing in kitchen workstations, offers customizable accessories that can be added to their sink bowls. The accessories include cutting boards, colanders, drying racks, and stainless steel bowls that fit into the workstation, allowing users to create a personalized and functional workspace.
- Ruvati Workstation Sinks, founded in the same year, is a startup that produces stainless steel sinks, offers workstation sinks with customizable accessories. The company’s sink bowls come with integrated ledges that allow users to add cutting boards, colanders, and other accessories to create a personalized and efficient workspace.
Who are the Leading Players in the Sink Bowls Market?
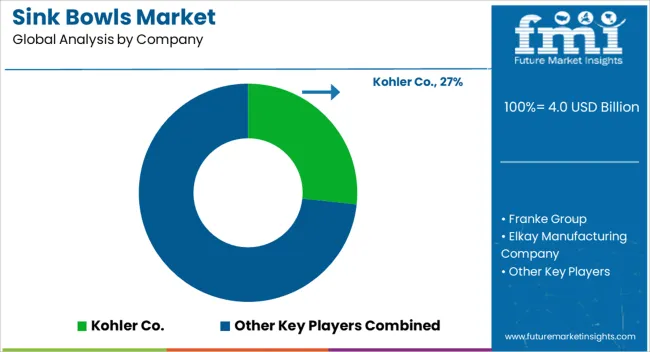
Prominent players in the sink bowls market are Kohler Co., Hafele, Franke Group, Elkay Manufacturing Company, MR Direct, Blanco, Teka Group, Matte Stone, Duravit AG, Kraus, Roca Sanitario, S.A., Villeroy & Boch AG, American Standard Brands, and Moen Incorporated, among others.
Recent Developments:
- In 2022, Hafele unveiled their meticulously handcrafted ARGENTO kitchen sink line. The exceptional collection showcases sinks, that have been expertly crafted using manual welding techniques. Each sink in this line-up has undergone painstaking attention to detail, resulting in a product of unparalleled quality and craftsmanship.
- In 2022, VIGO released its Matte Stone sink collection, which features sink bowls made from a composite material that combines acrylic polymers with natural minerals. The collection offers a range of modern, matte finish options, providing a sleek and contemporary look for kitchens.
- In the same year, Kraus introduced a line of zero-radius sink bowls. The sink bowls feature sharp corners and a geometric design, offering a modern and minimalist aesthetic for kitchen spaces.
Report Scope
Report Attribute | Details |
---|---|
Growth Rate |
CAGR of 4.4% from 2023 to 2033 |
Market Value in 2023 |
US$ 3.7 billion |
Market Value in 2033 |
US$ 5.7 billion |
Base Year for Estimation |
2022 |
Historical Data |
2018 to 2022 |
Forecast Period |
2023 to 2033 |
Quantitative Units |
Revenue in US$ billion and CAGR from 2023 to 2033 |
Report Coverage |
Revenue Forecast, Company Ranking, Competitive Landscape, Growth Factors, Trends, and Pricing Analysis |
Segments Covered |
|
Regions Covered |
|
Key Countries Profiled |
|
Key Companies Profiled |
|
Key Segments Covered in the Sink Bowls Industry Analysis
By Material:
- Stainless Steel
- Composite
- Glass
By Installation Type:
- Undermount
- Top Mount
- Flush Mount
- Freestanding
By Size and Shape:
- Single Bowl
- Double Bowl
- Rectangular
By Application:
- Kitchen Sinks
- Bathroom Sinks
By Features:
- Integrated Drainboard
- Apron Front
- Accessories
By Region:
- North America
- Latin America
- Europe
- Asia Pacific
- Middle East & Africa
Frequently Asked Questions
What is Sink Bowls Market Valuation?
The global sink bowl market is valued at US$ 3.7 billion in 2023.
What is the Projected CAGR for the Sink Bowls Market?
The sink bowls market may rise at a 4.4% CAGR through 2023.
What will be the Sink Bowls Market’s Valuation by 2033?
The sink bowls market size is likely to reach US$ 5.7 billion by 2033.
Which is the Leading Application in the Sink Bowls Market?
The kitchen sinks segment is leading with a 4.2% CAGR through 2033.
Which Material Segment Dominates the Sink Bowls Market?
The composite segment dominates the market, with a 4.3% CAGR through 2033.
Table of Content
1. Executive Summary 1.1. Global Market Outlook 1.2. Demand-side Trends 1.3. Supply-side Trends 1.4. Technology Roadmap Analysis 1.5. Analysis and Recommendations 2. Market Overview 2.1. Market Coverage / Taxonomy 2.2. Market Definition / Scope / Limitations 3. Market Background 3.1. Market Dynamics 3.1.1. Drivers 3.1.2. Restraints 3.1.3. Opportunity 3.1.4. Trends 3.2. Scenario Forecast 3.2.1. Demand in Optimistic Scenario 3.2.2. Demand in Likely Scenario 3.2.3. Demand in Conservative Scenario 3.3. Opportunity Map Analysis 3.4. Product Life Cycle Analysis 3.5. Supply Chain Analysis 3.5.1. Supply Side Participants and Their Roles 3.5.1.1. Producers 3.5.1.2. Mid-Level Participants (Traders/ Agents/ Brokers) 3.5.1.3. Wholesalers and Distributors 3.5.2. Value Added and Value Created at Node in the Supply Chain 3.5.3. List of Raw Material Suppliers 3.5.4. List of Existing and Potential Buyers 3.6. Investment Feasibility Matrix 3.7. Value Chain Analysis 3.7.1. Profit Margin Analysis 3.7.2. Wholesalers and Distributors 3.7.3. Retailers 3.8. PESTLE and Porter’s Analysis 3.9. Regulatory Landscape 3.9.1. By Key Regions 3.9.2. By Key Countries 3.10. Regional Parent Market Outlook 3.11. Production and Consumption Statistics 3.12. Import and Export Statistics 4. Global Market Analysis 2018 to 2022 and Forecast, 2023 to 2033 4.1. Historical Market Size Value (US$ Million) & Volume (Units) Analysis, 2018 to 2022 4.2. Current and Future Market Size Value (US$ Million) & Volume (Units) Projections, 2023 to 2033 4.2.1. Y-o-Y Growth Trend Analysis 4.2.2. Absolute $ Opportunity Analysis 5. Global Market Analysis 2018 to 2022 and Forecast 2023 to 2033, By Material 5.1. Introduction / Key Findings 5.2. Historical Market Size Value (US$ Million) & Volume (Units) Analysis By Material, 2018 to 2022 5.3. Current and Future Market Size Value (US$ Million) & Volume (Units) Analysis and Forecast By Material, 2023 to 2033 5.3.1. Stainless Steel 5.3.2. Composite 5.3.3. Glass 5.4. Y-o-Y Growth Trend Analysis By Material, 2018 to 2022 5.5. Absolute $ Opportunity Analysis By Material, 2023 to 2033 6. Global Market Analysis 2018 to 2022 and Forecast 2023 to 2033, By Installation Type 6.1. Introduction / Key Findings 6.2. Historical Market Size Value (US$ Million) & Volume (Units) Analysis By Installation Type, 2018 to 2022 6.3. Current and Future Market Size Value (US$ Million) & Volume (Units) Analysis and Forecast By Installation Type, 2023 to 2033 6.3.1. Undermount 6.3.2. Top Mount 6.3.3. Flush Mount 6.3.4. Freestanding 6.4. Y-o-Y Growth Trend Analysis By Installation Type, 2018 to 2022 6.5. Absolute $ Opportunity Analysis By Installation Type, 2023 to 2033 7. Global Market Analysis 2018 to 2022 and Forecast 2023 to 2033, By Size and Shape 7.1. Introduction / Key Findings 7.2. Historical Market Size Value (US$ Million) & Volume (Units) Analysis By Size and Shape, 2018 to 2022 7.3. Current and Future Market Size Value (US$ Million) & Volume (Units) Analysis and Forecast By Size and Shape, 2023 to 2033 7.3.1. Single Bowl 7.3.2. Double Bowl 7.3.3. Rectangular 7.4. Y-o-Y Growth Trend Analysis By Size and Shape, 2018 to 2022 7.5. Absolute $ Opportunity Analysis By Size and Shape, 2023 to 2033 8. Global Market Analysis 2018 to 2022 and Forecast 2023 to 2033, By Application 8.1. Introduction / Key Findings 8.2. Historical Market Size Value (US$ Million) & Volume (Units) Analysis By Application, 2018 to 2022 8.3. Current and Future Market Size Value (US$ Million) & Volume (Units) Analysis and Forecast By Application, 2023 to 2033 8.3.1. Kitchen Sinks 8.3.2. Bathroom Sinks 8.4. Y-o-Y Growth Trend Analysis By Application, 2018 to 2022 8.5. Absolute $ Opportunity Analysis By Application, 2023 to 2033 9. Global Market Analysis 2018 to 2022 and Forecast 2023 to 2033, By Features 9.1. Introduction / Key Findings 9.2. Historical Market Size Value (US$ Million) & Volume (Units) Analysis By Features, 2018 to 2022 9.3. Current and Future Market Size Value (US$ Million) & Volume (Units) Analysis and Forecast By Features, 2023 to 2033 9.3.1. Integrated Drainboard 9.3.2. Apron Front 9.3.3. Accessories 9.4. Y-o-Y Growth Trend Analysis By Features, 2018 to 2022 9.5. Absolute $ Opportunity Analysis By Features, 2023 to 2033 10. Global Market Analysis 2018 to 2022 and Forecast 2023 to 2033, By Region 10.1. Introduction 10.2. Historical Market Size Value (US$ Million) & Volume (Units) Analysis By Region, 2018 to 2022 10.3. Current Market Size Value (US$ Million) & Volume (Units) Analysis and Forecast By Region, 2023 to 2033 10.3.1. North America 10.3.2. Latin America 10.3.3. Europe 10.3.4. Asia Pacific 10.3.5. MEA 10.4. Market Attractiveness Analysis By Region 11. North America Market Analysis 2018 to 2022 and Forecast 2023 to 2033, By Country 11.1. Historical Market Size Value (US$ Million) & Volume (Units) Trend Analysis By Market Taxonomy, 2018 to 2022 11.2. Market Size Value (US$ Million) & Volume (Units) Forecast By Market Taxonomy, 2023 to 2033 11.2.1. By Country 11.2.1.1. USA 11.2.1.2. Canada 11.2.2. By Material 11.2.3. By Installation Type 11.2.4. By Size and Shape 11.2.5. By Application 11.2.6. By Features 11.3. Market Attractiveness Analysis 11.3.1. By Country 11.3.2. By Material 11.3.3. By Installation Type 11.3.4. By Size and Shape 11.3.5. By Application 11.3.6. By Features 11.4. Key Takeaways 12. Latin America Market Analysis 2018 to 2022 and Forecast 2023 to 2033, By Country 12.1. Historical Market Size Value (US$ Million) & Volume (Units) Trend Analysis By Market Taxonomy, 2018 to 2022 12.2. Market Size Value (US$ Million) & Volume (Units) Forecast By Market Taxonomy, 2023 to 2033 12.2.1. By Country 12.2.1.1. Brazil 12.2.1.2. Mexico 12.2.1.3. Rest of Latin America 12.2.2. By Material 12.2.3. By Installation Type 12.2.4. By Size and Shape 12.2.5. By Application 12.2.6. By Features 12.3. Market Attractiveness Analysis 12.3.1. By Country 12.3.2. By Material 12.3.3. By Installation Type 12.3.4. By Size and Shape 12.3.5. By Application 12.3.6. By Features 12.4. Key Takeaways 13. Europe Market Analysis 2018 to 2022 and Forecast 2023 to 2033, By Country 13.1. Historical Market Size Value (US$ Million) & Volume (Units) Trend Analysis By Market Taxonomy, 2018 to 2022 13.2. Market Size Value (US$ Million) & Volume (Units) Forecast By Market Taxonomy, 2023 to 2033 13.2.1. By Country 13.2.1.1. Germany 13.2.1.2. UK 13.2.1.3. France 13.2.1.4. Spain 13.2.1.5. Italy 13.2.1.6. Rest of Europe 13.2.2. By Material 13.2.3. By Installation Type 13.2.4. By Size and Shape 13.2.5. By Application 13.2.6. By Features 13.3. Market Attractiveness Analysis 13.3.1. By Country 13.3.2. By Material 13.3.3. By Installation Type 13.3.4. By Size and Shape 13.3.5. By Application 13.3.6. By Features 13.4. Key Takeaways 14. Asia Pacific Market Analysis 2018 to 2022 and Forecast 2023 to 2033, By Country 14.1. Historical Market Size Value (US$ Million) & Volume (Units) Trend Analysis By Market Taxonomy, 2018 to 2022 14.2. Market Size Value (US$ Million) & Volume (Units) Forecast By Market Taxonomy, 2023 to 2033 14.2.1. By Country 14.2.1.1. China 14.2.1.2. Japan 14.2.1.3. South Korea 14.2.1.4. Singapore 14.2.1.5. Thailand 14.2.1.6. Indonesia 14.2.1.7. Australia 14.2.1.8. New Zealand 14.2.1.9. Rest of Asia Pacific 14.2.2. By Material 14.2.3. By Installation Type 14.2.4. By Size and Shape 14.2.5. By Application 14.2.6. By Features 14.3. Market Attractiveness Analysis 14.3.1. By Country 14.3.2. By Material 14.3.3. By Installation Type 14.3.4. By Size and Shape 14.3.5. By Application 14.3.6. By Features 14.4. Key Takeaways 15. MEA Market Analysis 2018 to 2022 and Forecast 2023 to 2033, By Country 15.1. Historical Market Size Value (US$ Million) & Volume (Units) Trend Analysis By Market Taxonomy, 2018 to 2022 15.2. Market Size Value (US$ Million) & Volume (Units) Forecast By Market Taxonomy, 2023 to 2033 15.2.1. By Country 15.2.1.1. GCC Countries 15.2.1.2. South Africa 15.2.1.3. Israel 15.2.1.4. Rest of MEA 15.2.2. By Material 15.2.3. By Installation Type 15.2.4. By Size and Shape 15.2.5. By Application 15.2.6. By Features 15.3. Market Attractiveness Analysis 15.3.1. By Country 15.3.2. By Material 15.3.3. By Installation Type 15.3.4. By Size and Shape 15.3.5. By Application 15.3.6. By Features 15.4. Key Takeaways 16. Key Countries Market Analysis 16.1. USA 16.1.1. Pricing Analysis 16.1.2. Market Share Analysis, 2022 16.1.2.1. By Material 16.1.2.2. By Installation Type 16.1.2.3. By Size and Shape 16.1.2.4. By Application 16.1.2.5. By Features 16.2. Canada 16.2.1. Pricing Analysis 16.2.2. Market Share Analysis, 2022 16.2.2.1. By Material 16.2.2.2. By Installation Type 16.2.2.3. By Size and Shape 16.2.2.4. By Application 16.2.2.5. By Features 16.3. Brazil 16.3.1. Pricing Analysis 16.3.2. Market Share Analysis, 2022 16.3.2.1. By Material 16.3.2.2. By Installation Type 16.3.2.3. By Size and Shape 16.3.2.4. By Application 16.3.2.5. By Features 16.4. Mexico 16.4.1. Pricing Analysis 16.4.2. Market Share Analysis, 2022 16.4.2.1. By Material 16.4.2.2. By Installation Type 16.4.2.3. By Size and Shape 16.4.2.4. By Application 16.4.2.5. By Features 16.5. Germany 16.5.1. Pricing Analysis 16.5.2. Market Share Analysis, 2022 16.5.2.1. By Material 16.5.2.2. By Installation Type 16.5.2.3. By Size and Shape 16.5.2.4. By Application 16.5.2.5. By Features 16.6. UK 16.6.1. Pricing Analysis 16.6.2. Market Share Analysis, 2022 16.6.2.1. By Material 16.6.2.2. By Installation Type 16.6.2.3. By Size and Shape 16.6.2.4. By Application 16.6.2.5. By Features 16.7. France 16.7.1. Pricing Analysis 16.7.2. Market Share Analysis, 2022 16.7.2.1. By Material 16.7.2.2. By Installation Type 16.7.2.3. By Size and Shape 16.7.2.4. By Application 16.7.2.5. By Features 16.8. Spain 16.8.1. Pricing Analysis 16.8.2. Market Share Analysis, 2022 16.8.2.1. By Material 16.8.2.2. By Installation Type 16.8.2.3. By Size and Shape 16.8.2.4. By Application 16.8.2.5. By Features 16.9. Italy 16.9.1. Pricing Analysis 16.9.2. Market Share Analysis, 2022 16.9.2.1. By Material 16.9.2.2. By Installation Type 16.9.2.3. By Size and Shape 16.9.2.4. By Application 16.9.2.5. By Features 16.10. China 16.10.1. Pricing Analysis 16.10.2. Market Share Analysis, 2022 16.10.2.1. By Material 16.10.2.2. By Installation Type 16.10.2.3. By Size and Shape 16.10.2.4. By Application 16.10.2.5. By Features 16.11. Japan 16.11.1. Pricing Analysis 16.11.2. Market Share Analysis, 2022 16.11.2.1. By Material 16.11.2.2. By Installation Type 16.11.2.3. By Size and Shape 16.11.2.4. By Application 16.11.2.5. By Features 16.12. South Korea 16.12.1. Pricing Analysis 16.12.2. Market Share Analysis, 2022 16.12.2.1. By Material 16.12.2.2. By Installation Type 16.12.2.3. By Size and Shape 16.12.2.4. By Application 16.12.2.5. By Features 16.13. Singapore 16.13.1. Pricing Analysis 16.13.2. Market Share Analysis, 2022 16.13.2.1. By Material 16.13.2.2. By Installation Type 16.13.2.3. By Size and Shape 16.13.2.4. By Application 16.13.2.5. By Features 16.14. Thailand 16.14.1. Pricing Analysis 16.14.2. Market Share Analysis, 2022 16.14.2.1. By Material 16.14.2.2. By Installation Type 16.14.2.3. By Size and Shape 16.14.2.4. By Application 16.14.2.5. By Features 16.15. Indonesia 16.15.1. Pricing Analysis 16.15.2. Market Share Analysis, 2022 16.15.2.1. By Material 16.15.2.2. By Installation Type 16.15.2.3. By Size and Shape 16.15.2.4. By Application 16.15.2.5. By Features 16.16. Australia 16.16.1. Pricing Analysis 16.16.2. Market Share Analysis, 2022 16.16.2.1. By Material 16.16.2.2. By Installation Type 16.16.2.3. By Size and Shape 16.16.2.4. By Application 16.16.2.5. By Features 16.17. New Zealand 16.17.1. Pricing Analysis 16.17.2. Market Share Analysis, 2022 16.17.2.1. By Material 16.17.2.2. By Installation Type 16.17.2.3. By Size and Shape 16.17.2.4. By Application 16.17.2.5. By Features 16.18. GCC Countries 16.18.1. Pricing Analysis 16.18.2. Market Share Analysis, 2022 16.18.2.1. By Material 16.18.2.2. By Installation Type 16.18.2.3. By Size and Shape 16.18.2.4. By Application 16.18.2.5. By Features 16.19. South Africa 16.19.1. Pricing Analysis 16.19.2. Market Share Analysis, 2022 16.19.2.1. By Material 16.19.2.2. By Installation Type 16.19.2.3. By Size and Shape 16.19.2.4. By Application 16.19.2.5. By Features 16.20. Israel 16.20.1. Pricing Analysis 16.20.2. Market Share Analysis, 2022 16.20.2.1. By Material 16.20.2.2. By Installation Type 16.20.2.3. By Size and Shape 16.20.2.4. By Application 16.20.2.5. By Features 17. Market Structure Analysis 17.1. Competition Dashboard 17.2. Competition Benchmarking 17.3. Market Share Analysis of Top Players 17.3.1. By Regional 17.3.2. By Material 17.3.3. By Installation Type 17.3.4. By Size and Shape 17.3.5. By Application 17.3.6. By Features 18. Competition Analysis 18.1. Competition Deep Dive 18.1.1. Kohler Co. 18.1.1.1. Overview 18.1.1.2. Product Portfolio 18.1.1.3. Profitability by Market Segments 18.1.1.4. Sales Footprint 18.1.1.5. Strategy Overview 18.1.1.5.1. Marketing Strategy 18.1.1.5.2. Product Strategy 18.1.1.5.3. Channel Strategy 18.1.2. Franke Group 18.1.2.1. Overview 18.1.2.2. Product Portfolio 18.1.2.3. Profitability by Market Segments 18.1.2.4. Sales Footprint 18.1.2.5. Strategy Overview 18.1.2.5.1. Marketing Strategy 18.1.2.5.2. Product Strategy 18.1.2.5.3. Channel Strategy 18.1.3. Elkay Manufacturing Company 18.1.3.1. Overview 18.1.3.2. Product Portfolio 18.1.3.3. Profitability by Market Segments 18.1.3.4. Sales Footprint 18.1.3.5. Strategy Overview 18.1.3.5.1. Marketing Strategy 18.1.3.5.2. Product Strategy 18.1.3.5.3. Channel Strategy 18.1.4. Blanco 18.1.4.1. Overview 18.1.4.2. Product Portfolio 18.1.4.3. Profitability by Market Segments 18.1.4.4. Sales Footprint 18.1.4.5. Strategy Overview 18.1.4.5.1. Marketing Strategy 18.1.4.5.2. Product Strategy 18.1.4.5.3. Channel Strategy 18.1.5. Teka Group 18.1.5.1. Overview 18.1.5.2. Product Portfolio 18.1.5.3. Profitability by Market Segments 18.1.5.4. Sales Footprint 18.1.5.5. Strategy Overview 18.1.5.5.1. Marketing Strategy 18.1.5.5.2. Product Strategy 18.1.5.5.3. Channel Strategy 18.1.6. Duravit AG 18.1.6.1. Overview 18.1.6.2. Product Portfolio 18.1.6.3. Profitability by Market Segments 18.1.6.4. Sales Footprint 18.1.6.5. Strategy Overview 18.1.6.5.1. Marketing Strategy 18.1.6.5.2. Product Strategy 18.1.6.5.3. Channel Strategy 18.1.7. Roca Sanitario, S.A. 18.1.7.1. Overview 18.1.7.2. Product Portfolio 18.1.7.3. Profitability by Market Segments 18.1.7.4. Sales Footprint 18.1.7.5. Strategy Overview 18.1.7.5.1. Marketing Strategy 18.1.7.5.2. Product Strategy 18.1.7.5.3. Channel Strategy 18.1.8. Villeroy & Boch AG 18.1.8.1. Overview 18.1.8.2. Product Portfolio 18.1.8.3. Profitability by Market Segments 18.1.8.4. Sales Footprint 18.1.8.5. Strategy Overview 18.1.8.5.1. Marketing Strategy 18.1.8.5.2. Product Strategy 18.1.8.5.3. Channel Strategy 18.1.9. American Standard Brands 18.1.9.1. Overview 18.1.9.2. Product Portfolio 18.1.9.3. Profitability by Market Segments 18.1.9.4. Sales Footprint 18.1.9.5. Strategy Overview 18.1.9.5.1. Marketing Strategy 18.1.9.5.2. Product Strategy 18.1.9.5.3. Channel Strategy 18.1.10. Moen Incorporated 18.1.10.1. Overview 18.1.10.2. Product Portfolio 18.1.10.3. Profitability by Market Segments 18.1.10.4. Sales Footprint 18.1.10.5. Strategy Overview 18.1.10.5.1. Marketing Strategy 18.1.10.5.2. Product Strategy 18.1.10.5.3. Channel Strategy 19. Assumptions & Acronyms Used 20. Research Methodology
Don't pay for what you don't need
Customize your report by selecting specific countries or regions and save 30%!
List of Tables
Table 1: Global Market Value (US$ Million) Forecast by Region, 2018 to 2033 Table 2: Global Market Volume (Units) Forecast by Region, 2018 to 2033 Table 3: Global Market Value (US$ Million) Forecast by Material, 2018 to 2033 Table 4: Global Market Volume (Units) Forecast by Material, 2018 to 2033 Table 5: Global Market Value (US$ Million) Forecast by Installation Type, 2018 to 2033 Table 6: Global Market Volume (Units) Forecast by Installation Type, 2018 to 2033 Table 7: Global Market Value (US$ Million) Forecast by Size and Shape, 2018 to 2033 Table 8: Global Market Volume (Units) Forecast by Size and Shape, 2018 to 2033 Table 9: Global Market Value (US$ Million) Forecast by Application, 2018 to 2033 Table 10: Global Market Volume (Units) Forecast by Application, 2018 to 2033 Table 11: Global Market Value (US$ Million) Forecast by Features, 2018 to 2033 Table 12: Global Market Volume (Units) Forecast by Features, 2018 to 2033 Table 13: North America Market Value (US$ Million) Forecast by Country, 2018 to 2033 Table 14: North America Market Volume (Units) Forecast by Country, 2018 to 2033 Table 15: North America Market Value (US$ Million) Forecast by Material, 2018 to 2033 Table 16: North America Market Volume (Units) Forecast by Material, 2018 to 2033 Table 17: North America Market Value (US$ Million) Forecast by Installation Type, 2018 to 2033 Table 18: North America Market Volume (Units) Forecast by Installation Type, 2018 to 2033 Table 19: North America Market Value (US$ Million) Forecast by Size and Shape, 2018 to 2033 Table 20: North America Market Volume (Units) Forecast by Size and Shape, 2018 to 2033 Table 21: North America Market Value (US$ Million) Forecast by Application, 2018 to 2033 Table 22: North America Market Volume (Units) Forecast by Application, 2018 to 2033 Table 23: North America Market Value (US$ Million) Forecast by Features, 2018 to 2033 Table 24: North America Market Volume (Units) Forecast by Features, 2018 to 2033 Table 25: Latin America Market Value (US$ Million) Forecast by Country, 2018 to 2033 Table 26: Latin America Market Volume (Units) Forecast by Country, 2018 to 2033 Table 27: Latin America Market Value (US$ Million) Forecast by Material, 2018 to 2033 Table 28: Latin America Market Volume (Units) Forecast by Material, 2018 to 2033 Table 29: Latin America Market Value (US$ Million) Forecast by Installation Type, 2018 to 2033 Table 30: Latin America Market Volume (Units) Forecast by Installation Type, 2018 to 2033 Table 31: Latin America Market Value (US$ Million) Forecast by Size and Shape, 2018 to 2033 Table 32: Latin America Market Volume (Units) Forecast by Size and Shape, 2018 to 2033 Table 33: Latin America Market Value (US$ Million) Forecast by Application, 2018 to 2033 Table 34: Latin America Market Volume (Units) Forecast by Application, 2018 to 2033 Table 35: Latin America Market Value (US$ Million) Forecast by Features, 2018 to 2033 Table 36: Latin America Market Volume (Units) Forecast by Features, 2018 to 2033 Table 37: Europe Market Value (US$ Million) Forecast by Country, 2018 to 2033 Table 38: Europe Market Volume (Units) Forecast by Country, 2018 to 2033 Table 39: Europe Market Value (US$ Million) Forecast by Material, 2018 to 2033 Table 40: Europe Market Volume (Units) Forecast by Material, 2018 to 2033 Table 41: Europe Market Value (US$ Million) Forecast by Installation Type, 2018 to 2033 Table 42: Europe Market Volume (Units) Forecast by Installation Type, 2018 to 2033 Table 43: Europe Market Value (US$ Million) Forecast by Size and Shape, 2018 to 2033 Table 44: Europe Market Volume (Units) Forecast by Size and Shape, 2018 to 2033 Table 45: Europe Market Value (US$ Million) Forecast by Application, 2018 to 2033 Table 46: Europe Market Volume (Units) Forecast by Application, 2018 to 2033 Table 47: Europe Market Value (US$ Million) Forecast by Features, 2018 to 2033 Table 48: Europe Market Volume (Units) Forecast by Features, 2018 to 2033 Table 49: Asia Pacific Market Value (US$ Million) Forecast by Country, 2018 to 2033 Table 50: Asia Pacific Market Volume (Units) Forecast by Country, 2018 to 2033 Table 51: Asia Pacific Market Value (US$ Million) Forecast by Material, 2018 to 2033 Table 52: Asia Pacific Market Volume (Units) Forecast by Material, 2018 to 2033 Table 53: Asia Pacific Market Value (US$ Million) Forecast by Installation Type, 2018 to 2033 Table 54: Asia Pacific Market Volume (Units) Forecast by Installation Type, 2018 to 2033 Table 55: Asia Pacific Market Value (US$ Million) Forecast by Size and Shape, 2018 to 2033 Table 56: Asia Pacific Market Volume (Units) Forecast by Size and Shape, 2018 to 2033 Table 57: Asia Pacific Market Value (US$ Million) Forecast by Application, 2018 to 2033 Table 58: Asia Pacific Market Volume (Units) Forecast by Application, 2018 to 2033 Table 59: Asia Pacific Market Value (US$ Million) Forecast by Features, 2018 to 2033 Table 60: Asia Pacific Market Volume (Units) Forecast by Features, 2018 to 2033 Table 61: MEA Market Value (US$ Million) Forecast by Country, 2018 to 2033 Table 62: MEA Market Volume (Units) Forecast by Country, 2018 to 2033 Table 63: MEA Market Value (US$ Million) Forecast by Material, 2018 to 2033 Table 64: MEA Market Volume (Units) Forecast by Material, 2018 to 2033 Table 65: MEA Market Value (US$ Million) Forecast by Installation Type, 2018 to 2033 Table 66: MEA Market Volume (Units) Forecast by Installation Type, 2018 to 2033 Table 67: MEA Market Value (US$ Million) Forecast by Size and Shape, 2018 to 2033 Table 68: MEA Market Volume (Units) Forecast by Size and Shape, 2018 to 2033 Table 69: MEA Market Value (US$ Million) Forecast by Application, 2018 to 2033 Table 70: MEA Market Volume (Units) Forecast by Application, 2018 to 2033 Table 71: MEA Market Value (US$ Million) Forecast by Features, 2018 to 2033 Table 72: MEA Market Volume (Units) Forecast by Features, 2018 to 2033
List of Charts
Figure 1: Global Market Value (US$ Million) by Material, 2023 to 2033 Figure 2: Global Market Value (US$ Million) by Installation Type, 2023 to 2033 Figure 3: Global Market Value (US$ Million) by Size and Shape, 2023 to 2033 Figure 4: Global Market Value (US$ Million) by Application, 2023 to 2033 Figure 5: Global Market Value (US$ Million) by Features, 2023 to 2033 Figure 6: Global Market Value (US$ Million) by Region, 2023 to 2033 Figure 7: Global Market Value (US$ Million) Analysis by Region, 2018 to 2033 Figure 8: Global Market Volume (Units) Analysis by Region, 2018 to 2033 Figure 9: Global Market Value Share (%) and BPS Analysis by Region, 2023 to 2033 Figure 10: Global Market Y-o-Y Growth (%) Projections by Region, 2023 to 2033 Figure 11: Global Market Value (US$ Million) Analysis by Material, 2018 to 2033 Figure 12: Global Market Volume (Units) Analysis by Material, 2018 to 2033 Figure 13: Global Market Value Share (%) and BPS Analysis by Material, 2023 to 2033 Figure 14: Global Market Y-o-Y Growth (%) Projections by Material, 2023 to 2033 Figure 15: Global Market Value (US$ Million) Analysis by Installation Type, 2018 to 2033 Figure 16: Global Market Volume (Units) Analysis by Installation Type, 2018 to 2033 Figure 17: Global Market Value Share (%) and BPS Analysis by Installation Type, 2023 to 2033 Figure 18: Global Market Y-o-Y Growth (%) Projections by Installation Type, 2023 to 2033 Figure 19: Global Market Value (US$ Million) Analysis by Size and Shape, 2018 to 2033 Figure 20: Global Market Volume (Units) Analysis by Size and Shape, 2018 to 2033 Figure 21: Global Market Value Share (%) and BPS Analysis by Size and Shape, 2023 to 2033 Figure 22: Global Market Y-o-Y Growth (%) Projections by Size and Shape, 2023 to 2033 Figure 23: Global Market Value (US$ Million) Analysis by Application, 2018 to 2033 Figure 24: Global Market Volume (Units) Analysis by Application, 2018 to 2033 Figure 25: Global Market Value Share (%) and BPS Analysis by Application, 2023 to 2033 Figure 26: Global Market Y-o-Y Growth (%) Projections by Application, 2023 to 2033 Figure 27: Global Market Value (US$ Million) Analysis by Features, 2018 to 2033 Figure 28: Global Market Volume (Units) Analysis by Features, 2018 to 2033 Figure 29: Global Market Value Share (%) and BPS Analysis by Features, 2023 to 2033 Figure 30: Global Market Y-o-Y Growth (%) Projections by Features, 2023 to 2033 Figure 31: Global Market Attractiveness by Material, 2023 to 2033 Figure 32: Global Market Attractiveness by Installation Type, 2023 to 2033 Figure 33: Global Market Attractiveness by Size and Shape, 2023 to 2033 Figure 34: Global Market Attractiveness by Application, 2023 to 2033 Figure 35: Global Market Attractiveness by Features, 2023 to 2033 Figure 36: Global Market Attractiveness by Region, 2023 to 2033 Figure 37: North America Market Value (US$ Million) by Material, 2023 to 2033 Figure 38: North America Market Value (US$ Million) by Installation Type, 2023 to 2033 Figure 39: North America Market Value (US$ Million) by Size and Shape, 2023 to 2033 Figure 40: North America Market Value (US$ Million) by Application, 2023 to 2033 Figure 41: North America Market Value (US$ Million) by Features, 2023 to 2033 Figure 42: North America Market Value (US$ Million) by Country, 2023 to 2033 Figure 43: North America Market Value (US$ Million) Analysis by Country, 2018 to 2033 Figure 44: North America Market Volume (Units) Analysis by Country, 2018 to 2033 Figure 45: North America Market Value Share (%) and BPS Analysis by Country, 2023 to 2033 Figure 46: North America Market Y-o-Y Growth (%) Projections by Country, 2023 to 2033 Figure 47: North America Market Value (US$ Million) Analysis by Material, 2018 to 2033 Figure 48: North America Market Volume (Units) Analysis by Material, 2018 to 2033 Figure 49: North America Market Value Share (%) and BPS Analysis by Material, 2023 to 2033 Figure 50: North America Market Y-o-Y Growth (%) Projections by Material, 2023 to 2033 Figure 51: North America Market Value (US$ Million) Analysis by Installation Type, 2018 to 2033 Figure 52: North America Market Volume (Units) Analysis by Installation Type, 2018 to 2033 Figure 53: North America Market Value Share (%) and BPS Analysis by Installation Type, 2023 to 2033 Figure 54: North America Market Y-o-Y Growth (%) Projections by Installation Type, 2023 to 2033 Figure 55: North America Market Value (US$ Million) Analysis by Size and Shape, 2018 to 2033 Figure 56: North America Market Volume (Units) Analysis by Size and Shape, 2018 to 2033 Figure 57: North America Market Value Share (%) and BPS Analysis by Size and Shape, 2023 to 2033 Figure 58: North America Market Y-o-Y Growth (%) Projections by Size and Shape, 2023 to 2033 Figure 59: North America Market Value (US$ Million) Analysis by Application, 2018 to 2033 Figure 60: North America Market Volume (Units) Analysis by Application, 2018 to 2033 Figure 61: North America Market Value Share (%) and BPS Analysis by Application, 2023 to 2033 Figure 62: North America Market Y-o-Y Growth (%) Projections by Application, 2023 to 2033 Figure 63: North America Market Value (US$ Million) Analysis by Features, 2018 to 2033 Figure 64: North America Market Volume (Units) Analysis by Features, 2018 to 2033 Figure 65: North America Market Value Share (%) and BPS Analysis by Features, 2023 to 2033 Figure 66: North America Market Y-o-Y Growth (%) Projections by Features, 2023 to 2033 Figure 67: North America Market Attractiveness by Material, 2023 to 2033 Figure 68: North America Market Attractiveness by Installation Type, 2023 to 2033 Figure 69: North America Market Attractiveness by Size and Shape, 2023 to 2033 Figure 70: North America Market Attractiveness by Application, 2023 to 2033 Figure 71: North America Market Attractiveness by Features, 2023 to 2033 Figure 72: North America Market Attractiveness by Country, 2023 to 2033 Figure 73: Latin America Market Value (US$ Million) by Material, 2023 to 2033 Figure 74: Latin America Market Value (US$ Million) by Installation Type, 2023 to 2033 Figure 75: Latin America Market Value (US$ Million) by Size and Shape, 2023 to 2033 Figure 76: Latin America Market Value (US$ Million) by Application, 2023 to 2033 Figure 77: Latin America Market Value (US$ Million) by Features, 2023 to 2033 Figure 78: Latin America Market Value (US$ Million) by Country, 2023 to 2033 Figure 79: Latin America Market Value (US$ Million) Analysis by Country, 2018 to 2033 Figure 80: Latin America Market Volume (Units) Analysis by Country, 2018 to 2033 Figure 81: Latin America Market Value Share (%) and BPS Analysis by Country, 2023 to 2033 Figure 82: Latin America Market Y-o-Y Growth (%) Projections by Country, 2023 to 2033 Figure 83: Latin America Market Value (US$ Million) Analysis by Material, 2018 to 2033 Figure 84: Latin America Market Volume (Units) Analysis by Material, 2018 to 2033 Figure 85: Latin America Market Value Share (%) and BPS Analysis by Material, 2023 to 2033 Figure 86: Latin America Market Y-o-Y Growth (%) Projections by Material, 2023 to 2033 Figure 87: Latin America Market Value (US$ Million) Analysis by Installation Type, 2018 to 2033 Figure 88: Latin America Market Volume (Units) Analysis by Installation Type, 2018 to 2033 Figure 89: Latin America Market Value Share (%) and BPS Analysis by Installation Type, 2023 to 2033 Figure 90: Latin America Market Y-o-Y Growth (%) Projections by Installation Type, 2023 to 2033 Figure 91: Latin America Market Value (US$ Million) Analysis by Size and Shape, 2018 to 2033 Figure 92: Latin America Market Volume (Units) Analysis by Size and Shape, 2018 to 2033 Figure 93: Latin America Market Value Share (%) and BPS Analysis by Size and Shape, 2023 to 2033 Figure 94: Latin America Market Y-o-Y Growth (%) Projections by Size and Shape, 2023 to 2033 Figure 95: Latin America Market Value (US$ Million) Analysis by Application, 2018 to 2033 Figure 96: Latin America Market Volume (Units) Analysis by Application, 2018 to 2033 Figure 97: Latin America Market Value Share (%) and BPS Analysis by Application, 2023 to 2033 Figure 98: Latin America Market Y-o-Y Growth (%) Projections by Application, 2023 to 2033 Figure 99: Latin America Market Value (US$ Million) Analysis by Features, 2018 to 2033 Figure 100: Latin America Market Volume (Units) Analysis by Features, 2018 to 2033 Figure 101: Latin America Market Value Share (%) and BPS Analysis by Features, 2023 to 2033 Figure 102: Latin America Market Y-o-Y Growth (%) Projections by Features, 2023 to 2033 Figure 103: Latin America Market Attractiveness by Material, 2023 to 2033 Figure 104: Latin America Market Attractiveness by Installation Type, 2023 to 2033 Figure 105: Latin America Market Attractiveness by Size and Shape, 2023 to 2033 Figure 106: Latin America Market Attractiveness by Application, 2023 to 2033 Figure 107: Latin America Market Attractiveness by Features, 2023 to 2033 Figure 108: Latin America Market Attractiveness by Country, 2023 to 2033 Figure 109: Europe Market Value (US$ Million) by Material, 2023 to 2033 Figure 110: Europe Market Value (US$ Million) by Installation Type, 2023 to 2033 Figure 111: Europe Market Value (US$ Million) by Size and Shape, 2023 to 2033 Figure 112: Europe Market Value (US$ Million) by Application, 2023 to 2033 Figure 113: Europe Market Value (US$ Million) by Features, 2023 to 2033 Figure 114: Europe Market Value (US$ Million) by Country, 2023 to 2033 Figure 115: Europe Market Value (US$ Million) Analysis by Country, 2018 to 2033 Figure 116: Europe Market Volume (Units) Analysis by Country, 2018 to 2033 Figure 117: Europe Market Value Share (%) and BPS Analysis by Country, 2023 to 2033 Figure 118: Europe Market Y-o-Y Growth (%) Projections by Country, 2023 to 2033 Figure 119: Europe Market Value (US$ Million) Analysis by Material, 2018 to 2033 Figure 120: Europe Market Volume (Units) Analysis by Material, 2018 to 2033 Figure 121: Europe Market Value Share (%) and BPS Analysis by Material, 2023 to 2033 Figure 122: Europe Market Y-o-Y Growth (%) Projections by Material, 2023 to 2033 Figure 123: Europe Market Value (US$ Million) Analysis by Installation Type, 2018 to 2033 Figure 124: Europe Market Volume (Units) Analysis by Installation Type, 2018 to 2033 Figure 125: Europe Market Value Share (%) and BPS Analysis by Installation Type, 2023 to 2033 Figure 126: Europe Market Y-o-Y Growth (%) Projections by Installation Type, 2023 to 2033 Figure 127: Europe Market Value (US$ Million) Analysis by Size and Shape, 2018 to 2033 Figure 128: Europe Market Volume (Units) Analysis by Size and Shape, 2018 to 2033 Figure 129: Europe Market Value Share (%) and BPS Analysis by Size and Shape, 2023 to 2033 Figure 130: Europe Market Y-o-Y Growth (%) Projections by Size and Shape, 2023 to 2033 Figure 131: Europe Market Value (US$ Million) Analysis by Application, 2018 to 2033 Figure 132: Europe Market Volume (Units) Analysis by Application, 2018 to 2033 Figure 133: Europe Market Value Share (%) and BPS Analysis by Application, 2023 to 2033 Figure 134: Europe Market Y-o-Y Growth (%) Projections by Application, 2023 to 2033 Figure 135: Europe Market Value (US$ Million) Analysis by Features, 2018 to 2033 Figure 136: Europe Market Volume (Units) Analysis by Features, 2018 to 2033 Figure 137: Europe Market Value Share (%) and BPS Analysis by Features, 2023 to 2033 Figure 138: Europe Market Y-o-Y Growth (%) Projections by Features, 2023 to 2033 Figure 139: Europe Market Attractiveness by Material, 2023 to 2033 Figure 140: Europe Market Attractiveness by Installation Type, 2023 to 2033 Figure 141: Europe Market Attractiveness by Size and Shape, 2023 to 2033 Figure 142: Europe Market Attractiveness by Application, 2023 to 2033 Figure 143: Europe Market Attractiveness by Features, 2023 to 2033 Figure 144: Europe Market Attractiveness by Country, 2023 to 2033 Figure 145: Asia Pacific Market Value (US$ Million) by Material, 2023 to 2033 Figure 146: Asia Pacific Market Value (US$ Million) by Installation Type, 2023 to 2033 Figure 147: Asia Pacific Market Value (US$ Million) by Size and Shape, 2023 to 2033 Figure 148: Asia Pacific Market Value (US$ Million) by Application, 2023 to 2033 Figure 149: Asia Pacific Market Value (US$ Million) by Features, 2023 to 2033 Figure 150: Asia Pacific Market Value (US$ Million) by Country, 2023 to 2033 Figure 151: Asia Pacific Market Value (US$ Million) Analysis by Country, 2018 to 2033 Figure 152: Asia Pacific Market Volume (Units) Analysis by Country, 2018 to 2033 Figure 153: Asia Pacific Market Value Share (%) and BPS Analysis by Country, 2023 to 2033 Figure 154: Asia Pacific Market Y-o-Y Growth (%) Projections by Country, 2023 to 2033 Figure 155: Asia Pacific Market Value (US$ Million) Analysis by Material, 2018 to 2033 Figure 156: Asia Pacific Market Volume (Units) Analysis by Material, 2018 to 2033 Figure 157: Asia Pacific Market Value Share (%) and BPS Analysis by Material, 2023 to 2033 Figure 158: Asia Pacific Market Y-o-Y Growth (%) Projections by Material, 2023 to 2033 Figure 159: Asia Pacific Market Value (US$ Million) Analysis by Installation Type, 2018 to 2033 Figure 160: Asia Pacific Market Volume (Units) Analysis by Installation Type, 2018 to 2033 Figure 161: Asia Pacific Market Value Share (%) and BPS Analysis by Installation Type, 2023 to 2033 Figure 162: Asia Pacific Market Y-o-Y Growth (%) Projections by Installation Type, 2023 to 2033 Figure 163: Asia Pacific Market Value (US$ Million) Analysis by Size and Shape, 2018 to 2033 Figure 164: Asia Pacific Market Volume (Units) Analysis by Size and Shape, 2018 to 2033 Figure 165: Asia Pacific Market Value Share (%) and BPS Analysis by Size and Shape, 2023 to 2033 Figure 166: Asia Pacific Market Y-o-Y Growth (%) Projections by Size and Shape, 2023 to 2033 Figure 167: Asia Pacific Market Value (US$ Million) Analysis by Application, 2018 to 2033 Figure 168: Asia Pacific Market Volume (Units) Analysis by Application, 2018 to 2033 Figure 169: Asia Pacific Market Value Share (%) and BPS Analysis by Application, 2023 to 2033 Figure 170: Asia Pacific Market Y-o-Y Growth (%) Projections by Application, 2023 to 2033 Figure 171: Asia Pacific Market Value (US$ Million) Analysis by Features, 2018 to 2033 Figure 172: Asia Pacific Market Volume (Units) Analysis by Features, 2018 to 2033 Figure 173: Asia Pacific Market Value Share (%) and BPS Analysis by Features, 2023 to 2033 Figure 174: Asia Pacific Market Y-o-Y Growth (%) Projections by Features, 2023 to 2033 Figure 175: Asia Pacific Market Attractiveness by Material, 2023 to 2033 Figure 176: Asia Pacific Market Attractiveness by Installation Type, 2023 to 2033 Figure 177: Asia Pacific Market Attractiveness by Size and Shape, 2023 to 2033 Figure 178: Asia Pacific Market Attractiveness by Application, 2023 to 2033 Figure 179: Asia Pacific Market Attractiveness by Features, 2023 to 2033 Figure 180: Asia Pacific Market Attractiveness by Country, 2023 to 2033 Figure 181: MEA Market Value (US$ Million) by Material, 2023 to 2033 Figure 182: MEA Market Value (US$ Million) by Installation Type, 2023 to 2033 Figure 183: MEA Market Value (US$ Million) by Size and Shape, 2023 to 2033 Figure 184: MEA Market Value (US$ Million) by Application, 2023 to 2033 Figure 185: MEA Market Value (US$ Million) by Features, 2023 to 2033 Figure 186: MEA Market Value (US$ Million) by Country, 2023 to 2033 Figure 187: MEA Market Value (US$ Million) Analysis by Country, 2018 to 2033 Figure 188: MEA Market Volume (Units) Analysis by Country, 2018 to 2033 Figure 189: MEA Market Value Share (%) and BPS Analysis by Country, 2023 to 2033 Figure 190: MEA Market Y-o-Y Growth (%) Projections by Country, 2023 to 2033 Figure 191: MEA Market Value (US$ Million) Analysis by Material, 2018 to 2033 Figure 192: MEA Market Volume (Units) Analysis by Material, 2018 to 2033 Figure 193: MEA Market Value Share (%) and BPS Analysis by Material, 2023 to 2033 Figure 194: MEA Market Y-o-Y Growth (%) Projections by Material, 2023 to 2033 Figure 195: MEA Market Value (US$ Million) Analysis by Installation Type, 2018 to 2033 Figure 196: MEA Market Volume (Units) Analysis by Installation Type, 2018 to 2033 Figure 197: MEA Market Value Share (%) and BPS Analysis by Installation Type, 2023 to 2033 Figure 198: MEA Market Y-o-Y Growth (%) Projections by Installation Type, 2023 to 2033 Figure 199: MEA Market Value (US$ Million) Analysis by Size and Shape, 2018 to 2033 Figure 200: MEA Market Volume (Units) Analysis by Size and Shape, 2018 to 2033 Figure 201: MEA Market Value Share (%) and BPS Analysis by Size and Shape, 2023 to 2033 Figure 202: MEA Market Y-o-Y Growth (%) Projections by Size and Shape, 2023 to 2033 Figure 203: MEA Market Value (US$ Million) Analysis by Application, 2018 to 2033 Figure 204: MEA Market Volume (Units) Analysis by Application, 2018 to 2033 Figure 205: MEA Market Value Share (%) and BPS Analysis by Application, 2023 to 2033 Figure 206: MEA Market Y-o-Y Growth (%) Projections by Application, 2023 to 2033 Figure 207: MEA Market Value (US$ Million) Analysis by Features, 2018 to 2033 Figure 208: MEA Market Volume (Units) Analysis by Features, 2018 to 2033 Figure 209: MEA Market Value Share (%) and BPS Analysis by Features, 2023 to 2033 Figure 210: MEA Market Y-o-Y Growth (%) Projections by Features, 2023 to 2033 Figure 211: MEA Market Attractiveness by Material, 2023 to 2033 Figure 212: MEA Market Attractiveness by Installation Type, 2023 to 2033 Figure 213: MEA Market Attractiveness by Size and Shape, 2023 to 2033 Figure 214: MEA Market Attractiveness by Application, 2023 to 2033 Figure 215: MEA Market Attractiveness by Features, 2023 to 2033 Figure 216: MEA Market Attractiveness by Country, 2023 to 2033
Explore Packaging Insights
View Reports