Eco Bowls Market Size and Share Forecast Outlook 2025 to 2035

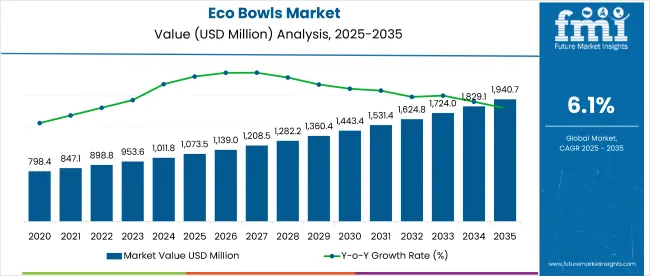
Eco Bowls Market is valued at USD 1.07 billion in 2025 and is expected to reach USD 1.94 billion by 2035, expanding at a CAGR of 6.1% during the forecast period.
Quick Stats for Eco Bowls Market

  • Market value in 2025: USD 1.07 billion
  • Projected market value in 2035: USD 1.94 billion
  • CAGR (2025-2035): 6.1%
  • Largest material segment: Bioplastics (40%)
  • Leading product type: Degradable Bowls (58%)
  • Highest regional CAGR: USA (6.3%)

Eco Bowls Market

Attribute Detail
Market Size (2025) USD 1.07 billion
Market Size (2035) USD 1.94 billion
CAGR (2025 to 2035) 6.1%

The market is segmented by material and product type, with Bioplastics holding the largest share of 40% by material in 2025, and Degradable Bowls dominating the product type segment with 58% share. Regionally, the USA leads with a CAGR of 6.3%, closely followed by Japan at 6.2%, the European Union at 6.0%, and the UK at 5.9%.

The Eco Bowls Market demonstrates robust growth potential over the next decade, driven by increasing environmental awareness and regulatory support for sustainable packaging. Bioplastics emerge as the dominant material segment, favored for their renewable sources and biodegradability, which align with shifting consumer preferences.

Degradable bowls maintain a stronghold in product offerings due to their versatility and compatibility with diverse food applications. Regional analysis reveals that the USA leads growth due to stringent sustainability regulations and rising demand in food service sectors. Japan and the European Union follow closely, supported by government initiatives and consumer inclination towards eco-friendly alternatives. Meanwhile, the UK exhibits steady growth with a focus on reducing single-use plastic consumption.

Challenges such as raw material costs and supply chain complexities may temper growth but are offset by technological advancements in material science and expanding end-use industries. Overall, the market is set to expand steadily, offering opportunities for manufacturers focusing on innovation and regulatory compliance.

Eco Bowls Market Analysis by Top Investment Segments

The Eco Bowls Market is segmented by product type into Single-Use Eco Bowls, Reusable Eco Bowls, Compostable Eco Bowls, and Biodegradable Eco Bowls. By material, the segments include Bamboo, Sugarcane Bagasse, Palm Leaves, Wood Pulp, Recycled Paper, PLA (Polylactic Acid), Cornstarch-based Materials, Coconut Shells, and Other Plant-Based Materials.

The market is further divided by end-use industry comprising Food & Beverage Industry, Catering & Event Services, Retail & E-commerce, Healthcare & Pharmaceuticals, and Personal Care & Cosmetics. Geographically, the market covers North America (USA, Canada, Mexico), Latin America (Brazil, Argentina, Rest of LATAM), Western Europe (Germany, Italy, France, UK, Spain, BENELUX, Nordic, Rest of W. Europe), Eastern Europe (Russia, Hungary, Poland, Balkan & Baltics, Rest of E. Europe), East Asia (China, Japan, South Korea), South Asia & Pacific (India, Australia & New Zealand, ASEAN, Rest of SAP), and Middle East and Africa (GCC Countries, Northern Africa, South Africa, Turkiye, Rest of MEA).
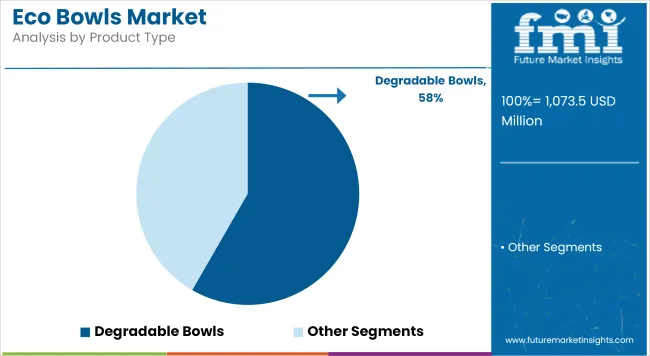
Single-use Eco Bowls Lead by Product Type

Eco Bowls Market By Product Type

The Single-Use Eco Bowls segment leads the product type category in 2025, holding a significant share due to its convenience and widespread adoption in foodservice and takeaway sectors. This segment benefits from increasing regulatory pressure to reduce single-use plastic alternatives, driving demand for sustainable disposable bowls.

However, challenges such as consumer concerns over durability and cost competitiveness relative to conventional plastics remain. Innovations in biodegradable and compostable materials serve as hidden disruptors by enhancing product performance and broadening application possibilities, which is expected to increase adoption by foodservice providers and retailers, boosting overall market growth.
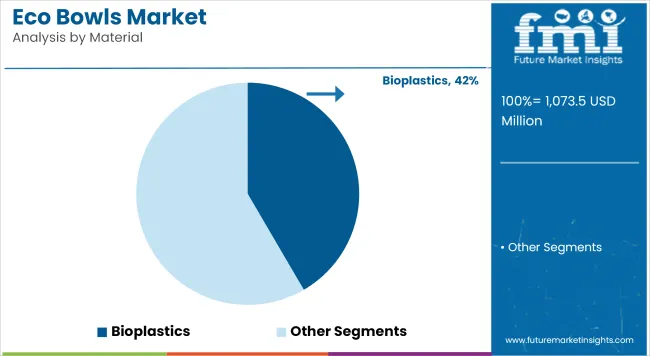
Bamboo Leads the Material Segment Owing to Natural Biodegradability

Eco Bowls Market By Material

Bamboo leads the material segment in 2025, capturing a notable share due to its rapid renewability, strength, and natural biodegradability. Its popularity is driven by consumer preference for eco-friendly products with minimal environmental impact and increasing availability through sustainable farming practices.

However, challenges include processing costs and supply limitations in certain regions. Emerging innovations in bamboo processing technology serve as hidden disruptors, improving product durability and manufacturing efficiency, which in turn boosts adoption across foodservice and retail applications.

Food & Beverage Leads by End-use Industry

The Food & Beverage Industry dominates the end-use segment in 2025, accounting for the largest share driven by increasing demand for sustainable packaging solutions in restaurants, cafes, and quick-service outlets. Regulatory pressures to reduce plastic waste combined with consumer preference for eco-friendly dining experiences have accelerated adoption of eco bowls in this sector.

However, cost sensitivity and performance requirements pose adoption challenges. Innovations in biodegradable materials and improved product design act as hidden disruptors, enhancing usability and appeal, thereby expanding the market footprint across both dine-in and takeaway applications.
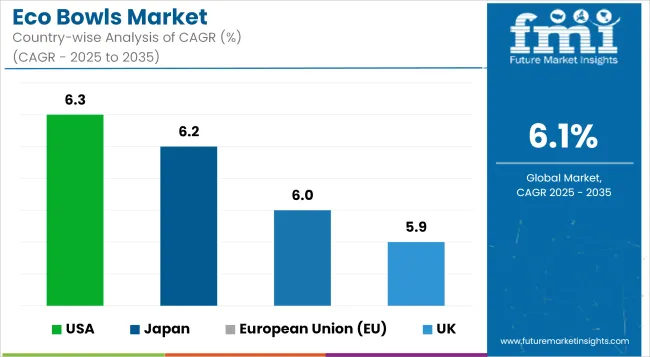
Eco Bowls Market Analysis by Country

Country Wise Analysis Of Eco Bowls Market

United States Eco Bowls Market Analysis

The United States Eco Bowls Market is expected to grow at a CAGR of 6.3% from 2025 to 2035, reflecting strong regulatory and consumer-driven momentum. Federal and state-level bans on single-use plastics have intensified demand for sustainable alternatives, particularly in foodservice, quick-service restaurants, and meal delivery sectors.

Consumers increasingly prioritize eco-friendly packaging, creating opportunities for biodegradable and compostable eco bowls. However, the market faces challenges such as fluctuating raw material costs and supply chain disruptions. Technological advancements in bioplastics and innovative manufacturing processes are improving product quality and reducing costs, fostering broader acceptance. Additionally, major food retailers and restaurant chains are committing to sustainability goals, accelerating adoption.

Despite competitive pressure from conventional plastic alternatives, the USA market’s size and regulatory environment make it a leading growth driver globally. Expansion into new distribution channels such as e-commerce and institutional catering is further expected to sustain growth throughout the forecast period.

Japan Eco Bowls Market Analysis

Japan’s Eco Bowls Market is poised to expand at a CAGR of 6.2% between 2025 and 2035, supported by strong government policies promoting environmental conservation and waste reduction. The country’s comprehensive recycling programs and cultural focus on sustainability encourage consumer acceptance of eco-friendly packaging. Urban centers see higher adoption rates due to dense foodservice activity and consumer demand for convenient yet responsible packaging options.

Despite higher production and raw material costs compared to conventional plastics, ongoing innovations in plant-based materials such as bamboo and cornstarch help improve affordability and performance. Retailers and foodservice providers increasingly collaborate on eco initiatives, such as plastic reduction campaigns and zero-waste efforts. Additionally, growing e-commerce and meal delivery services bolster demand for disposable eco bowls. While regulatory consistency and supply chain limitations pose some challenges, Japan’s market maturity and environmental ethos provide a stable platform for sustained growth.

European Union Eco Bowls Market Analysis

The European Union Eco Bowls Market is forecast to grow at a CAGR of 6.0% from 2025 to 2035, driven by strict regulatory frameworks and heightened environmental awareness among consumers. Policies such as the EU Single-Use Plastics Directive impose bans and restrictions that compel foodservice operators and retailers to adopt sustainable packaging solutions.

Countries like Germany, France, and Italy are leading this transition with strong sustainability commitments. Consumer preference is shifting towards biodegradable and compostable materials, increasing demand for eco bowls across quick-service restaurants, catering, and retail segments. However, regional regulatory variations and raw material price volatility create operational challenges.

Investment in research and development of new materials like PLA and advanced bioplastics supports product innovation. The increasing penetration of online food delivery and takeaway services also contributes significantly. Overall, the EU market is characterized by steady growth fueled by supportive policies and evolving consumer behavior focused on reducing plastic waste.

United Kingdom Eco Bowls Market Analysis

The United Kingdom Eco Bowls Market is projected to grow at a CAGR of 5.9% during 2025-2035, driven by robust governmental initiatives to reduce plastic pollution and strong consumer demand for sustainable packaging. Post-Brexit regulatory realignment maintains rigorous environmental standards, with continued emphasis on reducing single-use plastics in foodservice and retail sectors. The rise of online food delivery and takeaway services has expanded market opportunities for eco bowls, as convenience meets sustainability concerns.

Consumer education campaigns and retailer commitments to plastic reduction further drive adoption. Challenges include supply chain uncertainties and cost pressures related to raw materials and manufacturing. However, advances in compostable materials and reusable product designs enhance market appeal.

The UK’s strong focus on circular economy principles and growing investments in biodegradable technologies position it as a resilient growth market. The combination of regulatory support and evolving consumer preferences will sustain steady demand over the forecast period.
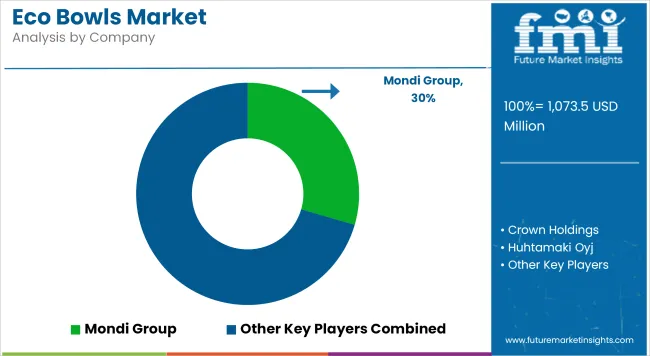
Eco Bowls Market Players and their Strategies

Eco Bowls Market Analysis By Company

The Eco Bowls Market is moderately consolidated, with leading players such as Mondi Group, Crown Holdings, and Huhtamaki Oyj dominating significant market shares through extensive product portfolios and global distribution networks. These companies leverage strong R&D capabilities to innovate biodegradable and compostable materials, meeting evolving regulatory standards and consumer preferences. Mid-sized players like Biopak and Vegware focus on niche markets and sustainable sourcing to differentiate their offerings, while companies such as Eco-Products, Inc. and Genpak, LLC emphasize customized solutions for foodservice and retail sectors.

Pactiv Evergreen Inc. and Earthpack have invested in expanding their regional footprints, targeting growth in North America and Europe. Sabert Corporation strengthens its position through technological advancements in material science and eco-design. Competitive advantages are increasingly tied to compliance with stringent environmental regulations, material innovation, and sustainable supply chains.

Startups and smaller manufacturers are emerging with novel plant-based materials and circular economy models, challenging incumbents with disruptive technologies and business models. The rising demand for sustainable packaging is driving mergers, acquisitions, and strategic partnerships aimed at expanding product lines and geographic reach. Overall, market leadership will depend on agility in innovation, regulatory adaptation, and the ability to scale sustainable production cost-effectively.

Top Eco Bowls Companies

  • Mondi Group
  • Crown Holdings
  • Huhtamaki Oyj
  • Biopak
  • Vegware
  • Eco-Products, Inc.
  • Genpak, LLC
  • Pactiv Evergreen Inc.
  • Earthpack
  • Sabert Corporation

Report Scope Table

Metric Details
Market Coverage Global Eco Bowls Market including North America, Latin America, Western Europe, Eastern Europe, East Asia, South Asia & Pacific, Middle East & Africa
Market Segmentation By Product Type: Single-Use Eco Bowls, Reusable Eco Bowls, Compostable Eco Bowls, Biodegradable Eco BowlsBy Material: Bamboo, Sugarcane Bagasse, Palm Leaves, Wood Pulp, Recycled Paper, PLA(Polylactic Acid), Cornstarch -based Materials, Coconut Shells, Other Plant-Based MaterialsBy End-Use Industry: Food & Beverage Industry, Catering & Event Services, Retail & E-commerce, Healthcare & Pharmaceuticals, Personal Care & Cosmetics
Base Year 2025
Forecast Period 2025 to 2035
Market Value Units USD Million
Research Type Secondary research, market forecasts, competitive landscape, country analysis
Key Players Covered Mondi Group, Crown Holdings, Huhtamaki Oyj, Biopak, Vegware, Eco-Products, Inc., Genpak, LLC, Pactiv Evergreen Inc., Earthpack, Sabert Corporation

Key Segments

By Material:

  • Bamboo
  • Sugarcane Bagasse
  • Palm Leaves
  • Wood Pulp
  • Recycled Paper
  • PLA (Polylactic Acid)
  • Cornstarch-based Materials
  • Coconut Shells
  • Other Plant-Based Materials

By Type:

  • Single-Use Eco Bowls
  • Reusable Eco Bowls
  • Compostable Eco Bowls
  • Biodegradable Eco Bowls

By End-Use Industry:

  • Food & Beverage Industry
  • Catering & Event Services
  • Retail & E-commerce
  • Healthcare & Pharmaceuticals
  • Personal Care & Cosmetics

By Region:

  • North America
  • Latin America
  • Europe
  • East Asia
  • South Asia
  • Oceania
  • MEA

Table of Content

  1. Executive Summary
    • Global Market Outlook
    • Demand-side Trends
    • Supply-side Trends
    • Technology Roadmap Analysis
    • Analysis and Recommendations
  2. Market Overview
    • Market Coverage/Taxonomy
    • Market Definition/Scope/Limitations
  3. Market Background
    • Market Dynamics
      • Drivers
      • Restraints
      • Opportunity
      • Trends
    • Scenario Forecast
      • Demand in Optimistic Scenario
      • Demand in Likely Scenario
      • Demand in Conservative Scenario
    • Opportunity Map Analysis
    • Product Life Cycle Analysis
    • Supply Chain Analysis
      • Supply Side Participants and their Roles
        • Producers
        • Mid-Level Participants (Traders/ Agents/ Brokers)
        • Wholesalers and Distributors
      • Value Added and Value Created at Node in the Supply Chain
      • List of Raw Material Suppliers
      • List of Existing and Potential Buyer’s
    • Investment Feasibility Matrix
    • Value Chain Analysis
      • Profit Margin Analysis
      • Wholesalers and Distributors
      • Retailers
    • PESTLE and Porter’s Analysis
    • Regulatory Landscape
      • By Key Regions
      • By Key Countries
    • Regional Parent Market Outlook
    • Production and Consumption Statistics
    • Import and Export Statistics
  4. Global Market Analysis 2020-2024 and Forecast, 2025-2035
    • Historical Market Size Value (USD Billion) & Volume (Metric Tons) Analysis, 2020-2024
    • Current and Future Market Size Value (USD Billion) & Volume (Metric Tons) Projections, 2025-2035
      • Y-o-Y Growth Trend Analysis
      • Absolute $ Opportunity Analysis
  5. Global Market Pricing Analysis 2020-2024 and Forecast 2025-2035
  6. Global Market Analysis 2020-2024 and Forecast 2025-2035, By Type
    • Introduction/Key Findings
    • Historical Market Size Value (USD Billion) & Volume (Metric Tons) Analysis By Type, 2020-2024
    • Current and Future Market Size Value (USD Billion) & Volume (Metric Tons) Analysis and Forecast By Type, 2025-2035
      • Single-Use Eco Bowls
      • Reusable Eco Bowls
      • Compostable Eco Bowls
      • Degradable Eco Bowls
    • Y-o-Y Growth Trend Analysis By Type, 2020-2024
    • Absolute $ Opportunity Analysis By Type, 2025-2035
  7. Global Market Analysis 2020-2024 and Forecast 2025-2035, By Material
    • Introduction/Key Findings
    • Historical Market Size Value (USD Billion) & Volume (Metric Tons) Analysis By Material, 2020-2024
    • Current and Future Market Size Value (USD Billion) & Volume (Metric Tons) Analysis and Forecast By Material, 2025-2035
      • Bamboo
      • Sugarcane Bagasse
      • Palm Leaves
      • Wood Pulp
      • Recycled Paper
      • PLA (Polylactic Acid)
      • Cornstarch-based Materials
      • Coconut Shells
      • Other Plant-Based Materials
    • Y-o-Y Growth Trend Analysis By Material, 2020-2024
    • Absolute $ Opportunity Analysis By Material, 2025-2035
  8. Global Market Analysis 2020-2024 and Forecast 2025-2035, By End-Use Industry
    • Introduction/Key Findings
    • Historical Market Size Value (USD Billion) & Volume (Metric Tons) Analysis By End-Use Industry, 2020-2024
    • Current and Future Market Size Value (USD Billion) & Volume (Metric Tons) Analysis and Forecast By End-Use Industry, 2025-2035
      • Food & Beverage Industry
      • Catering & Event Services
      • Retail & E-commerce
      • Healthcare & Pharmaceuticals
      • Personal Care & Cosmetics
    • Y-o-Y Growth Trend Analysis By End-Use Industry, 2020-2024
    • Absolute $ Opportunity Analysis By End-Use Industry, 2025-2035
  9. Global Market Analysis 2020-2024 and Forecast 2025-2035, By Region
    • Introduction
    • Historical Market Size Value (USD Billion) & Volume (Metric Tons) Analysis By Region, 2020-2024
    • Current Market Size Value (USD Billion) & Volume (Metric Tons) Analysis and Forecast By Region, 2025-2035
      • North America
      • Latin America
      • Western Europe
      • Eastern Europe
      • East Asia
      • South Asia & Pacific
      • Middle East and Africa
    • Market Attractiveness Analysis By Region
  10. North America Market Analysis 2020-2024 and Forecast 2025-2035, By Country
    • Historical Market Size Value (USD Billion) & Volume (Metric Tons) Trend Analysis By Market Taxonomy, 2020-2024
    • Market Size Value (USD Billion) & Volume (Metric Tons) Forecast By Market Taxonomy, 2025-2035
      • By Country
        • USA
        • Canada
        • Mexico
      • By Type
      • By Material
      • By End-Use Industry
    • Market Attractiveness Analysis
      • By Country
      • By Type
      • By Material
      • By End-Use Industry
    • Key Takeaways
  11. Latin America Market Analysis 2020-2024 and Forecast 2025-2035, By Country
    • Historical Market Size Value (USD Billion) & Volume (Metric Tons) Trend Analysis By Market Taxonomy, 2020-2024
    • Market Size Value (USD Billion) & Volume (Metric Tons) Forecast By Market Taxonomy, 2025-2035
      • By Country
        • Brazil
        • Argentina
        • Rest of LATAM
      • By Type
      • By Material
      • By End-Use Industry
    • Market Attractiveness Analysis
      • By Country
      • By Type
      • By Material
      • By End-Use Industry
    • Key Takeaways
  12. Western Europe Market Analysis 2020-2024 and Forecast 2025-2035, By Country
    • Historical Market Size Value (USD Billion) & Volume (Metric Tons) Trend Analysis By Market Taxonomy, 2020-2024
    • Market Size Value (USD Billion) & Volume (Metric Tons) Forecast By Market Taxonomy, 2025-2035
      • By Country
        • Germany
        • Italy
        • France
        • UK
        • Spain
        • BENELUX
        • Nordic
        • Rest of W.Europe
      • By Type
      • By Material
      • By End-Use Industry
    • Market Attractiveness Analysis
      • By Country
      • By Type
      • By Material
      • By End-Use Industry
    • Key Takeaways
  13. Eastern Europe Market Analysis 2020-2024 and Forecast 2025-2035, By Country
    • Historical Market Size Value (USD Billion) & Volume (Metric Tons) Trend Analysis By Market Taxonomy, 2020-2024
    • Market Size Value (USD Billion) & Volume (Metric Tons) Forecast By Market Taxonomy, 2025-2035
      • By Country
        • Russia
        • Hungary
        • Poland
        • Balkan & Baltics
        • Rest of E. Europe
      • By Type
      • By Material
      • By End-Use Industry
    • Market Attractiveness Analysis
      • By Country
      • By Type
      • By Material
      • By End-Use Industry
    • Key Takeaways
  14. East Asia Market Analysis 2020-2024 and Forecast 2025-2035, By Country
    • Historical Market Size Value (USD Billion) & Volume (Metric Tons) Trend Analysis By Market Taxonomy, 2020-2024
    • Market Size Value (USD Billion) & Volume (Metric Tons) Forecast By Market Taxonomy, 2025-2035
      • By Country
        • China
        • Japan
        • South Korea
      • By Type
      • By Material
      • By End-Use Industry
    • Market Attractiveness Analysis
      • By Country
      • By Type
      • By Material
      • By End-Use Industry
    • Key Takeaways
  15. South Asia & Pacific Market Analysis 2020-2024 and Forecast 2025-2035, By Country
    • Historical Market Size Value (USD Billion) & Volume (Metric Tons) Trend Analysis By Market Taxonomy, 2020-2024
    • Market Size Value (USD Billion) & Volume (Metric Tons) Forecast By Market Taxonomy, 2025-2035
      • By Country
        • India
        • Australia & New Zealand
        • ASEAN
        • Rest of SAP
      • By Type
      • By Material
      • By End-Use Industry
    • Market Attractiveness Analysis
      • By Country
      • By Type
      • By Material
      • By End-Use Industry
    • Key Takeaways
  16. Middle East and Africa Market Analysis 2020-2024 and Forecast 2025-2035, By Country
    • Historical Market Size Value (USD Billion) & Volume (Metric Tons) Trend Analysis By Market Taxonomy, 2020-2024
    • Market Size Value (USD Billion) & Volume (Metric Tons) Forecast By Market Taxonomy, 2025-2035
      • By Country
        • GCC Countries
        • Northern Africa
        • South Africa
        • Turkiye
        • Rest of MEA
      • By Type
      • By Material
      • By End-Use Industry
    • Market Attractiveness Analysis
      • By Country
      • By Type
      • By Material
      • By End-Use Industry
    • Key Takeaways
  17. Key Countries Market Analysis
    • USA
      • Pricing Analysis
      • Market Share Analysis, 2024
        • By Type
        • By Material
        • By End-Use Industry
    • Canada
      • Pricing Analysis
      • Market Share Analysis, 2024
        • By Type
        • By Material
        • By End-Use Industry
    • Brazil
      • Pricing Analysis
      • Market Share Analysis, 2024
        • By Type
        • By Material
        • By End-Use Industry
    • Mexico
      • Pricing Analysis
      • Market Share Analysis, 2024
        • By Type
        • By Material
        • By End-Use Industry
    • Argentina
      • Pricing Analysis
      • Market Share Analysis, 2024
        • By Type
        • By Material
        • By End-Use Industry
  18. Market Structure Analysis
    • Competition Dashboard
    • Competition Benchmarking
    • Market Share Analysis of Top Players
      • By Regional
      • By Type
      • By Material
      • By End-Use Industry
  19. Competition Analysis
    • Competition Deep Dive
      • Mondi Group
        • Overview
        • Product Portfolio
        • Profitability by Market Segments (Product/Age /Sales Channel/Region)
        • Sales Footprint
        • Strategy Overview
          • Marketing Strategy
          • Product Strategy
          • Channel Strategy
      • Crown Holdings
        • Overview
        • Product Portfolio
        • Profitability by Market Segments (Product/Age /Sales Channel/Region)
        • Sales Footprint
        • Strategy Overview
          • Marketing Strategy
          • Product Strategy
          • Channel Strategy
      • Huhtamaki Oyj
        • Overview
        • Product Portfolio
        • Profitability by Market Segments (Product/Age /Sales Channel/Region)
        • Sales Footprint
        • Strategy Overview
          • Marketing Strategy
          • Product Strategy
          • Channel Strategy
      • WestRock
        • Overview
        • Product Portfolio
        • Profitability by Market Segments (Product/Age /Sales Channel/Region)
        • Sales Footprint
        • Strategy Overview
          • Marketing Strategy
          • Product Strategy
          • Channel Strategy
      • Smurfit Kappa
        • Overview
        • Product Portfolio
        • Profitability by Market Segments (Product/Age /Sales Channel/Region)
        • Sales Footprint
        • Strategy Overview
          • Marketing Strategy
          • Product Strategy
          • Channel Strategy
      • Sonoco Products Company
        • Overview
        • Product Portfolio
        • Profitability by Market Segments (Product/Age /Sales Channel/Region)
        • Sales Footprint
        • Strategy Overview
          • Marketing Strategy
          • Product Strategy
          • Channel Strategy
      • Evergreen Packaging
        • Overview
        • Product Portfolio
        • Profitability by Market Segments (Product/Age /Sales Channel/Region)
        • Sales Footprint
        • Strategy Overview
          • Marketing Strategy
          • Product Strategy
          • Channel Strategy
      • Elopak
        • Overview
        • Product Portfolio
        • Profitability by Market Segments (Product/Age /Sales Channel/Region)
        • Sales Footprint
        • Strategy Overview
          • Marketing Strategy
          • Product Strategy
          • Channel Strategy
      • DS Smith
        • Overview
        • Product Portfolio
        • Profitability by Market Segments (Product/Age /Sales Channel/Region)
        • Sales Footprint
        • Strategy Overview
          • Marketing Strategy
          • Product Strategy
          • Channel Strategy
      • GWP Packaging
        • Overview
        • Product Portfolio
        • Profitability by Market Segments (Product/Age /Sales Channel/Region)
        • Sales Footprint
        • Strategy Overview
          • Marketing Strategy
          • Product Strategy
          • Channel Strategy
  20. Assumptions & Acronyms Used
  21. Research Methodology

List of Tables

  • Table 1: Global Market Value (USD Billion) Forecast by Region, 2020-2035
  • Table 2: Global Market Volume (Metric Tons) Forecast by Region, 2020-2035
  • Table 3: Global Market Value (USD Billion) Forecast by Type, 2020-2035
  • Table 4: Global Market Volume (Metric Tons) Forecast by Type, 2020-2035
  • Table 5: Global Market Value (USD Billion) Forecast by Material, 2020-2035
  • Table 6: Global Market Volume (Metric Tons) Forecast by Material, 2020-2035
  • Table 7: Global Market Value (USD Billion) Forecast by End-Use Industry, 2020-2035
  • Table 8: Global Market Volume (Metric Tons) Forecast by End-Use Industry, 2020-2035
  • Table 9: North America Market Value (USD Billion) Forecast by Country, 2020-2035
  • Table 10: North America Market Volume (Metric Tons) Forecast by Country, 2020-2035
  • Table 11: North America Market Value (USD Billion) Forecast by Type, 2020-2035
  • Table 12: North America Market Volume (Metric Tons) Forecast by Type, 2020-2035
  • Table 13: North America Market Value (USD Billion) Forecast by Material, 2020-2035
  • Table 14: North America Market Volume (Metric Tons) Forecast by Material, 2020-2035
  • Table 15: North America Market Value (USD Billion) Forecast by End-Use Industry, 2020-2035
  • Table 16: North America Market Volume (Metric Tons) Forecast by End-Use Industry, 2020-2035
  • Table 17: Latin America Market Value (USD Billion) Forecast by Country, 2020-2035
  • Table 18: Latin America Market Volume (Metric Tons) Forecast by Country, 2020-2035
  • Table 19: Latin America Market Value (USD Billion) Forecast by Type, 2020-2035
  • Table 20: Latin America Market Volume (Metric Tons) Forecast by Type, 2020-2035
  • Table 21: Latin America Market Value (USD Billion) Forecast by Material, 2020-2035
  • Table 22: Latin America Market Volume (Metric Tons) Forecast by Material, 2020-2035
  • Table 23: Latin America Market Value (USD Billion) Forecast by End-Use Industry, 2020-2035
  • Table 24: Latin America Market Volume (Metric Tons) Forecast by End-Use Industry, 2020-2035
  • Table 25: Western Europe Market Value (USD Billion) Forecast by Country, 2020-2035
  • Table 26: Western Europe Market Volume (Metric Tons) Forecast by Country, 2020-2035
  • Table 27: Western Europe Market Value (USD Billion) Forecast by Type, 2020-2035
  • Table 28: Western Europe Market Volume (Metric Tons) Forecast by Type, 2020-2035
  • Table 29: Western Europe Market Value (USD Billion) Forecast by Material, 2020-2035
  • Table 30: Western Europe Market Volume (Metric Tons) Forecast by Material, 2020-2035
  • Table 31: Western Europe Market Value (USD Billion) Forecast by End-Use Industry, 2020-2035
  • Table 32: Western Europe Market Volume (Metric Tons) Forecast by End-Use Industry, 2020-2035
  • Table 33: Eastern Europe Market Value (USD Billion) Forecast by Country, 2020-2035
  • Table 34: Eastern Europe Market Volume (Metric Tons) Forecast by Country, 2020-2035
  • Table 35: Eastern Europe Market Value (USD Billion) Forecast by Type, 2020-2035
  • Table 36: Eastern Europe Market Volume (Metric Tons) Forecast by Type, 2020-2035
  • Table 37: Eastern Europe Market Value (USD Billion) Forecast by Material, 2020-2035
  • Table 38: Eastern Europe Market Volume (Metric Tons) Forecast by Material, 2020-2035
  • Table 39: Eastern Europe Market Value (USD Billion) Forecast by End-Use Industry, 2020-2035
  • Table 40: Eastern Europe Market Volume (Metric Tons) Forecast by End-Use Industry, 2020-2035
  • Table 41: East Asia Market Value (USD Billion) Forecast by Country, 2020-2035
  • Table 42: East Asia Market Volume (Metric Tons) Forecast by Country, 2020-2035
  • Table 43: East Asia Market Value (USD Billion) Forecast by Type, 2020-2035
  • Table 44: East Asia Market Volume (Metric Tons) Forecast by Type, 2020-2035
  • Table 45: East Asia Market Value (USD Billion) Forecast by Material, 2020-2035
  • Table 46: East Asia Market Volume (Metric Tons) Forecast by Material, 2020-2035
  • Table 47: East Asia Market Value (USD Billion) Forecast by End-Use Industry, 2020-2035
  • Table 48: East Asia Market Volume (Metric Tons) Forecast by End-Use Industry, 2020-2035
  • Table 49: South Asia & Pacific Market Value (USD Billion) Forecast by Country, 2020-2035
  • Table 50: South Asia & Pacific Market Volume (Metric Tons) Forecast by Country, 2020-2035
  • Table 51: South Asia & Pacific Market Value (USD Billion) Forecast by Type, 2020-2035
  • Table 52: South Asia & Pacific Market Volume (Metric Tons) Forecast by Type, 2020-2035
  • Table 53: South Asia & Pacific Market Value (USD Billion) Forecast by Material, 2020-2035
  • Table 54: South Asia & Pacific Market Volume (Metric Tons) Forecast by Material, 2020-2035
  • Table 55: South Asia & Pacific Market Value (USD Billion) Forecast by End-Use Industry, 2020-2035
  • Table 56: South Asia & Pacific Market Volume (Metric Tons) Forecast by End-Use Industry, 2020-2035
  • Table 57: Middle East and Africa Market Value (USD Billion) Forecast by Country, 2020-2035
  • Table 58: Middle East and Africa Market Volume (Metric Tons) Forecast by Country, 2020-2035
  • Table 59: Middle East and Africa Market Value (USD Billion) Forecast by Type, 2020-2035
  • Table 60: Middle East and Africa Market Volume (Metric Tons) Forecast by Type, 2020-2035
  • Table 61: Middle East and Africa Market Value (USD Billion) Forecast by Material, 2020-2035
  • Table 62: Middle East and Africa Market Volume (Metric Tons) Forecast by Material, 2020-2035
  • Table 63: Middle East and Africa Market Value (USD Billion) Forecast by End-Use Industry, 2020-2035
  • Table 64: Middle East and Africa Market Volume (Metric Tons) Forecast by End-Use Industry, 2020-2035

List of Figures

  • Figure 1: Global Market Volume (Metric Tons) Forecast 2020-2035
  • Figure 2: Global Market Pricing Analysis
  • Figure 3: Global Market Value (USD Billion) Forecast 2020-2035
  • Figure 4: Global Market Value Share and BPS Analysis by Type, 2025 and 2035
  • Figure 5: Global Market Y-o-Y Growth Comparison by Type, 2025-2035
  • Figure 6: Global Market Attractiveness Analysis by Type
  • Figure 7: Global Market Value Share and BPS Analysis by Material, 2025 and 2035
  • Figure 8: Global Market Y-o-Y Growth Comparison by Material, 2025-2035
  • Figure 9: Global Market Attractiveness Analysis by Material
  • Figure 10: Global Market Value Share and BPS Analysis by End-Use Industry, 2025 and 2035
  • Figure 11: Global Market Y-o-Y Growth Comparison by End-Use Industry, 2025-2035
  • Figure 12: Global Market Attractiveness Analysis by End-Use Industry
  • Figure 13: Global Market Value (USD Billion) Share and BPS Analysis by Region, 2025 and 2035
  • Figure 14: Global Market Y-o-Y Growth Comparison by Region, 2025-2035
  • Figure 15: Global Market Attractiveness Analysis by Region
  • Figure 16: North America Market Incremental $ Opportunity, 2025-2035
  • Figure 17: Latin America Market Incremental $ Opportunity, 2025-2035
  • Figure 18: Western Europe Market Incremental $ Opportunity, 2025-2035
  • Figure 19: Eastern Europe Market Incremental $ Opportunity, 2025-2035
  • Figure 20: East Asia Market Incremental $ Opportunity, 2025-2035
  • Figure 21: South Asia & Pacific Market Incremental $ Opportunity, 2025-2035
  • Figure 22: Middle East and Africa Market Incremental $ Opportunity, 2025-2035
  • Figure 23: North America Market Value Share and BPS Analysis by Country, 2025 and 2035
  • Figure 24: North America Market Value Share and BPS Analysis by Type, 2025 and 2035
  • Figure 25: North America Market Y-o-Y Growth Comparison by Type, 2025-2035
  • Figure 26: North America Market Attractiveness Analysis by Type
  • Figure 27: North America Market Value Share and BPS Analysis by Material, 2025 and 2035
  • Figure 28: North America Market Y-o-Y Growth Comparison by Material, 2025-2035
  • Figure 29: North America Market Attractiveness Analysis by Material
  • Figure 30: North America Market Value Share and BPS Analysis by End-Use Industry, 2025 and 2035
  • Figure 31: North America Market Y-o-Y Growth Comparison by End-Use Industry, 2025-2035
  • Figure 32: North America Market Attractiveness Analysis by End-Use Industry
  • Figure 33: Latin America Market Value Share and BPS Analysis by Country, 2025 and 2035
  • Figure 34: Latin America Market Value Share and BPS Analysis by Type, 2025 and 2035
  • Figure 35: Latin America Market Y-o-Y Growth Comparison by Type, 2025-2035
  • Figure 36: Latin America Market Attractiveness Analysis by Type
  • Figure 37: Latin America Market Value Share and BPS Analysis by Material, 2025 and 2035
  • Figure 38: Latin America Market Y-o-Y Growth Comparison by Material, 2025-2035
  • Figure 39: Latin America Market Attractiveness Analysis by Material
  • Figure 40: Latin America Market Value Share and BPS Analysis by End-Use Industry, 2025 and 2035
  • Figure 41: Latin America Market Y-o-Y Growth Comparison by End-Use Industry, 2025-2035
  • Figure 42: Latin America Market Attractiveness Analysis by End-Use Industry
  • Figure 43: Western Europe Market Value Share and BPS Analysis by Country, 2025 and 2035
  • Figure 44: Western Europe Market Value Share and BPS Analysis by Type, 2025 and 2035
  • Figure 45: Western Europe Market Y-o-Y Growth Comparison by Type, 2025-2035
  • Figure 46: Western Europe Market Attractiveness Analysis by Type
  • Figure 47: Western Europe Market Value Share and BPS Analysis by Material, 2025 and 2035
  • Figure 48: Western Europe Market Y-o-Y Growth Comparison by Material, 2025-2035
  • Figure 49: Western Europe Market Attractiveness Analysis by Material
  • Figure 50: Western Europe Market Value Share and BPS Analysis by End-Use Industry, 2025 and 2035
  • Figure 51: Western Europe Market Y-o-Y Growth Comparison by End-Use Industry, 2025-2035
  • Figure 52: Western Europe Market Attractiveness Analysis by End-Use Industry
  • Figure 53: Eastern Europe Market Value Share and BPS Analysis by Country, 2025 and 2035
  • Figure 54: Eastern Europe Market Value Share and BPS Analysis by Type, 2025 and 2035
  • Figure 55: Eastern Europe Market Y-o-Y Growth Comparison by Type, 2025-2035
  • Figure 56: Eastern Europe Market Attractiveness Analysis by Type
  • Figure 57: Eastern Europe Market Value Share and BPS Analysis by Material, 2025 and 2035
  • Figure 58: Eastern Europe Market Y-o-Y Growth Comparison by Material, 2025-2035
  • Figure 59: Eastern Europe Market Attractiveness Analysis by Material
  • Figure 60: Eastern Europe Market Value Share and BPS Analysis by End-Use Industry, 2025 and 2035
  • Figure 61: Eastern Europe Market Y-o-Y Growth Comparison by End-Use Industry, 2025-2035
  • Figure 62: Eastern Europe Market Attractiveness Analysis by End-Use Industry
  • Figure 63: East Asia Market Value Share and BPS Analysis by Country, 2025 and 2035
  • Figure 64: East Asia Market Value Share and BPS Analysis by Type, 2025 and 2035
  • Figure 65: East Asia Market Y-o-Y Growth Comparison by Type, 2025-2035
  • Figure 66: East Asia Market Attractiveness Analysis by Type
  • Figure 67: East Asia Market Value Share and BPS Analysis by Material, 2025 and 2035
  • Figure 68: East Asia Market Y-o-Y Growth Comparison by Material, 2025-2035
  • Figure 69: East Asia Market Attractiveness Analysis by Material
  • Figure 70: East Asia Market Value Share and BPS Analysis by End-Use Industry, 2025 and 2035
  • Figure 71: East Asia Market Y-o-Y Growth Comparison by End-Use Industry, 2025-2035
  • Figure 72: East Asia Market Attractiveness Analysis by End-Use Industry
  • Figure 73: South Asia & Pacific Market Value Share and BPS Analysis by Country, 2025 and 2035
  • Figure 74: South Asia & Pacific Market Value Share and BPS Analysis by Type, 2025 and 2035
  • Figure 75: South Asia & Pacific Market Y-o-Y Growth Comparison by Type, 2025-2035
  • Figure 76: South Asia & Pacific Market Attractiveness Analysis by Type
  • Figure 77: South Asia & Pacific Market Value Share and BPS Analysis by Material, 2025 and 2035
  • Figure 78: South Asia & Pacific Market Y-o-Y Growth Comparison by Material, 2025-2035
  • Figure 79: South Asia & Pacific Market Attractiveness Analysis by Material
  • Figure 80: South Asia & Pacific Market Value Share and BPS Analysis by End-Use Industry, 2025 and 2035
  • Figure 81: South Asia & Pacific Market Y-o-Y Growth Comparison by End-Use Industry, 2025-2035
  • Figure 82: South Asia & Pacific Market Attractiveness Analysis by End-Use Industry
  • Figure 83: Middle East and Africa Market Value Share and BPS Analysis by Country, 2025 and 2035
  • Figure 84: Middle East and Africa Market Value Share and BPS Analysis by Type, 2025 and 2035
  • Figure 85: Middle East and Africa Market Y-o-Y Growth Comparison by Type, 2025-2035
  • Figure 86: Middle East and Africa Market Attractiveness Analysis by Type
  • Figure 87: Middle East and Africa Market Value Share and BPS Analysis by Material, 2025 and 2035
  • Figure 88: Middle East and Africa Market Y-o-Y Growth Comparison by Material, 2025-2035
  • Figure 89: Middle East and Africa Market Attractiveness Analysis by Material
  • Figure 90: Middle East and Africa Market Value Share and BPS Analysis by End-Use Industry, 2025 and 2035
  • Figure 91: Middle East and Africa Market Y-o-Y Growth Comparison by End-Use Industry, 2025-2035
  • Figure 92: Middle East and Africa Market Attractiveness Analysis by End-Use Industry
  • Figure 93: Global Market - Tier Structure Analysis
  • Figure 94: Global Market - Company Share Analysis

Frequently Asked Questions

What is the projected market size of the Eco Bowls Market by 2035?

The Eco Bowls Market is expected to reach approximately USD 1.94 billion by 2035, growing at a CAGR of 6.1% from 2025 to 2035.

Which material segment holds the largest share in the Eco Bowls Market?

Bioplastics lead the material segment, accounting for 42% of the market share in 2025.

What are the key product types in the Eco Bowls Market?

The main product types include Single-Use Eco Bowls, Reusable Eco Bowls, Compostable Eco Bowls, and Biodegradable Eco Bowls.

Which regions show the highest growth rates in the Eco Bowls Market?

The USA leads with a CAGR of 6.3%, followed by Japan at 6.2%, the European Union at 6.0%, and the UK at 5.9%.

Who are the leading companies in the Eco Bowls Market?

Key players include Mondi Group, Crown Holdings, Huhtamaki Oyj, Biopak, Vegware, Eco-Products, Inc., and Genpak, LLC among others.

Explore Similar Insights

Future Market Insights

Eco Bowls Market