Eco-Friendly Inks Market Size and Share Forecast Outlook 2025 to 2035

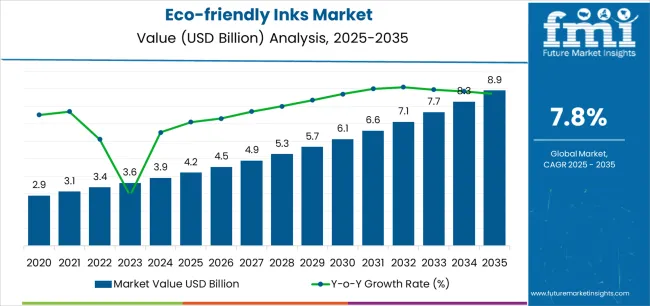
The global eco-friendly inks market is projected to grow steadily, with its valuation expected to rise from approximately USD 5.10 billion in 2025 to nearly USD 8.98 billion by 2035. This growth corresponds to a CAGR of 5.8% over the forecast period.

The increasing demand for sustainable and environmentally responsible printing solutions is the primary driver propelling market expansion. Eco-friendly inks offer a non-toxic, biodegradable, and renewable alternative to conventional petroleum-based inks, aligning with global efforts to reduce environmental pollution and promote circular economy principles.

Eco-friendly inks are derived from renewable sources such as soy, vegetable oils, and water-based solvents, which contribute to lower volatile organic compound (VOC) emissions and reduced carbon footprints. These inks help improve air quality and facilitate recycling, making them highly favored by environmentally conscious brands, publishers, and packaging manufacturers. Regulatory pressures and growing consumer preference for sustainable products are further accelerating market adoption.

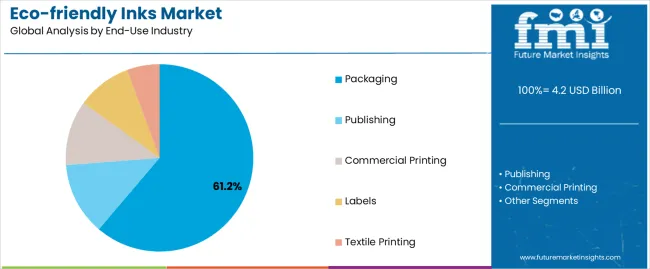
The printing industry’s transition toward eco-friendly inks is supported by increasing government endorsements and industry standards promoting greener practices. Packaging and label printing segments exhibit significant growth potential, as companies seek sustainable alternatives to meet consumer demand and comply with environmental regulations. Additionally, the commercial printing sector is gradually shifting to water-based and soy-based inks to reduce harmful chemical usage.

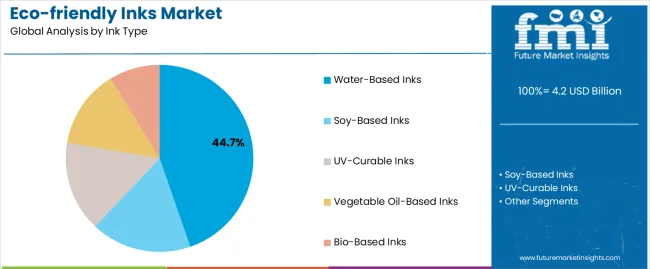
Market segmentation highlights various ink types including soy-based, vegetable oil-based, and water-based inks. Soy-based inks dominate due to their superior print quality, drying efficiency, and environmental benefits. Water-based inks are preferred in applications requiring low toxicity and easy clean-up, such as food packaging and textiles. Vegetable oil-based inks are gaining traction as versatile options compatible with diverse printing technologies.

In March 2024, Sun Chemical introduced the Streamline SGR ink series, designed for super-wide-format inkjet presses using Ricoh Gen 5 printheads. This eco-solvent ink is optimized for high-speed printing and offers low odor emissions, earning GREENGUARD Gold certification. The Streamline SGR series is tailored for applications in the sign, display, and graphics markets, providing a sustainable solution for large-format printing needs.

Sustainability remains a critical focus, with manufacturers investing in research to develop inks that enhance recyclability and reduce environmental impact throughout their lifecycle. Innovations in biodegradable pigments and renewable raw materials are advancing the market’s eco-friendly credentials.

Challenges such as higher costs compared to conventional inks and compatibility issues with certain printing equipment may restrain growth in some segments. Nonetheless, ongoing technological improvements and increased environmental consciousness are expected to drive sustained market momentum.

Metric Value
Market Size in 2025 USD 5.10 Billion
Projected Market Size in 2035 USD 8.98 Billion
CAGR (2025 to 2035) 5.8%

Analyzing Eco-Friendly Ink Market by Top Investment Segments

Water-Based Inks Lead with Safety and Versatility

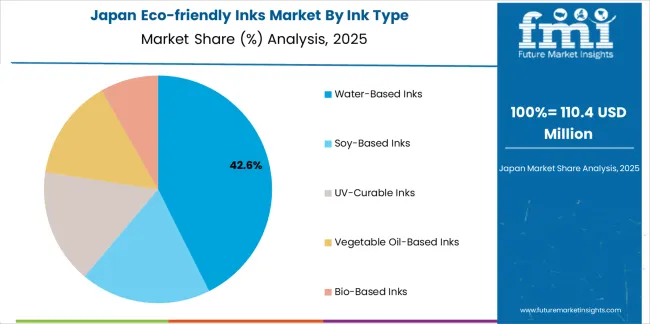
Water-based inks are projected to command a significant market share of approximately 52% in 2025, leading the eco-friendly ink segment due to their low toxicity, environmental benefits, and broad application across packaging, textile, and paper industries. These inks emit low levels of volatile organic compounds (VOCs), aligning with global regulatory mandates and growing consumer demand for sustainable printing solutions.

Manufacturers have advanced water-based ink formulations to improve water resistance, drying speed, and pigment richness, enhancing print quality and durability. Their ease of cleanup and non-flammability make them safer and more practical for diverse industrial settings. Additionally, governmental incentives promoting sustainable manufacturing practices further fuel their adoption.

The ability to produce food-safe prints broadens their use in packaging, supporting expanding markets for eco-conscious consumer goods. Innovations in binder technologies and compatibility with various substrates increase their versatility, making water-based inks the preferred choice for environmentally sensitive applications. With sustainability increasingly prioritized across industries, water-based inks are expected to maintain robust growth and dominate the market throughout the forecast period.

UV-Curable and Soy-Based Inks Complement Eco-Ink Growth

Although water-based inks dominate, UV-curable and soy-based inks are significant contributors, collectively holding around 35% market share in 2025. UV-curable inks are prized for their rapid drying times, exceptional durability, and strong chemical resistance, making them ideal for industrial and high-quality printing applications. Their ability to cure instantly under UV light enhances production efficiency and print quality, which is especially valuable in packaging and commercial printing sectors.

Soy-based inks, derived from renewable plant oils, provide biodegradability and vibrant color reproduction, attracting environmentally conscious brands looking to reduce their carbon footprint. These inks also offer improved recyclability of printed materials, aligning with circular economy principles. Both segments benefit from growing consumer demand for sustainable and non-toxic printing alternatives that minimize environmental impact.

Manufacturers continue to innovate by enhancing multi-substrate compatibility, ensuring these inks perform well on diverse materials such as plastics, paper, and textiles. Additionally, eco-friendly cartridge and packaging solutions are gaining popularity, supporting the sustainability narrative. Together, UV-curable and soy-based inks enrich the eco-ink market, fostering a diversified and greener future for the printing industry.

Regional Market Trends

Asia-Pacific

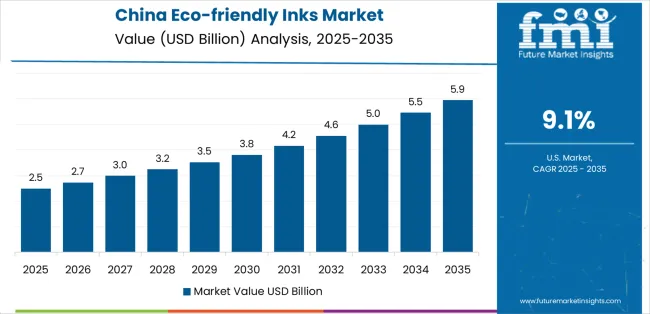
With the growing manufacturing, rapid urbanization, and increased sensitivity of people towards environmental protection, it is expected that the Asia-Pacific region will hold the largest share in the eco-friendly inks market. China, India, and Japan are similar investments for food packaging, textiles, and consumer products using environmentally sustainable printing.

The various government initiatives encouraging eco-compliance and emissions control in industries have spurred their acceptance. Regional players are also introducing high-performance inks at competitive prices which can be used in flexographic and gravure applications. Universities and research institutes across the region are collaborating with industry to develop algae-based and bio-derived ink alternatives.

The moving trend of the packaging industry towards compostable and recyclable substrates is also accelerating eco-ink adoption. Local start-ups are coming up with solutions for customized inks meeting regional material needs. Likewise, the trade policies promoting green technology adoption further bolster regional momentum for sustainable printing practice.

North America

The North American market for eco-friendly inks has become standard, given consumer preference for green products, stringent regulations, and corporate sustainability programs. Food-grade packaging, publishing, and digital printing in the USA and Canada concentrate on low-VOC and bio-renewable ink alternatives.

UV-curable and water-based inks and associated technologies are becoming more popular in the region. Demand is also being driven by rapid growth in e-commerce and sustainable label printing. Government grants and tax incentives are available in the region to bolster research and development projects on green inks.

Print service providers are investing in energy-efficient and solvent-free printing solutions. In North America, universities are collaborating with manufacturers of inks on innovations in renewable materials. Consumer demand for biodegradable inks for children's books and educational content is emerging as a niche growth area.

Europe

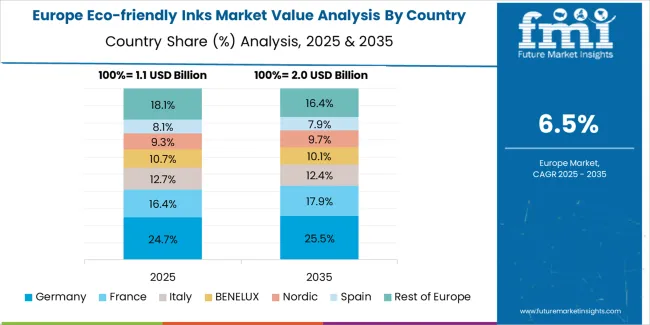
Strengthened by its preeminence in environmental policies and high-prestige print demands, Europe will remain the leader. Of these, Germany, the UK, and France promote vegetable and water-soluble inks, paving the way for better compliance with the REACH and circular economy headlines spelled out in the EU.

The increase in demand for compostable packaging, sustainable paper materials, and eco-certified products is also driving ink innovation in various segments. National green and printing ink procurement guidelines are increasingly causing dramatic changes to government printing contracts all around. European printing houses are cooperating with biopolymer developers, improving opportunities for synergy between ink substrate interactions.

The cradle-to-cradle certification has been gaining interest from premium packaging brands from year to year. Start-ups in the region are launching production of algae-based inks with strong environmental sustainability narratives. Demand in this case for low-toxicity, high-aesthetic inks from luxury publishing and design houses also fuels innovation momentum.

Challenges and Opportunities in the Eco-Friendly Inks Market

Challenges

Higher production costs and performance trade-offs

Eco-friendly inks can be costlier to produce and may face challenges in drying speed, substrate compatibility, or color vibrancy compared to conventional inks. Maintaining print performance while using sustainable materials remains a key industry hurdle. Standardizing eco-criteria and certifications across regions adds further complexity.

Opportunities

Expansion of bio-based and smart ink technologies

The rise of biodegradable and algae-based inks, along with innovations in conductive and thermochromic ink formulations, offers exciting opportunities. Customizable, eco-conscious inks that perform across a variety of substrates are gaining traction in packaging and promotional printing. As print-on-demand and digital workflows grow, demand for low-impact inks with fast-curing capabilities will increase.

Shifts in the Eco-Friendly Inks Market from 2020 to 2024 and Future Trends 2025 to 2035

The market reflected slow growth over the years, amidst a heightened interest in sustainable printing and post-pandemic changes in supply chains wherein cost barriers and limited formulation diversity hampered a steady adoption of practices between 2020 and 2024.

The period between 2025 and 2035 will charge forward on the basis of technology advancements and sustainability mandates. These will then boost new innovations in the areas of increased automation in ink manufacturing, AI-assisted color management, and inks that may be compatible with renewable packaging substrates.

Synergies would provide a plastic print ecosystem among ink manufacturers, packaging converters, and brand owners through strategic partnerships. The sudden increase of demand for compostable inks used in single-use packaging will be substantial, especially in the food and e-commerce sectors.

Advances in solvent-free ink chemistries will continue making inks safer and complying more with international standards. Consumers will become more informed about eco-labeling in differentiating brands and making purchasing decisions.

Market Shifts: A Comparative Analysis 2020 to 2024 vs. 2025 to 2035

Market Shift 2020 to 2024 Trends
Regulatory Landscape Rising adoption of low-VOC inks and eco-labeling guidelines.
Material and Ink Innovations Soy and water-based inks gained traction.
Industry Adoption Focused on packaging, commercial printing, and publications.
Market Competition Dominated by traditional ink producers expanding sustainable lines.
Market Growth Drivers Demand for sustainable packaging and print quality improvements.
Sustainability and Environmental Impact Transition to safer, recyclable inks with limited environmental scope.
Integration of AI and Process Optimization Basic color calibration tools and digital prepress workflows.
Advancements in Printing Technology Use of flexographic and offset printing with eco-friendly inks.
Market Shift 2025 to 2035 Projections
Regulatory Landscape Global harmonization of eco-certifications, mandatory VOC thresholds, and incentives for bio-renewable ink use.
Material and Ink Innovations Growth of algae-based, biodegradable, and smart inks with anti-counterfeit or responsive features.
Industry Adoption Widespread adoption in textiles, 3D printing, food contact surfaces, and digital packaging.
Market Competition Rise of specialized eco-ink startups , mergers with green material developers, and rapid innovation across print technologies.
Market Growth Drivers Demand driven by climate targets, zero-waste packaging, e-commerce expansion, and sustainable branding initiatives.
Sustainability and Environmental Impact Broad integration of carbon-neutral, non-toxic inks aligned with circular economy and ESG reporting frameworks.
Integration of AI and Process Optimization Full-scale AI integration in color matching, automated ink formulation, and predictive performance analysis for sustainability-focused print runs.
Advancements in Printing Technology Shift toward digital, inkjet, and hybrid presses using fast-curing, low-impact inks tailored for diverse packaging and textile applications.

Country-wise Outlook

United States

With increasing need for green printing solutions in packaging, publishing, and commercial printing, USA leads the eco-friendly inks market. Manufacturers are developing soy, water-based, and UV-curable inks to fulfill environmental standards and consumers' expectations. Transition toward low-VOC and biodegradable inks correlates with federal sustainability mandates and green certifications for production.

Companies are investing in plant-derived pigments, recyclable ink systems, and energy-efficient curing processes to lower carbon footprints. With brands prioritizing compostable packaging and clean-label printing, eco-friendly inks are increasingly gaining use in the food, beverage, and pharmaceutical industries.

Furthermore, to further reduce dependence on petrochemicals, binders for inks based on bio-resources are being introduced by manufacturers. These companies are also developing closed-loop ink recycling solutions to minimize waste and operational costs. In addition, development in digital printing is making it possible for eco-friendly inks to be used for high-speed and quick-turnaround printing jobs.

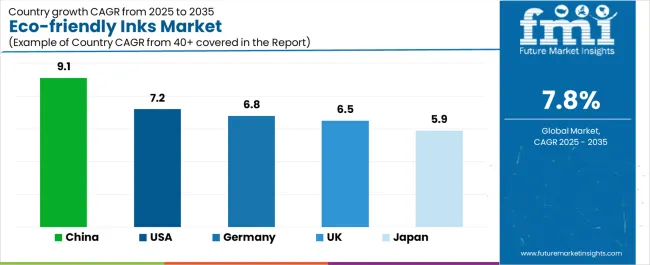
Country CAGR (2025 to 2035)
United States 7.1%

United Kingdom

As regulatory bodies pull in one direction and consumers in the opposite, UK markets for eco-friendly inks are growing at a steady pace. The imposition of government policies with respect to the reduction of plastics and the implementation of circular economy practices serve to further validate the acceptance of non-toxic biodegradable ink formulations.

Flexible packaging and label printing are getting the support of algae-inks, water-based flexographic inks, and low-emission UV inks with another touch of increased interest. Compostable packaging printed with sustainable inks is gaining increased preference among retailers and food brands as a branding strategy to appeal to eco-conscious consumers. UK deinking technology innovations and closed-loop ink systems are other supportive factors for sustainability in the market.

Manufacturers are also investing in renewable binder technologies to improve performance and to reduce the reliance on petrochemicals. Companies are exploring features like smart inks with properties such as heat-activated color change for freshness indicators. The UK carbon labeling trend is making its own calls for the development of inks that provide quantified data on environmental impacts.

Country CAGR (2025 to 2035)
United Kingdom 6.8%

Japan

The eco-friendly inks market in Japan is entirely reliant on innovative products, strict quality standards, and careful observation of environmental standards. The manufacturers have their primary focus on rice bran oil inks, non-solvent offset formulations, and biodegradable water-based inks, designed specifically for high-end publishing and packaging applications.

Micro-emulsion technology and renewable resource-based pigments are functionalities adopted by these corporations to better their prints while minimizing environmental impact. The increasing demand for recyclable, food-safe, and low-odor inks has enabled Japanese firms to spearhead the development of multifunctional eco-inks compatible with high-speed digital and traditional presses.

Smart packaging trends and functional printing also further push R&D in sustainable ink technologies. In addition, photodegradable inks are being studied to support end-of-life compostability. Moreover, businesses are investing in hybrid ink systems that are both bio-based and energy-curable. The latest trend, however, is in the use of AI-driven formulation platforms emerging for optimizing ink recipes in terms of precision and sustainability.

Country CAGR (2025 to 2035)
Japan 6.6%

South Korea

The eco-inks sector in South Korea is fast expanding with dynamic industries like printing, packaging, and electronics. Firms are producing energy-curable, heavy-metal-free, and water-based inks for a good range of substrates-paper, plastic, and textiles. The government incentives put in place to promote low-carbon manufacturing and the use of non-toxic materials catalyze the transition to sustainable inks.

Companies are investigating graphene-enhanced ink systems, pigments from soy protein, and compostable inks components. The growth of e-commerce packaging, digital printing, and sustainable textiles is driving innovation in South Korea's eco-inks sector.

Besides, companies are also investing in AI-powered color calibration tools to enhance color consistency and minimize waste. Developments in nanotechnology-based pigments will see improvements in durability and eco-efficiency. Finally, partnerships with academic institutions are enhancing R&D with regard to next-generation biodegradable ink systems.

Country CAGR (2025 to 2035)
South Korea 6.9%

Competitive Outlook

The green inks market is fueled by applications in packaging, textile, publishing, and commercial print markets. Major players are making investments in green chemistry, zero-waste ink manufacturing, and digital press-compatible products. Major trends include increasing adoption of water-based inks in flexo printing, biodegradable ink cartridges, and bio-resin binder systems.

Furthermore, public-private partnership sustainability collaborations and regulatory policies are driving a robust innovation pipeline. Startups are launching with groundbreaking plant-based ink technologies that will serve niche print applications.

Closed-loop ink recovery systems are also being invested in by brand owners to cut total waste. Furthermore, industry expositions and conferences are fostering inter-sectoral cooperation to push forward green ink utilization.

Market Share Analysis by Company

Company Name Estimated Market Share (%)
Sun Chemical Corporation 12-16%
Flint Group 9-13%
Siegwerk Druckfarben 7-11%
Toyo Ink SC Holdings 5-9%
INX International Ink Co. 4-7%
Other Companies 51-61%

Key Company Offerings and Activities

Company Name Key Offerings/Activities
Sun Chemical Corporation Offers soy-based and water-based inks with Cradle-to-Cradle certification.
Flint Group Develops VOC-free flexographic and gravure eco-inks for food-safe and packaging uses.
Siegwerk Druckfarben Specializes in UV LED-curable, migration-optimized inks for sustainable packaging.
Toyo Ink SC Holdings Innovates with plant-derived pigment systems and low-energy drying technologies.
INX International Ink Co. Focuses on bio-renewable content inks and digital eco-inks for commercial applications.

Key Company Insights

Sun Chemical Corporation (12-16%)

Leader in sustainable ink development, offering wide-format and food-compliant inks.

Flint Group (9-13%)

Strong portfolio of VOC-free and biodegradable inks for flexible packaging.

SiegwerkDruckfarben (7-11%)

Pioneers in safe-to-eat inks and circular ink lifecycle solutions.

Toyo Ink SC Holdings (5-9%)

Develops vegetable oil-based, fast-drying inks with reduced carbon footprint.

INX International Ink Co. (4-7%)

Innovates with soy and bio-solvent inks for offset and digital printing.

Other Key Players (51-61% Combined):Include:

  • Hubergroup: Specializes in mineral oil-free inks and LED-curable formulations.
  • Nazdar Ink Technologies: Offers low-VOC digital printing inks for signage and packaging.
  • DIC Corporation: Focuses on eco-compatible gravure and flexo inks.
  • Altana AG: Develops water-based metallic inks with low environmental impact.
  • Doneck Euroflex: Produces bio-based, compostable inks for corrugated and flexible packaging.

Report Scope Table - Eco-Friendly Inks Market

Report Attributes Details
Current Total Market Size (2025) USD 5.10 billion
Projected Market Size (2035) USD 8.98 billion
CAGR (2025 to 2035) 5.8%
Base Year for Estimation 2024
Historical Period 2020 to 2024
Projections Period 2025 to 2035
Quantitative Units USD billion for value
Ink Types Analyzed (Segment 1) Water-Based, UV-Curable, Soy-Based, Algae-Based, Bio-Resins
Applications Covered (Segment 2) Packaging, Textiles, Publishing, Commercial Printing
Regions Covered North America; Latin America; Western Europe; Eastern Europe; South Asia & Pacific; East Asia; Middle East & Africa
Countries Covered United States, Canada, United Kingdom, Germany, France, China, India, Japan, South Korea, Australia
Key Players Influencing the Market Sun Chemical, Flint Group, Siegwerk Druckfarben, Toyo Ink SC Holdings, INX International Ink Co., Hubergroup, Nazdar Ink Technologies, DIC Corporation, Altana AG, Doneck Euroflex
Additional Attributes Dollar sales by ink type (Water-based vs UV-curable), regional regulatory impacts, advancements in bio-based inks, AI-enabled formulation, packaging trends driving ink demand
Customization and Pricing Customization and Pricing Available on Request

Key Segmentation

By Color:

  • Four Color
  • Monochrome Printing

By Origin of Bio Pigments:

  • Flint Ink
  • Algae Inks
  • Animal Origin
  • Vegetable-based Ink

By Type:

  • Gums
  • Resins
  • Waxes
  • Solvent-based
  • Water-based
  • Oil-based

By Printing:

  • Flexography
  • Lithography
  • Gravure
  • Offset
  • Screen Printing
  • Digital

By Packaging:

  • Food & Beverage
  • Pharmaceutical & Medical Devices
  • Consumer Goods
  • Others

By Region:

  • North America
  • Latin America
  • East Asia
  • South Asia & Pacific
  • Eastern Europe
  • Western Europe
  • Middle East & Africa

Table of Content

  1. Executive Summary
  2. Industry Introduction, including Taxonomy and Market Definition
  3. Market Trends and Success Factors, including, Macro-economic Factors, Market Dynamics, Recent Industry Developments
  4. Global Market Demand Analysis 2020 to 2024 and Forecast 2025 to 2035, including Historical Analysis and Future Projections
  5. Global Market Analysis 2020 to 2024 and Forecast 2025 to 2035
    • Color
    • Origin of Bio Pigments
    • Type
    • Printing
    • Packaging
  6. Global Market Analysis 2020 to 2024 and Forecast 2025 to 2035, By Color
    • Four Color
    • Monochrome Printing
  7. Global Market Analysis 2020 to 2024 and Forecast 2025 to 2035, By Origin of Bio Pigments
    • Flint Ink
    • Algae Inks
    • Animal Origin
    • Vegetable-based Ink
  8. Global Market Analysis 2020 to 2024 and Forecast 2025 to 2035, By Type
    • Gums
    • Resins
    • Waxes
    • Solvent-based
    • Water-based
    • Oil-based
  9. Global Market Analysis 2020 to 2024 and Forecast 2025 to 2035, By Printing
    • Flexography
    • Lithography
    • Gravure
    • Offset
    • Screen Printing
    • Digital
  10. Global Market Analysis 2020 to 2024 and Forecast 2025 to 2035, By Packaging
    • Food & Beverage
    • Pharmaceutical & Medical Devices
    • Consumer Goods
    • Others
  11. Global Market Analysis 2020 to 2024 and Forecast 2025 to 2035, By Region
    • North America
    • Latin America
    • East Asia
    • South Asia & Pacific
    • Eastern Europe
    • Western Europe
    • Middle East & Africa
  12. North America Sales Analysis 2020 to 2024 and Forecast 2025 to 2035, by Key Segments and Countries
  13. Latin America Sales Analysis 2020 to 2024 and Forecast 2025 to 2035, by Key Segments and Countries
  14. East Asia Sales Analysis 2020 to 2024 and Forecast 2025 to 2035, by Key Segments and Countries
  15. South Asia & Pacific Sales Analysis 2020 to 2024 and Forecast 2025 to 2035, by Key Segments and Countries
  16. Eastern Europe Sales Analysis 2020 to 2024 and Forecast 2025 to 2035, by Key Segments and Countries
  17. Western Europe Sales Analysis 2020 to 2024 and Forecast 2025 to 2035, by Key Segments and Countries
  18. Middle East & Africa Sales Analysis 2020 to 2024 and Forecast 2025 to 2035, by Key Segments and Countries
  19. Sales Forecast 2025 to 2035 by Color, Origin of Bio Pigments, and Type for 30 Countries
  20. Competition Outlook, including, Market Structure Analysis, Company Share Analysis by Key Players, Competition Dashboard
  21. Company Profile
    • Sun Chemical Corporation
    • Flint Group
    • Siegwerk Druckfarben
    • Toyo Ink SC Holdings
    • INX International Ink Co.
    • Hubergroup
    • Nazdar Ink Technologies
    • DIC Corporation
    • Altana AG
    • Doneck Euroflex

List of Tables

Table 01: Global Market Value (US$ Million) Forecast by Region, 2015 to 2032

Table 02: Global Market Volume (Units) Forecast by Region, 2015 to 2032

Table 03: Global Market Value (US$ Million) Forecast by Colour, 2015 to 2032

Table 04: Global Market Volume (Units) Forecast by Colour, 2015 to 2032

Table 05: Global Market Value (US$ Million) Forecast by Component Ink Type, 2015 to 2032

Table 06: Global Market Volume (Units) Forecast by Component Ink Type, 2015 to 2032

Table 07: Global Market Value (US$ Million) Forecast by Printing Process, 2015 to 2032

Table 08: Global Market Volume (Units) Forecast by Printing Process, 2015 to 2032

Table 09: Global Market Value (US$ Million) Forecast by Packaging Application, 2015 to 2032

Table 10: Global Market Volume (Units) Forecast by Packaging Application, 2015 to 2032

Table 11: Global Market Value (US$ Million) Forecast by Origin of Bio Pigments, 2015 to 2032

Table 12: Global Market Volume (Units) Forecast by Origin of Bio Pigments, 2015 to 2032

Table 13: North America Market Value (US$ Million) Forecast by Country, 2015 to 2032

Table 14: North America Market Volume (Units) Forecast by Country, 2015 to 2032

Table 15: North America Market Value (US$ Million) Forecast by Colour, 2015 to 2032

Table 16: North America Market Volume (Units) Forecast by Colour, 2015 to 2032

Table 17: North America Market Value (US$ Million) Forecast by Component Ink Type, 2015 to 2032

Table 18: North America Market Volume (Units) Forecast by Component Ink Type, 2015 to 2032

Table 19: North America Market Value (US$ Million) Forecast by Printing Process, 2015 to 2032

Table 20: North America Market Volume (Units) Forecast by Printing Process, 2015 to 2032

Table 21: North America Market Value (US$ Million) Forecast by Packaging Application, 2015 to 2032

Table 22: North America Market Volume (Units) Forecast by Packaging Application, 2015 to 2032

Table 23: North America Market Value (US$ Million) Forecast by Origin of Bio Pigments, 2015 to 2032

Table 24: North America Market Volume (Units) Forecast by Origin of Bio Pigments, 2015 to 2032

Table 25: Latin America Market Value (US$ Million) Forecast by Country, 2015 to 2032

Table 26: Latin America Market Volume (Units) Forecast by Country, 2015 to 2032

Table 27: Latin America Market Value (US$ Million) Forecast by Colour, 2015 to 2032

Table 28: Latin America Market Volume (Units) Forecast by Colour, 2015 to 2032

Table 29: Latin America Market Value (US$ Million) Forecast by Component Ink Type, 2015 to 2032

Table 30: Latin America Market Volume (Units) Forecast by Component Ink Type, 2015 to 2032

Table 31: Latin America Market Value (US$ Million) Forecast by Printing Process, 2015 to 2032

Table 32: Latin America Market Volume (Units) Forecast by Printing Process, 2015 to 2032

Table 33: Latin America Market Value (US$ Million) Forecast by Packaging Application, 2015 to 2032

Table 34: Latin America Market Volume (Units) Forecast by Packaging Application, 2015 to 2032

Table 35: Latin America Market Value (US$ Million) Forecast by Origin of Bio Pigments, 2015 to 2032

Table 36: Latin America Market Volume (Units) Forecast by Origin of Bio Pigments, 2015 to 2032

Table 37: Europe Market Value (US$ Million) Forecast by Country, 2015 to 2032

Table 38: Europe Market Volume (Units) Forecast by Country, 2015 to 2032

Table 39: Europe Market Value (US$ Million) Forecast by Colour, 2015 to 2032

Table 40: Europe Market Volume (Units) Forecast by Colour, 2015 to 2032

Table 41: Europe Market Value (US$ Million) Forecast by Component Ink Type, 2015 to 2032

Table 42: Europe Market Volume (Units) Forecast by Component Ink Type, 2015 to 2032

Table 43: Europe Market Value (US$ Million) Forecast by Printing Process, 2015 to 2032

Table 44: Europe Market Volume (Units) Forecast by Printing Process, 2015 to 2032

Table 45: Europe Market Value (US$ Million) Forecast by Packaging Application, 2015 to 2032

Table 46: Europe Market Volume (Units) Forecast by Packaging Application, 2015 to 2032

Table 47: Europe Market Value (US$ Million) Forecast by Origin of Bio Pigments, 2015 to 2032

Table 48: Europe Market Volume (Units) Forecast by Origin of Bio Pigments, 2015 to 2032

Table 49: East Asia Market Value (US$ Million) Forecast by Country, 2015 to 2032

Table 50: East Asia Market Volume (Units) Forecast by Country, 2015 to 2032

Table 51: East Asia Market Value (US$ Million) Forecast by Colour, 2015 to 2032

Table 52: East Asia Market Volume (Units) Forecast by Colour, 2015 to 2032

Table 53: East Asia Market Value (US$ Million) Forecast by Component Ink Type, 2015 to 2032

Table 54: East Asia Market Volume (Units) Forecast by Component Ink Type, 2015 to 2032

Table 55: East Asia Market Value (US$ Million) Forecast by Printing Process, 2015 to 2032

Table 56: East Asia Market Volume (Units) Forecast by Printing Process, 2015 to 2032

Table 57: East Asia Market Value (US$ Million) Forecast by Packaging Process, 2015 to 2032

Table 58: East Asia Market Volume (Units) Forecast by Packaging Process, 2015 to 2032

Table 59: East Asia Market Value (US$ Million) Forecast by Origin of Bio Pigments, 2015 to 2032

Table 60: East Asia Market Volume (Units) Forecast by Origin of Bio Pigments, 2015 to 2032

Table 61: South Asia Market Value (US$ Million) Forecast by Country, 2015 to 2032

Table 62: South Asia Market Volume (Units) Forecast by Country, 2015 to 2032

Table 63: South Asia Market Value (US$ Million) Forecast by Colour, 2015 to 2032

Table 64: South Asia Market Volume (Units) Forecast by Colour, 2015 to 2032

Table 65: South Asia Market Value (US$ Million) Forecast by Component Ink Type, 2015 to 2032

Table 66: South Asia Market Volume (Units) Forecast by Component Ink Type, 2015 to 2032

Table 67: South Asia Market Value (US$ Million) Forecast by Printing Process, 2015 to 2032

Table 68: South Asia Market Volume (Units) Forecast by Printing Process, 2015 to 2032

Table 69: South Asia Market Value (US$ Million) Forecast by Packaging Application, 2015 to 2032

Table 70: South Asia Market Volume (Units) Forecast by Packaging Application, 2015 to 2032

Table 71: South Asia Market Value (US$ Million) Forecast by Origin of Bio Pigments, 2015 to 2032

Table 72: South Asia Market Volume (Units) Forecast by Origin of Bio Pigments, 2015 to 2032

Table 73: Oceania Market Value (US$ Million) Forecast by Country, 2015 to 2032

Table 74: Oceania Market Volume (Units) Forecast by Country, 2015 to 2032

Table 75: Oceania Market Value (US$ Million) Forecast by Colour, 2015 to 2032

Table 76: Oceania Market Volume (Units) Forecast by Colour, 2015 to 2032

Table 77: Oceania Market Value (US$ Million) Forecast by Component Ink Type, 2015 to 2032

Table 78: Oceania Market Volume (Units) Forecast by Component Ink Type, 2015 to 2032

Table 79: Oceania Market Value (US$ Million) Forecast by Printing Process, 2015 to 2032

Table 80: Oceania Market Volume (Units) Forecast by Printing Process, 2015 to 2032

Table 81: Oceania Market Value (US$ Million) Forecast by Packaging Application, 2015 to 2032

Table 82: Oceania Market Volume (Units) Forecast by Packaging Application, 2015 to 2032

Table 83: Oceania Market Value (US$ Million) Forecast by Origin of Bio Pigments, 2015 to 2032

Table 84: Oceania Market Volume (Units) Forecast by Origin of Bio Pigments, 2015 to 2032

Table 85: MEA Market Value (US$ Million) Forecast by Country, 2015 to 2032

Table 86: MEA Market Volume (Units) Forecast by Country, 2015 to 2032

Table 87: MEA Market Value (US$ Million) Forecast by Colour, 2015 to 2032

Table 88: MEA Market Volume (Units) Forecast by Colour, 2015 to 2032

Table 89: MEA Market Value (US$ Million) Forecast by Component Ink Type, 2015 to 2032

Table 90: MEA Market Volume (Units) Forecast by Component Ink Type, 2015 to 2032

Table 91: MEA Market Value (US$ Million) Forecast by Printing Process, 2015 to 2032

Table 92: MEA Market Volume (Units) Forecast by Printing Process, 2015 to 2032

Table 93: MEA Market Value (US$ Million) Forecast by Packaging Application, 2015 to 2032

Table 94: MEA Market Volume (Units) Forecast by Packaging Application, 2015 to 2032

Table 95: MEA Market Value (US$ Million) Forecast by Origin of Bio pigments, 2015 to 2032

Table 96: MEA Market Volume (Units) Forecast by Origin of Bio pigments, 2015 to 2032

Table 97: USA Market Value (US$ Million) Forecast by Colour, Component Ink Type, Printing Process, Packaging Application, and Origin of Bio Pigments(2022(E) to 2032(F))

Table 98: Canada Market Value (US$ Million) Forecast by Colour, Component Ink Type, and Printing Process, Packaging Application, and Origin of Bio Pigments(2022(E) to 2032(F))

Table 99: Brazil Market Value (US$ Million) Forecast by Colour, Component Ink Type, and Printing Process, Packaging Application, and Origin of Bio Pigments(2022(E) to 2032(F))

Table 100: Mexico Market Value (US$ Million) Forecast by Colour, Component Ink Type, and Printing Process, Packaging Application, and Origin of Bio Pigments(2022(E) to 2032(F))

Table 101: Germany Market Value (US$ Million) Forecast by Colour, Component Ink Type, and Printing Process, Packaging Application, and Origin of Bio Pigments(2022(E) to 2032(F))

Table 102: Italy Market Value (US$ Million) Forecast by Colour, Component Ink Type, and Printing Process, Packaging Application, and Origin of Bio Pigments(2022(E) to 2032(F))

Table 103: France Market Value (US$ Million) Forecast by Colour, Component Ink Type, and Printing Process, Packaging Application, and Origin of Bio Pigments(2022(E) to 2032(F))

Table 104: Spain Market Value (US$ Million) Forecast by Colour, Component Ink Type, and Printing Process, Packaging Application, and Origin of Bio Pigments(2022(E) to 2032(F))

Table 105: United Kingdom Market Value (US$ Million) Forecast by Colour, Component Ink Type, and Printing Process, Packaging Application, and Origin of Bio Pigments(2022(E) to 2032(F))

Table 106: Russia Market Value (US$ Million) Forecast by Colour, Component Ink Type, and Printing Process, Packaging Application, and Origin of Bio Pigments(2022(E) to 2032(F))

Table 107: China Market Value (US$ Million) Forecast by Colour, Component Ink Type, and Printing Process, Packaging Application, and Origin of Bio Pigments(2022(E) to 2032(F))

Table 108: Japan Market Value (US$ Million) Forecast by Colour, Component Ink Type, and Printing Process, Packaging Application, and Origin of Bio Pigments(2022(E) to 2032(F))

Table 109: India Market Value (US$ Million) Forecast by Colour, Component Ink Type, and Printing Process, Packaging Application, and Origin of Bio Pigments(2022(E) to 2032(F))

Table 110: GCC Countries Market Value (US$ Million) Forecast by Colour, Component Ink Type, and Printing Process, Packaging Application, and Origin of Bio Pigments(2022(E) to 2032(F))

Table 111: Australia Market Value (US$ Million) Forecast by Colour, Component Ink Type, and Printing Process, Packaging Application, and Origin of Bio Pigments(2022(E) to 2032(F))

List of Figures

Figure 01: Global Market Value (US$ Million) by Colour, 2022 to 2032

Figure 02: Global Market Value (US$ Million) by Component Ink Type, 2022 to 2032

Figure 03: Global Market Value (US$ Million) by Printing Process, 2022 to 2032

Figure 04: Global Market Value (US$ Million) by Packaging Application, 2022 to 2032

Figure 05: Global Market Value (US$ Million) by Origin of Bio Pigments, 2022 to 2032

Figure 06: Global Market Value (US$ Million) by Region, 2022 to 2032

Figure 07: Global Market Value (US$ Million) Analysis by Region, 2015 to 2021

Figure 08: Global Market Volume (Units) Analysis by Region, 2015 to 2032

Figure 09: Global Market Value Share (%) and BPS Analysis by Region, 2022 to 2032

Figure 10: Global Market Y-o-Y Growth (%) Projections by Region, 2022 to 2032

Figure 11: Global Market Value (US$ Million) Analysis by Colour, 2015 to 2021

Figure 12: Global Market Volume (Units) Analysis by Colour, 2015 to 2032

Figure 13: Global Market Value Share (%) and BPS Analysis by Colour, 2022 to 2032

Figure 14: Global Market Y-o-Y Growth (%) Projections by Colour, 2022 to 2032

Figure 15: Global Market Value (US$ Million) Analysis by Component Ink Type, 2015 to 2021

Figure 16: Global Market Volume (Units) Analysis by Component Ink Type, 2015 to 2032

Figure 17: Global Market Value Share (%) and BPS Analysis by Component Ink Type, 2022 to 2032

Figure 18: Global Market Y-o-Y Growth (%) Projections by Component Ink Type, 2022 to 2032

Figure 19: Global Market Value (US$ Million) Analysis by Printing Process, 2015 to 2021

Figure 20: Global Market Volume (Units) Analysis by Printing Process, 2015 to 2032

Figure 21: Global Market Value Share (%) and BPS Analysis by Printing Process, 2022 to 2032

Figure 22: Global Market Y-o-Y Growth (%) Projections by Printing Process, 2022 to 2032

Figure 23: Global Market Value (US$ Million) Analysis by Packaging Application, 2015 to 2021

Figure 24: Global Market Volume (Units) Analysis by Packaging Application, 2015 to 2032

Figure 25: Global Market Value Share (%) and BPS Analysis by Packaging Application, 2022 to 2032

Figure 26: Global Market Y-o-Y Growth (%) Projections by Packaging Application, 2022 to 2032

Figure 27: Global Market Value (US$ Million) Analysis by Origin of Bio Pigments, 2015 to 2021

Figure 28: Global Market Volume (Units) Analysis by Origin of Bio Pigments, 2015 to 2032

Figure 29: Global Market Value Share (%) and BPS Analysis by Origin of Bio Pigments, 2022 to 2032

Figure 30: Global Market Y-o-Y Growth (%) Projections by Origin of Bio Pigments, 2022 to 2032

Figure 31: Global Market Attractiveness by Colour, 2022 to 2032

Figure 32: Global Market Attractiveness by Component Ink Type, 2022 to 2032

Figure 33: Global Market Attractiveness by Printing Process, 2022 to 2032

Figure 34: Global Market Attractiveness by Packaging Application, 2022 to 2032

Figure 35: Global Market Attractiveness by Origin of Bio Pigments, 2022 to 2032

Figure 36: Global Market Attractiveness by Region, 2022 to 2032

Figure 37: North America Market Value (US$ Million) by Colour, 2022 to 2032

Figure 38: North America Market Value (US$ Million) by Component Ink Type, 2022 to 2032

Figure 39: North America Market Value (US$ Million) by Printing Process, 2022 to 2032

Figure 40: North America Market Value (US$ Million) by Packaging Application, 2022 to 2032

Figure 41: North America Market Value (US$ Million) by Origin of Bio Pigments, 2022 to 2032

Figure 42: North America Market Value (US$ Million) by Country, 2022 to 2032

Figure 43: North America Market Value (US$ Million) Analysis by Country, 2015 to 2021

Figure 44: North America Market Volume (Units) Analysis by Country, 2015 to 2032

Figure 45: North America Market Value Share (%) and BPS Analysis by Country, 2022 to 2032

Figure 46: North America Market Y-o-Y Growth (%) Projections by Country, 2022 to 2032

Figure 47: North America Market Value (US$ Million) Analysis by Colour, 2015 to 2021

Figure 48: North America Market Volume (Units) Analysis by Colour, 2015 to 2032

Figure 49: North America Market Value Share (%) and BPS Analysis by Colour, 2022 to 2032

Figure 50: North America Market Y-o-Y Growth (%) Projections by Colour, 2022 to 2032

Figure 51: North America Market Value (US$ Million) Analysis by Component Ink Type, 2015 to 2021

Figure 52: North America Market Volume (Units) Analysis by Component Ink Type, 2015 to 2032

Figure 53: North America Market Value Share (%) and BPS Analysis by Component Ink Type, 2022 to 2032

Figure 54: North America Market Y-o-Y Growth (%) Projections by Component Ink Type, 2022 to 2032

Figure 55: North America Market Value (US$ Million) Analysis by Printing Process, 2015 to 2021

Figure 56: North America Market Volume (Units) Analysis by Printing Process, 2015 to 2032

Figure 57: North America Market Value Share (%) and BPS Analysis by Printing Process, 2022 to 2032

Figure 58: North America Market Y-o-Y Growth (%) Projections by Printing Process, 2022 to 2032

Figure 59: North America Market Value (US$ Million) Analysis by Packaging Application, 2015 to 2021

Figure 60: North America Market Volume (Units) Analysis by Packaging Application, 2015 to 2032

Figure 61: North America Market Value Share (%) and BPS Analysis by Packaging Application, 2022 to 2032

Figure 62: North America Market Y-o-Y Growth (%) Projections by Packaging Application, 2022 to 2032

Figure 63: North America Market Value (US$ Million) Analysis by Origin of Bio Pigments, 2015 to 2021

Figure 64: North America Market Volume (Units) Analysis by Origin of Bio Pigments, 2015 to 2032

Figure 65: North America Market Value Share (%) and BPS Analysis by Origin of Bio Pigments, 2022 to 2032

Figure 66: North America Market Y-o-Y Growth (%) Projections by Origin of Bio Pigments, 2022 to 2032

Figure 67: North America Market Attractiveness by Colour, 2022 to 2032

Figure 68: North America Market Attractiveness by Component Ink Type, 2022 to 2032

Figure 69: North America Market Attractiveness by Printing Process, 2022 to 2032

Figure 70: North America Market Attractiveness by Packaging Application, 2022 to 2032

Figure 71: North America Market Attractiveness by Origin of Bio Pigments, 2022 to 2032

Figure 72: North America Market Attractiveness by Country, 2022 to 2032

Figure 73: Latin America Market Value (US$ Million) by Colour, 2022 to 2032

Figure 74: Latin America Market Value (US$ Million) by Component Ink Type, 2022 to 2032

Figure 75: Latin America Market Value (US$ Million) by Printing Process, 2022 to 2032

Figure 76: Latin America Market Value (US$ Million) by Packaging Application, 2022 to 2032

Figure 77: Latin America Market Value (US$ Million) by Origin of Bio Pigments, 2022 to 2032

Figure 78: Latin America Market Value (US$ Million) by Country, 2022 to 2032

Figure 79: Latin America Market Value (US$ Million) Analysis by Country, 2015 to 2021

Figure 80: Latin America Market Volume (Units) Analysis by Country, 2015 to 2032

Figure 81: Latin America Market Value Share (%) and BPS Analysis by Country, 2022 to 2032

Figure 82: Latin America Market Y-o-Y Growth (%) Projections by Country, 2022 to 2032

Figure 83: Latin America Market Value (US$ Million) Analysis by Colour, 2015 to 2021

Figure 84: Latin America Market Volume (Units) Analysis by Colour, 2015 to 2032

Figure 85: Latin America Market Value Share (%) and BPS Analysis by Colour, 2022 to 2032

Figure 86: Latin America Market Y-o-Y Growth (%) Projections by Colour, 2022 to 2032

Figure 87: Latin America Market Value (US$ Million) Analysis by Component Ink Type, 2015 to 2021

Figure 88: Latin America Market Volume (Units) Analysis by Component Ink Type, 2015 to 2032

Figure 89: Latin America Market Value Share (%) and BPS Analysis by Component Ink Type, 2022 to 2032

Figure 90: Latin America Market Y-o-Y Growth (%) Projections by Component Ink Type, 2022 to 2032

Figure 91: Latin America Market Value (US$ Million) Analysis by Printing Process, 2015 to 2021

Figure 92: Latin America Market Volume (Units) Analysis by Printing Process, 2015 to 2032

Figure 93: Latin America Market Value Share (%) and BPS Analysis by Printing Process, 2022 to 2032

Figure 94: Latin America Market Y-o-Y Growth (%) Projections by Printing Process, 2022 to 2032

Figure 95: Latin America Market Value (US$ Million) Analysis by Packaging Application, 2015 to 2021

Figure 96: Latin America Market Volume (Units) Analysis by Packaging Application, 2015 to 2032

Figure 97: Latin America Market Value Share (%) and BPS Analysis by Packaging Application, 2022 to 2032

Figure 98: Latin America Market Y-o-Y Growth (%) Projections by Packaging Application, 2022 to 2032

Figure 99: Latin America Market Value (US$ Million) Analysis by Origin of Bio Pigments, 2015 to 2021

Figure 100: Latin America Market Volume (Units) Analysis by Origin of Bio Pigments, 2015 to 2032

Figure 101: Latin America Market Value Share (%) and BPS Analysis by Origin of Bio Pigments, 2022 to 2032

Figure 102: Latin America Market Y-o-Y Growth (%) Projections by Origin of Bio Pigments, 2022 to 2032

Figure 103: Latin America Market Attractiveness by Colour, 2022 to 2032

Figure 104: Latin America Market Attractiveness by Component Ink Type, 2022 to 2032

Figure 105: Latin America Market Attractiveness by Printing Process, 2022 to 2032

Figure 106: Latin America Market Attractiveness by Packaging Application, 2022 to 2032

Figure 107: Latin America Market Attractiveness by Origin of Bio Pigments, 2022 to 2032

Figure 108: Latin America Market Attractiveness by Country, 2022 to 2032

Figure 109: Europe Market Value (US$ Million) by Colour, 2022 to 2032

Figure 110: Europe Market Value (US$ Million) by Component Ink Type, 2022 to 2032

Figure 111: Europe Market Value (US$ Million) by Printing Process, 2022 to 2032

Figure 112: Europe Market Value (US$ Million) by Packaging Application, 2022 to 2032

Figure 113: Europe Market Value (US$ Million) by Origin of Bio Pigments, 2022 to 2032

Figure 114: Europe Market Value (US$ Million) by Country, 2022 to 2032

Figure 115: Europe Market Value (US$ Million) Analysis by Country, 2015 to 2021

Figure 116: Europe Market Volume (Units) Analysis by Country, 2015 to 2032

Figure 117: Europe Market Value Share (%) and BPS Analysis by Country, 2022 to 2032

Figure 118: Europe Market Y-o-Y Growth (%) Projections by Country, 2022 to 2032

Figure 119: Europe Market Value (US$ Million) Analysis by Colour, 2015 to 2021

Figure 120: Europe Market Volume (Units) Analysis by Colour, 2015 to 2032

Figure 121: Europe Market Value Share (%) and BPS Analysis by Colour, 2022 to 2032

Figure 122: Europe Market Y-o-Y Growth (%) Projections by Colour, 2022 to 2032

Figure 123: Europe Market Value (US$ Million) Analysis by Component Ink Type, 2015 to 2021

Figure 124: Europe Market Volume (Units) Analysis by Component Ink Type, 2015 to 2032

Figure 125: Europe Market Value Share (%) and BPS Analysis by Component Ink Type, 2022 to 2032

Figure 126: Europe Market Y-o-Y Growth (%) Projections by Component Ink Type, 2022 to 2032

Figure 127: Europe Market Value (US$ Million) Analysis by Printing Process, 2015 to 2021

Figure 128: Europe Market Volume (Units) Analysis by Printing Process, 2015 to 2032

Figure 129: Europe Market Value Share (%) and BPS Analysis by Printing Process, 2022 to 2032

Figure 130: Europe Market Y-o-Y Growth (%) Projections by Printing Process, 2022 to 2032

Figure 131: Europe Market Value (US$ Million) Analysis by Packaging Application, 2015 to 2021

Figure 132: Europe Market Volume (Units) Analysis by Packaging Application, 2015 to 2032

Figure 133: Europe Market Value Share (%) and BPS Analysis by Packaging Application, 2022 to 2032

Figure 134: Europe Market Y-o-Y Growth (%) Projections by Packaging Application, 2022 to 2032

Figure 135: Europe Market Value (US$ Million) Analysis by Origin of Bio pigments, 2015 to 2021

Figure 136: Europe Market Volume (Units) Analysis by Origin of Bio pigments, 2015 to 2032

Figure 137: Europe Market Value Share (%) and BPS Analysis by Origin of Bio pigments, 2022 to 2032

Figure 138: Europe Market Y-o-Y Growth (%) Projections by Origin of Bio pigments, 2022 to 2032

Figure 139: Europe Market Attractiveness by Colour, 2022 to 2032

Figure 140: Europe Market Attractiveness by Component Ink Type, 2022 to 2032

Figure 141: Europe Market Attractiveness by Printing Process, 2022 to 2032

Figure 142: Europe Market Attractiveness by Packaging Application, 2022 to 2032

Figure 143: Europe Market Attractiveness by Origin of Bio Pigments, 2022 to 2032

Figure 144: Europe Market Attractiveness by Country, 2022 to 2032

Figure 145: East Asia Market Value (US$ Million) by Colour, 2022 to 2032

Figure 146: East Asia Market Value (US$ Million) by Component Ink Type, 2022 to 2032

Figure 147: East Asia Market Value (US$ Million) by Printing Process, 2022 to 2032

Figure 148: East Asia Market Value (US$ Million) by Packaging Application, 2022 to 2032

Figure 149: East Asia Market Value (US$ Million) by Origin of Bio Pigments, 2022 to 2032

Figure 150: East Asia Market Value (US$ Million) by Country, 2022 to 2032

Figure 151: East Asia Market Value (US$ Million) Analysis by Country, 2015 to 2021

Figure 152: East Asia Market Volume (Units) Analysis by Country, 2015 to 2032

Figure 153: East Asia Market Value Share (%) and BPS Analysis by Country, 2022 to 2032

Figure 154: East Asia Market Y-o-Y Growth (%) Projections by Country, 2022 to 2032

Figure 155: East Asia Market Value (US$ Million) Analysis by Colour, 2015 to 2021

Figure 156: East Asia Market Volume (Units) Analysis by Colour, 2015 to 2032

Figure 157: East Asia Market Value Share (%) and BPS Analysis by Colour, 2022 to 2032

Figure 158: East Asia Market Y-o-Y Growth (%) Projections by Colour, 2022 to 2032

Figure 159: East Asia Market Value (US$ Million) Analysis by Component Ink Type, 2015 to 2021

Figure 160: East Asia Market Volume (Units) Analysis by Component Ink Type, 2015 to 2032

Figure 161: East Asia Market Value Share (%) and BPS Analysis by Component Ink Type, 2022 to 2032

Figure 162: East Asia Market Y-o-Y Growth (%) Projections by Component Ink Type, 2022 to 2032

Figure 163: East Asia Market Value (US$ Million) Analysis by Printing Process, 2015 to 2021

Figure 164: East Asia Market Volume (Units) Analysis by Printing Process, 2015 to 2032

Figure 165: East Asia Market Value Share (%) and BPS Analysis by Printing Process, 2022 to 2032

Figure 166: East Asia Market Y-o-Y Growth (%) Projections by Printing Process, 2022 to 2032

Figure 167: East Asia Market Value (US$ Million) Analysis by Packaging Application, 2015 to 2021

Figure 168: East Asia Market Volume (Units) Analysis by Packaging Application, 2015 to 2032

Figure 169: East Asia Market Value Share (%) and BPS Analysis by Packaging Application, 2022 to 2032

Figure 170: East Asia Market Y-o-Y Growth (%) Projections by Packaging Application, 2022 to 2032

Figure 171: East Asia Market Attractiveness by Colour, 2022 to 2032

Figure 172: East Asia Market Attractiveness by Component Ink Type, 2022 to 2032

Figure 173: East Asia Market Attractiveness by Printing Process, 2022 to 2032

Figure 174: East Asia Market Attractiveness by Packaging Application, 2022 to 2032

Figure 175: East Asia Market Attractiveness by Origin of Bio Pigments, 2022 to 2032

Figure 176: East Asia Market Attractiveness by Country, 2022 to 2032

Figure 177: South Asia Market Value (US$ Million) by Colour, 2022 to 2032

Figure 178: South Asia Market Value (US$ Million) by Component Ink Type, 2022 to 2032

Figure 179: South Asia Market Value (US$ Million) by Printing Process, 2022 to 2032

Figure 180: South Asia Market Value (US$ Million) by Packaging Application, 2022 to 2032

Figure 181: South Asia Market Value (US$ Million) by Origin of Bio Pigments, 2022 to 2032

Figure 182: South Asia Market Value (US$ Million) by Country, 2022 to 2032

Figure 183: South Asia Market Value (US$ Million) Analysis by Country, 2015 to 2021

Figure 184: South Asia Market Volume (Units) Analysis by Country, 2015 to 2032

Figure 185: South Asia Market Value Share (%) and BPS Analysis by Country, 2022 to 2032

Figure 186: South Asia Market Y-o-Y Growth (%) Projections by Country, 2022 to 2032

Figure 187: South Asia Market Value (US$ Million) Analysis by Colour, 2015 to 2021

Figure 188: South Asia Market Volume (Units) Analysis by Colour, 2015 to 2032

Figure 189: South Asia Market Value Share (%) and BPS Analysis by Colour, 2022 to 2032

Figure 190: South Asia Market Y-o-Y Growth (%) Projections by Colour, 2022 to 2032

Figure 191: South Asia Market Value (US$ Million) Analysis by Component Ink Type, 2015 to 2021

Figure 192: South Asia Market Volume (Units) Analysis by Component Ink Type, 2015 to 2032

Figure 193: South Asia Market Value Share (%) and BPS Analysis by Component Ink Type, 2022 to 2032

Figure 194: South Asia Market Y-o-Y Growth (%) Projections by Component Ink Type, 2022 to 2032

Figure 195: South Asia Market Value (US$ Million) Analysis by Printing Process, 2015 to 2021

Figure 196: South Asia Market Volume (Units) Analysis by Printing Process, 2015 to 2032

Figure 197: South Asia Market Value Share (%) and BPS Analysis by Printing Process, 2022 to 2032

Figure 198: South Asia Market Y-o-Y Growth (%) Projections by Printing Process, 2022 to 2032

Figure 199: South Asia Market Value (US$ Million) Analysis by Packaging Application, 2015 to 2021

Figure 200: South Asia Market Volume (Units) Analysis by Packaging Application, 2015 to 2032

Figure 201: South Asia Market Value Share (%) and BPS Analysis by Packaging Application, 2022 to 2032

Figure 202: South Asia Market Y-o-Y Growth (%) Projections by Packaging Application, 2022 to 2032

Figure 203: South Asia Market Value (US$ Million) Analysis by Origin of Bio Pigments, 2015 to 2021

Figure 204: South Asia Market Volume (Units) Analysis by Origin of Bio Pigments, 2015 to 2032

Figure 205: South Asia Market Value Share (%) and BPS Analysis by Origin of Bio Pigments, 2022 to 2032

Figure 206: South Asia Market Y-o-Y Growth (%) Projections by Origin of Bio Pigments, 2022 to 2032

Figure 207: South Asia Market Attractiveness by Colour, 2022 to 2032

Figure 208: South Asia Market Attractiveness by Component Ink Type, 2022 to 2032

Figure 209: South Asia Market Attractiveness by Printing Process, 2022 to 2032

Figure 210: South Asia Market Attractiveness by Packaging Application, 2022 to 2032

Figure 211: South Asia Market Attractiveness by Origin of Bio Pigments, 2022 to 2032

Figure 212: South Asia Market Attractiveness by Country, 2022 to 2032

Figure 213: Oceania Market Value (US$ Million) by Colour, 2022 to 2032

Figure 214: Oceania Market Value (US$ Million) by Component Ink Type, 2022 to 2032

Figure 215: Oceania Market Value (US$ Million) by Printing Process, 2022 to 2032

Figure 216: Oceania Market Value (US$ Million) by Packaging Application, 2022 to 2032

Figure 217: Oceania Market Value (US$ Million) by Origin of Bio Pigments, 2022 to 2032

Figure 218: Oceania Market Value (US$ Million) by Country, 2022 to 2032

Figure 219: Oceania Market Value (US$ Million) Analysis by Country, 2015 to 2021

Figure 220: Oceania Market Volume (Units) Analysis by Country, 2015 to 2032

Figure 221: Oceania Market Value Share (%) and BPS Analysis by Country, 2022 to 2032

Figure 222: Oceania Market Y-o-Y Growth (%) Projections by Country, 2022 to 2032

Figure 223: Oceania Market Value (US$ Million) Analysis by Colour, 2015 to 2021

Figure 224: Oceania Market Volume (Units) Analysis by Colour, 2015 to 2032

Figure 225: Oceania Market Value Share (%) and BPS Analysis by Colour, 2022 to 2032

Figure 226: Oceania Market Y-o-Y Growth (%) Projections by Colour, 2022 to 2032

Figure 227: Oceania Market Value (US$ Million) Analysis by Component Ink Type, 2015 to 2021

Figure 228: Oceania Market Volume (Units) Analysis by Component Ink Type, 2015 to 2032

Figure 229: Oceania Market Value Share (%) and BPS Analysis by Component Ink Type, 2022 to 2032

Figure 230: Oceania Market Y-o-Y Growth (%) Projections by Component Ink Type, 2022 to 2032

Figure 231: Oceania Market Value (US$ Million) Analysis by Printing Process, 2015 to 2021

Figure 232: Oceania Market Volume (Units) Analysis by Printing Process, 2015 to 2032

Figure 233: Oceania Market Value Share (%) and BPS Analysis by Printing Process, 2022 to 2032

Figure 234: Oceania Market Y-o-Y Growth (%) Projections by Printing Process, 2022 to 2032

Figure 235: Oceania Market Value (US$ Million) Analysis by Packaging Application, 2015 to 2021

Figure 236: Oceania Market Volume (Units) Analysis by Packaging Application, 2015 to 2032

Figure 237: Oceania Market Value Share (%) and BPS Analysis by Packaging Application, 2022 to 2032

Figure 238: Oceania Market Y-o-Y Growth (%) Projections by Packaging Application, 2022 to 2032

Figure 239: Oceania Market Attractiveness by Colour, 2022 to 2032

Figure 240: Oceania Market Attractiveness by Component Ink Type, 2022 to 2032

Figure 241: Oceania Market Attractiveness by Printing Process, 2022 to 2032

Figure 242: Oceania Market Attractiveness by Packaging Application, 2022 to 2032

Figure 243: Oceania Market Attractiveness by Origin of Bio Pigments, 2022 to 2032

Figure 244: Oceania Market Attractiveness by Country, 2022 to 2032

Figure 245: MEA Market Value (US$ Million) by Colour, 2022 to 2032

Figure 246: MEA Market Value (US$ Million) by Component Ink Type, 2022 to 2032

Figure 247: MEA Market Value (US$ Million) by Printing Process, 2022 to 2032

Figure 248: MEA Market Value (US$ Million) by Packaging Application, 2022 to 2032

Figure 249: MEA Market Value (US$ Million) by Origin of Bio Pigments, 2022 to 2032

Figure 250: MEA Market Value (US$ Million) by Country, 2022 to 2032

Figure 251: MEA Market Value (US$ Million) Analysis by Country, 2015 to 2021

Figure 252: MEA Market Volume (Units) Analysis by Country, 2015 to 2032

Figure 253: MEA Market Value Share (%) and BPS Analysis by Country, 2022 to 2032

Figure 254: MEA Market Y-o-Y Growth (%) Projections by Country, 2022 to 2032

Figure 255: MEA Market Value (US$ Million) Analysis by Colour, 2015 to 2021

Figure 256: MEA Market Volume (Units) Analysis by Colour, 2015 to 2032

Figure 257: MEA Market Value Share (%) and BPS Analysis by Colour, 2022 to 2032

Figure 258: MEA Market Y-o-Y Growth (%) Projections by Colour, 2022 to 2032

Figure 259: MEA Market Value (US$ Million) Analysis by Component Ink Type, 2015 to 2021

Figure 260: MEA Market Volume (Units) Analysis by Component Ink Type, 2015 to 2032

Figure 261: MEA Market Value Share (%) and BPS Analysis by Component Ink Type, 2022 to 2032

Figure 262: MEA Market Y-o-Y Growth (%) Projections by Component Ink Type, 2022 to 2032

Figure 263: MEA Market Value (US$ Million) Analysis by Printing Process, 2015 to 2021

Figure 264: MEA Market Volume (Units) Analysis by Printing Process, 2015 to 2032

Figure 265: MEA Market Value Share (%) and BPS Analysis by Printing Process, 2022 to 2032

Figure 266: MEA Market Y-o-Y Growth (%) Projections by Printing Process, 2022 to 2032

Figure 267: MEA Market Value (US$ Million) Analysis by Packaging Application, 2015 to 2021

Figure 268: MEA Market Volume (Units) Analysis by Packaging Application, 2015 to 2032

Figure 269: MEA Market Value Share (%) and BPS Analysis by Packaging Application, 2022 to 2032

Figure 270: MEA Market Y-o-Y Growth (%) Projections by Packaging Application, 2022 to 2032

Figure 271: MEA Market Value (US$ Million) Analysis by Origin of Bio Pigments, 2015 to 2021

Figure 272: MEA Market Volume (Units) Analysis by Origin of Bio Pigments, 2015 to 2032

Figure 273: MEA Market Value Share (%) and BPS Analysis by Origin of Bio Pigments, 2022 to 2032

Figure 274: MEA Market Y-o-Y Growth (%) Projections by Origin of Bio Pigments, 2022 to 2032

Figure 275: MEA Market Attractiveness by Colour, 2022 to 2032

Figure 276: MEA Market Attractiveness by Component Ink Type, 2022 to 2032

Figure 277: MEA Market Attractiveness by Printing Process, 2022 to 2032

Figure 278: MEA Market Attractiveness by Packaging Application, 2022 to 2032

Figure 279: MEA Market Attractiveness by Origin of Bio Pigments, 2022 to 2032

Figure 280: MEA Market Attractiveness by Country, 2022 to 2032

Frequently Asked Questions

What was the overall size of the Eco-Friendly Inks Market in 2025?

The overall market size for the Eco-Friendly Inks Market was USD 5.10 Billion in 2025.

How big is the Smart Eco-Friendly Inks Market expected to be in 2035?

The Eco-Friendly Inks Market is expected to reach USD 8.98 Billion in 2035.

What will drive the demand for the Eco-Friendly Inks Market during the forecast period?

Rising demand for sustainable packaging, regulatory pressure to reduce VOCs, and innovations in plant-based ink chemistry will drive market growth across packaging, textile, and publishing sectors.

List the top 5 countries contributing to the Eco-Friendly Inks Market?

The top 5 countries driving the development of the Eco-Friendly Inks Market are the USA, Germany, China, Japan, and India.

Explore Similar Insights

Future Market Insights

Eco-Friendly Inks Market