Cannabis Drinks Market Outlook (2022 to 2032)

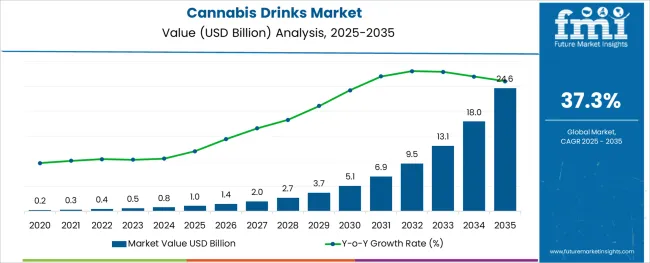
The cannabis drinks market is expected to value US$ 0.4 billion in 2022 and is projected to grow at a CAGR of 37.3% during the forecast period of 2022 to 2032, to reach a value of US$ 8.3 billion by 2032. The global cannabis drinks demand is projected to grow year-on-year (Y-o-Y) growth of 18.7% in 2022. Factors that stimulate the market expansion are:

  • The growing demand for health drinks among consumers.
  • Cannabis drink consumers are drawn to them by their clean components and proportional amounts of cannabis.
  • The legalization of marijuana usage for both recreational and medical purposes.

Cannabis beverages take the place of other marijuana-infused foods and drinks that are regarded as harmful.

Attributes Key Statistics
Market Size Value in 2022 US$ 0.4 Billion
Market Forecast Value in 2032 US$ 8.3 Billion
Global Growth Rate (2022 to 2032) ~ 37.3% CAGR
Collective Value Share: Top 3 Countries (2021A) 55.8%

Don't pay for what you don't need

Customize your report by selecting specific countries or regions and save 30%!

Legalization of Cannabis Drive the North American Market Expansion

North America, led by the USA, is at the forefront of the cannabis-infused product sector. The region's functional beverage market has an exponential development pattern, and it had the greatest market share for cannabis drinks. Additionally, the presence of several producers is anticipated to support the expansion of the cannabis drinks market in the area during the forecast period. Manufacturers are introducing cannabis, hemp, and marijuana beverages to the USA market as smoother, healthier substitutes for wine, beer, and spirits. Teas, still and sparkling waters, fruit-flavored items, as well as wine and beer infused with tetrahydrocannabinol are all examples of beverages.

A significant driver of development is the legalization of cannabis for both medicinal and recreational uses. The recreational and medicinal use of marijuana became legal in Canada in 2018. The United States has many territories such as New York, New Jersey, Vermont, and California where it is allowed to add cannabis infusion to meals and drinks. This aspect is anticipated to ratchet up the cannabis drinks market growth for cannabis-infused foods and beverages across North America. Due to the legalization of low tetrahydrocannabinol and high cannabidiol goods in 13 USA states, there is a significant market for cannabidiol-infused cannabis beverages in the area.

Cannabis Drinks Market

Europe is Emerging due to the Deployment of Cannabis for Medical Purpose

In countries like Germany, France, Italy, and others, the use and consumption of cannabis-related products for therapeutic purposes have been legalized by the government. The business for cannabis beverages in Europe is expected to increase over the next several years as customers become more socially accepting of them over alcoholic beverages. As a result, it is predicted that throughout the forecast period, the cannabis drinks market would expand significantly in Europe.

According to the Cannabis Trade Association, there were 250,000 cannabidiol consumers in the United Kingdom in 2017 compared to 125,000 in 2016. Due to the existence of marijuana-specific cafés and restaurants, demand is also high in the Netherlands. The country's expanding cannabis tourism industry is anticipated to significantly increase demand. The legalization of marijuana for medicinal and recreational use is expected to result in a considerable increase in product demand in nations like Australia and Uruguay.

Nandini Roy Choudhury

Principal Consultant

Talk to Analyst

Find your sweet spots for generating winning opportunities in this market.

Product Additions Continue Airing Regular Episodes That Open Up New Market Opportunities

Since 2018, international producers have paid close attention to the development of non-alcoholic beer with tetrahydrocannabinol added. Female millennials dominate the market for non-alcoholic beer. Calorie-free beverages rather than brownies and cookies are being promoted by manufacturers to the expanding female consumer base. Additionally, major producers of alcohol are making significant investments in the creation of non-alcoholic beverages.

Some international players are creating portfolios of cannabis-infused specialty beverages using molecules. These drinks come in a variety of unique and potent flavors and have a low-calorie count. On the other hand, some cannabis drink market participants are also selling cannabis drinks with coffee flavors. These drinks include flavors that are reminiscent of coffee and come in a range of tetrahydrocannabinol and cannabidiol concentrations to accommodate different types of cannabis consumers.

Global players are even producing non-alcoholic cocktails that blend cannabis socialization with cocktail culture in a single bottle. These beverages have a wide range of flavors, each with an amazing fusion of herbal, floral, and dry overtones. For first-time users, these cannabis drinks are great. Some well-known industry businesses develop beverages using carbonated water, fragrant oils, agave juice, and a small amount of Californian cannabis extract. These drinks deliver highly controlled effects that are milder than those of other cannabis-infused beverages. These are available at several dispensaries and could be bought online as well.

Cannabis drinks are expected to gain traction due to strong demand among millennials across the globe. According to the study, 55 million people in the USA in 2017 used cannabis recreationally.

Beer and wine sales dropped 15% in states where cannabis drinks were authorized, according to Georgia State University and the University of Connecticut. On the back of this, the demand for cannabis drinks is projected to surge by 20x over the upcoming decade.

2017 to 2021 Cannabis Drinks Market Outlook Compared to 2022 to 2032 Forecast

Cannabis drinks demand grew at 18.0% CAGR between 2017 and 2021. Cannabis beverages are gaining immense popularity as a preference for soft drinks is rising. The low sugar content of drinks is one of the factors driving the demand in the market.

Recent research has revolutionized the industry over the period and is further projected to grow at a CAGR of 37.3% during the forecast period (2022 to 2032). In the global cannabis drinks market, the demand for alcoholic cannabis-infused drinks, CBD-infused drinks, and flavored cannabis drinks is expected to rise.
Get the data you need at a Fraction of the cost

Personalize your report by choosing insights you need
and save 40%!

Country-wise Insights

How will Demand Cannabis Drinks Increase in the USA?

Cannabis Drinks Sales to Grow in the USA as the Product is Legalized

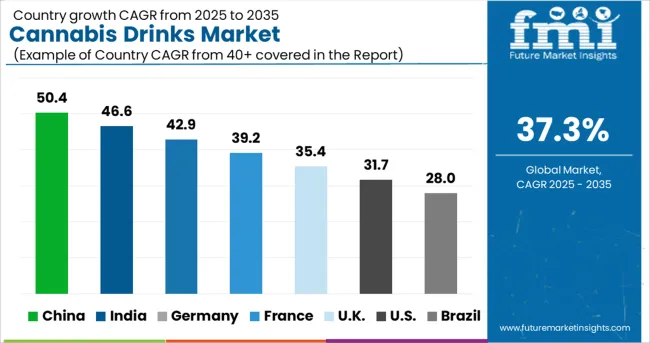
As per Future Market Insights (FMI), North America is expected to be the fastest-growing and largest market for cannabis drinks. The legalization of marijuana for recreational and medical purposes is expected to fuel the growth in the market.

According to the National Conference of State Legislatures, the District of Columbia, Puerto Rico, Guam, and the United States Virgin Islands have legalized medical cannabis programs for public use, which has resulted in the increased launch of various cannabis drinks.

Will the United Kingdom Emerge as a Lucrative Cannabis Drinks Market in Europe?

Cannabis Drinks Sales to Surge in the United Kingdom with New Product Developments

Due to an increase in the consumption of medicinal cannabis, the demand for cannabis drinks in the United Kingdom is expected to rise over the assessment period. The number of CBD consumers in the United Kingdom has increased from 125,000 to 250,000 in 2016 & 2017 respectively, according to the Cannabis Trade Association.

Cannabis-related businesses in the United Kingdom are launching new products to keep up with the expanding trend of wellness beverages. CBD Cloud 9 and Ultra Brewing in Manchester, for example, have released the first CBD Session IPA beer in the United Kingdom, which is produced with cannabis sativa extract.

Category-wise Insights

How is Demand for Alcoholic Cannabis-Infused Drinks Rising?

Alcohol Cannabis Infused

Over the forecast period, the rising consumption of cannabis-infused wellness drinks is expected to favor the growth in the market. The legalization of marijuana for recreational and medical uses is expected to have a significant influence on alcoholic cannabis-infused drinks sales. As a result, an increasing number of alcohol companies are investing in cannabis drinks.

For example, Hi-Fi Hops, a cannabis-based beverage with zero calories and carbs and infused with Cannabidiol (CBD) and Tetrahydrocannabinol, was launched by Lagunitas, Heineken's fast-growing California beer label (THC).

Which Component is Most Used in Cannabis Drinks?

Burgeoning Demand for THC-Infused Drinks Propelling Cannabis Drinks Production

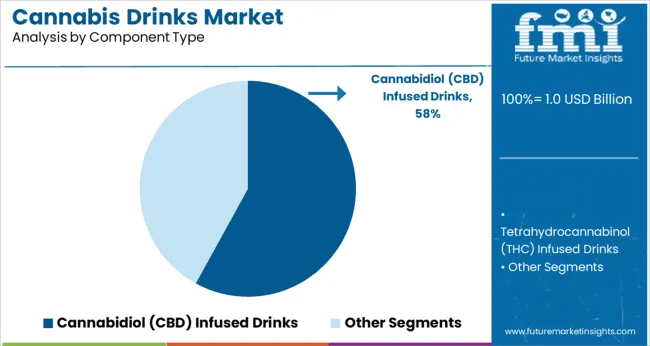
THC emulsifications are being developed by manufacturers of cannabis-infused beverages in order to achieve optimal suspension within liquids and a shorter uptake period. Leading cannabis drinks companies are catering to the growing demand for cannabis-based drinks, fueling the demand in the market.
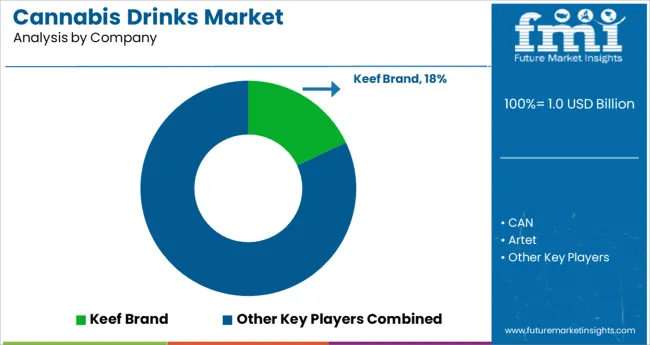
Competitive Landscape

Key cannabis drinks manufacturers are adopting strategies such as joint ventures, partnerships, mergers, and acquisitions, for innovative product lines. Also, top cannabis drinks brands are focusing on upgraded and modified products with rising demand for new formulations from the food and beverage industry.

For instance,

  • In 2021, Cann announced to launch cannabis-infused drink, a caffeinated social tonic, a first-of-its-kind product of the company. Cann, the cannabis beverage pioneer, also partnered with Tove Lo, the popstar, and investor, to create a cannabis-infused drink, Passion Peach Mate, which would be available at Sweet Flower and Airfield Supply Co. in California exclusively.

Scope of Report

Attribute Details
Market Size Value in 2022 US$ 0.4 Billion
Market Forecast Value in 2032 US$ 8.3 Billion
Global Growth Rate ~ 37.3% CAGR
Forecast Period 2022 to 2032
Historical Data Available for 2017 to 2021
Market Analysis MT for Volume and US$ Billion for Value
Key Regions Covered North America; Latin America; Europe; East Asia; South Asia; Oceania; and Middle East and Africa
Key Countries Covered United States of America, Canada, Germany, Brazil, Mexico, France, Italy, Spain, United Kingdom, Russia, China, Japan, South Korea, India, Australia, GCC Countries, South Africa, and others
Key Market Segments Covered Product Type, Component, Flavor, Sales Channel, and Regions
Key Companies Profiled Artet; CAN; Phivida Holdings Inc.; The Alkaline Water Company; VCC Brands; Koios Beverage Corporation; Keef Brand; Dixie Brands Inc.; Aphria; Hexo Corp; Canopy Growth; Others

Cannabis Drinks Market by Category

By Product Type:

  • Alcoholic Cannabis-Infused Drinks
    • Cannabis Infused Wine
    • Cannabis Infused Beer
    • Other Cannabis Infused Spirits
  • Non-Alcoholic Cannabis-Infused Drinks
    • Cannabis Infused Water
    • Cannabis Infused Coffee
    • Cannabis Infused Tea
    • Cannabis Infused Juice
    • Other Cannabis Infused Functional Drinks

By Component:

  • Tetrahydrocannabinol (THC) Infused Drinks
  • Cannabidiol (CBD) Infused Drinks

By Flavor:

  • Unflavoured
  • Flavored
    • Fruit
    • Apple Cider
    • Black Tea
    • Butter
    • Cappuccino
    • Caramel
    • Cheese
    • Lemon
    • Others

By Sales Channel:

  • B2B / HoReCa
  • B2C
    • Hypermarkets /Supermarkets
    • Food Specialty Stores
    • Online Retail
    • Others Retail Formats

By Region:

  • North America
  • Latin America
  • Europe
  • East Asia
  • South Asia
  • Oceania
  • Middle East & Africa

Frequently Asked Questions

How much worth is the cannabis drinks industry?

The cannabis drinks market is estimated to reach sales of nearly US$ 0.4 Billion by 2022.

At what CAGR is the market expected to expand through 2032?

Cannabis drinks market revenue is expected to increase at a CAGR of around 37.3% during the period 2022 to 2032.

How was the performance of cannabis drinks over the past half-decade?

Cannabis drinks sales increased a CAGR of around 18.0% over the past half-decade.

What will be the market for cannabis drinks worth in 2032?

The global cannabis drinks market value will be around US$ 8.3 Billion in 2032.

Who are the key players operating in the market?

Artet, CAN, Phivida Holdings Inc., The Alkaline Water Company, and VCC Brands are a few of the top players driving the market growth.

What are the key factors affecting the cannabis drinks market growth?

High product demand from the beverage industry and the legalization of the product in several countries are the factors driving the growth of the cannabis drinks market.

Table of Content
1. Executive Summary | Cannabis Drinks Market

    1.1. Global Market Outlook

    1.2. Demand-side Trends

    1.3. Supply-side Trends

    1.4. Technology Roadmap Analysis

    1.5. Analysis and Recommendations

2. Market Overview

    2.1. Market Coverage / Taxonomy

    2.2. Market Definition / Scope / Limitations

3. The Massive Impact of the Crisis

    3.1. Global Market Forecast Scenario Comparison of Annual Growth Rates for Short Term (2022 to 2025) and Long Term (2026 to 2032)

        3.1.1. Optimistic Scenario

            3.1.1.1. China

            3.1.1.2. USA

            3.1.1.3. India

            3.1.1.4. Euro Zone

            3.1.1.5. Asia Pacific

            3.1.1.6. Rest of the World

        3.1.2. Likely Scenario

            3.1.2.1. China

            3.1.2.2. USA

            3.1.2.3. India

            3.1.2.4. Euro Zone

            3.1.2.5. Asia Pacific

            3.1.2.6. Rest of the World

        3.1.3. Pessimistic Scenario

            3.1.3.1. China

            3.1.3.2. USA

            3.1.3.3. India

            3.1.3.4. Euro Zone

            3.1.3.5. Asia Pacific

            3.1.3.6. Rest of the World

    3.2. Key Factors Impacting the Market

    3.3. Note: Market Assessment shall be Provided for Likely Scenario

4. Market Background

    4.1. Global Production Outlook of the Market

    4.2. Product Claims & Nutritional Information Scan of Cannabis Drinks

    4.3. Product Launches Track & Trends

    4.4. Macro-Economic Factors

    4.5. Forecast Factors - Relevance & Impact

    4.6. Consumers Survey Analysis

    4.7. Market Dynamics

        4.7.1. Supply Side Drivers

        4.7.2. Demand Side drivers

        4.7.3. Economic Side Drivers

        4.7.4. Restraints

        4.7.5. Opportunity

        4.7.6. Trends

5. Key Regulations

    5.1. Specialized Processes FDA Regulation

    5.2. Packaging & Labelling Regulations

    5.3. Certifications and Certifying Agency Overview

    5.4. Import/Export Regulations

6. Global Market Demand Analysis 2017 to 2021 and Forecast, 2022 to 2032

    6.1. Historical Market Volume (Metric Tons) Analysis, 2017 to 2021

    6.2. Current and Future Market Volume (Metric Tons) Projections, 2022 to 2032

    6.3. Y-o-Y Growth Trend Analysis 2022 to 2032

7. Global Market - Pricing Analysis

    7.1. Regional Pricing Analysis (USD/Metric Ton) By Product Type (2017,2022,2032)

        7.1.1. Alcoholic Cannabis-Infused Drinks

        7.1.2. Non-Alcoholic Cannabis-Infused Drinks

    7.2. Pricing Break-up (2017,2022,2032)

        7.2.1. Producer-Level Pricing

        7.2.2. Distributor Level Pricing

        7.2.3. Retailer Level Pricing

    7.3. Global Average Pricing Analysis Benchmark

8. Global Market Demand (Size in USD Million) Analysis 2017 to 2021 and Forecast, 2022 to 2032

    8.1. Historical Market Value (USD Million) Analysis, 2017 to 2021

    8.2. Current and Future Market Value (USD Million) Projections, 2022 to 2032

        8.2.1. Y-o-Y Growth Trend Analysis

        8.2.2. Absolute $ Opportunity Analysis

9. Global Market Analysis 2017 to 2021 and Forecast 2022 to 2032, By Product Type

    9.1. Introduction / Key Findings

    9.2. Historical Market Size (USD Million) and Volume Analysis By Product Type, 2017 to 2021

    9.3. Current and Future Market Size (USD Million) and Volume Analysis and Forecast By Product Type, 2022 to 2032

        9.3.1. Alcoholic Cannabis-Infused Drinks

            9.3.1.1. Cannabis-Infused Wine

            9.3.1.2. Cannabis-Infused Beer

            9.3.1.3. Other Cannabis-Infused Spirits

        9.3.2. Non-Alcoholic Cannabis-Infused Drinks

            9.3.2.1. Cannabis-Infused Water

            9.3.2.2. Cannabis-Infused Coffee

            9.3.2.3. Cannabis-Infused Tea

            9.3.2.4. Cannabis-Infused Juice

            9.3.2.5. Other Cannabis-Infused Functional Drinks

    9.4. Market Attractiveness Analysis By Product Type

10. Global Market Analysis 2017 to 2021 and Forecast 2022 to 2032, By Component

    10.1. Introduction / Key Findings

    10.2. Historical Market Size (USD Million) and Volume Analysis By Packaging Type, 2017 to 2021

    10.3. Current and Future Market Size (USD Million) and Volume Analysis and Forecast By Packaging Type, 2022 to 2032

        10.3.1. Tetrahydrocannabinol (THC) Infused Drinks

        10.3.2. Cannabidiol (CBD) Infused Drinks

    10.4. Market Attractiveness Analysis By Packaging Type

11. Global Market Analysis 2017 to 2021 and Forecast 2022 to 2032, By Flavor

    11.1. Introduction / Key Findings

    11.2. Historical Market Size (USD Million) and Volume Analysis By Flavor, 2017 to 2021

    11.3. Current and Future Market Size (USD Million) and Volume Analysis and Forecast By Flavor, 2022 to 2032

        11.3.1. Unflavoured

        11.3.2. Flavoured

            11.3.2.1. Fruit

            11.3.2.2. Apple Cider

            11.3.2.3. Black Tea

            11.3.2.4. Butter

            11.3.2.5. Cappuccino

            11.3.2.6. Caramel

            11.3.2.7. Cheese

            11.3.2.8. Lemon

            11.3.2.9. Others

    11.4. Market Attractiveness Analysis By Flavor

12. Global Market Analysis 2017 to 2021 and Forecast 2022 to 2032, By Sales Channel

    12.1. Introduction / Key Findings

    12.2. Historical Market Size (USD Million) and Volume Analysis By Sales Channel, 2017 to 2021

    12.3. Current and Future Market Size (USD Million) and Volume Analysis and Forecast By Sales Channel, 2022 to 2032

        12.3.1. B2B / HoReCa

        12.3.2. B2C

            12.3.2.1. Hypermarkets /Supermarkets

            12.3.2.2. Food Specialty Stores

            12.3.2.3. Online Retail

            12.3.2.4. Other Retail Formats

    12.4. Market Attractiveness Analysis By Sales Channel

13. Global Market Analysis 2017 to 2021 and Forecast 2022 to 2032, By Region

    13.1. Introduction / Key Findings

    13.2. Historical Market Size (USD Million) and Volume Analysis By Region, 2017 to 2021

    13.3. Current and Future Market Size (USD Million) and Volume Analysis and Forecast By Region, 2022 to 2032

        13.3.1. North America

        13.3.2. Latin America

        13.3.3. Europe

        13.3.4. East Asia

        13.3.5. South Asia

        13.3.6. Oceania

        13.3.7. Middle East & Africa

    13.4. Market Attractiveness Analysis By Region

14. North America Market Analysis 2017 to 2021 and Forecast 2022 to 2032

    14.1. Introduction

    14.2. Historical Market Size (USD Million) and Volume Trend Analysis By Market Taxonomy, 2017 to 2021

    14.3. Market Size (USD Million) and Volume Forecast By Market Taxonomy, 2022 to 2032

        14.3.1. By Country

            14.3.1.1. USA

            14.3.1.2. Canada

        14.3.2. By Product Type

        14.3.3. By Flavor

        14.3.4. By Component

        14.3.5. By Sales Channel

    14.4. Market Attractiveness Analysis

        14.4.1. By Product Type

        14.4.2. By Flavor

        14.4.3. By Component

        14.4.4. By Sales Channel

    14.5. Market Trends

    14.6. Key Market Participants - Intensity Mapping

    14.7. Drivers and Restraints - Impact Analysis

15. Latin America Market Analysis 2017 to 2021 and Forecast 2022 to 2032

    15.1. Introduction

    15.2. Historical Market Size (USD Million) and Volume Trend Analysis By Market Taxonomy, 2017 to 2021

    15.3. Market Size (USD Million) and Volume Forecast By Market Taxonomy, 2022 to 2032

        15.3.1. By Country

            15.3.1.1. Brazil

            15.3.1.2. Mexico

            15.3.1.3. Rest of Latin America

        15.3.2. By Product Type

        15.3.3. By Flavor

        15.3.4. By Component

        15.3.5. By Sales Channel

    15.4. Market Attractiveness Analysis

        15.4.1. By Product Type

        15.4.2. By Flavor

        15.4.3. By Component

        15.4.4. By Sales Channel

    15.5. Market Trends

    15.6. Key Market Participants - Intensity Mapping

    15.7. Drivers and Restraints - Impact Analysis

16. Europe Market Analysis 2017 to 2021and Forecast 2022 to 2032

    16.1. Introduction

    16.2. Historical Market Size (USD Million) and Volume Trend Analysis By Market Taxonomy, 2017 to 2021

    16.3. Market Size (USD Million) and Volume Forecast By Market Taxonomy, 2022 to 2032

        16.3.1. By Country

            16.3.1.1. Germany

            16.3.1.2. Italy

            16.3.1.3. France

            16.3.1.4. United Kingdom

            16.3.1.5. Spain

            16.3.1.6. Russia

            16.3.1.7. Rest of Europe

        16.3.2. By Product Type

        16.3.3. By Flavor

        16.3.4. By Component

        16.3.5. By Sales Channel

    16.4. Market Attractiveness Analysis

        16.4.1. By Product Type

        16.4.2. By Flavor

        16.4.3. By Component

        16.4.4. By Sales Channel

    16.5. Market Trends

    16.6. Key Market Participants - Intensity Mapping

    16.7. Drivers and Restraints - Impact Analysis

17. East Asia Market Analysis 2017 to 2021 and Forecast 2022 to 2032

    17.1. Introduction

    17.2. Historical Market Size (USD Million) and Volume Trend Analysis By Market Taxonomy, 2017 to 2021

    17.3. Market Size (USD Million) and Volume Forecast By Market Taxonomy, 2022 to 2032

        17.3.1. By Country

            17.3.1.1. China

            17.3.1.2. East Asia

            17.3.1.3. South Korea

        17.3.2. By Product Type

        17.3.3. By Flavor

        17.3.4. By Component

        17.3.5. By Sales Channel

    17.4. Market Attractiveness Analysis

        17.4.1. By Product Type

        17.4.2. By Flavor

        17.4.3. By Component

        17.4.4. By Sales Channel

    17.5. Market Trends

    17.6. Key Market Participants - Intensity Mapping

    17.7. Drivers and Restraints - Impact Analysis

18. South Asia Market Analysis 2017 to 2021 and Forecast 2022 to 2032

    18.1. Introduction

    18.2. Historical Market Size (USD Million) and Volume Trend Analysis By Market Taxonomy, 2017 to 2021

    18.3. Market Size (USD Million) and Volume Forecast By Market Taxonomy, 2022 to 2032

        18.3.1. By Country

            18.3.1.1. India

            18.3.1.2. Rest of South Asia

        18.3.2. By Product Type

        18.3.3. By Flavor

        18.3.4. By Component

        18.3.5. By Sales Channel

    18.4. Market Attractiveness Analysis

        18.4.1. By Product Type

        18.4.2. By Flavor

        18.4.3. By Component

        18.4.4. By Sales Channel

    18.5. Market Trends

    18.6. Key Market Participants - Intensity Mapping

    18.7. Drivers and Restraints - Impact Analysis

19. Oceania Market Analysis 2017 to 2021 and Forecast 2022 to 2032

    19.1. Introduction

    19.2. Historical Market Size (USD Million) and Volume Trend Analysis By Market Taxonomy, 2017 to 2021

    19.3. Market Size (USD Million) and Volume Forecast By Market Taxonomy, 2022 to 2032

        19.3.1. By Country

            19.3.1.1. Australia

            19.3.1.2. Rest of Oceania

        19.3.2. By Product Type

        19.3.3. By Flavor

        19.3.4. By Component

        19.3.5. By Sales Channel

    19.4. Market Attractiveness Analysis

        19.4.1. By Product Type

        19.4.2. By Flavor

        19.4.3. By Component

        19.4.4. By Sales Channel

    19.5. Market Trends

    19.6. Key Market Participants - Intensity Mapping

    19.7. Drivers and Restraints - Impact Analysis

20. Middle East and Africa Market Analysis 2017 to 2021 and Forecast 2022 to 2032

    20.1. Introduction

    20.2. Historical Market Size (USD Million) and Volume Trend Analysis By Market Taxonomy, 2017 to 2021

    20.3. Market Size (USD Million) and Volume Forecast By Market Taxonomy, 2022 to 2032

        20.3.1. By Country

            20.3.1.1. GCC Countries

            20.3.1.2. South Africa

            20.3.1.3. Rest of Middle East and Africa

        20.3.2. By Product Type

        20.3.3. By Flavor

        20.3.4. By Component

        20.3.5. By Sales Channel

    20.4. Market Attractiveness Analysis

        20.4.1. By Product Type

        20.4.2. By Flavor

        20.4.3. By Component

        20.4.4. By Sales Channel

    20.5. Market Trends

    20.6. Key Market Participants - Intensity Mapping

    20.7. Drivers and Restraints - Impact Analysis

21. Key Countries Market Analysis 2017 to 2021 and Forecast 2022 to 2032

    21.1. USA Market Value and Volume Analysis 2017 to 2021 and Forecast 2022 to 2032

        21.1.1. By Product Type

        21.1.2. By Flavor

        21.1.3. By Component

        21.1.4. By Sales Channel

    21.2. Canada Market Value and Volume Analysis 2017 to 2021 and Forecast 2022 to 2032

        21.2.1. By Product Type

        21.2.2. By Flavor

        21.2.3. By Component

        21.2.4. By Sales Channel

    21.3. Brazil Market Value and Volume Analysis 2017 to 2021 and Forecast 2022 to 2032

        21.3.1. By Product Type

        21.3.2. By Flavor

        21.3.3. By Component

        21.3.4. By Sales Channel

    21.4. Mexico Market Value and Volume Analysis 2017 to 2021 and Forecast 2022 to 2032

        21.4.1. By Product Type

        21.4.2. By Flavor

        21.4.3. By Component

        21.4.4. By Sales Channel

    21.5. Russia Market Value and Volume Analysis 2017 to 2021 and Forecast 2022 to 2032

        21.5.1. By Product Type

        21.5.2. By Flavor

        21.5.3. By Component

        21.5.4. By Sales Channel

    21.6. France Market Value and Volume Analysis 2017 to 2021 and Forecast 2022 to 2032

        21.6.1. By Product Type

        21.6.2. By Flavor

        21.6.3. By Component

        21.6.4. By Sales Channel

    21.7. Spain Market Value and Volume Analysis 2017 to 2021 and Forecast 2022 to 2032

        21.7.1. By Product Type

        21.7.2. By Flavor

        21.7.3. By Component

        21.7.4. By Sales Channel

    21.8. Italy Market Value and Volume Analysis 2017 to 2021 and Forecast 2022 to 2032

        21.8.1. By Product Type

        21.8.2. By Flavor

        21.8.3. By Component

        21.8.4. By Sales Channel

    21.9. Germany Market Value and Volume Analysis 2017 to 2021 and Forecast 2022 to 2032

        21.9.1. By Product Type

        21.9.2. By Flavor

        21.9.3. By Component

        21.9.4. By Sales Channel

    21.10. United Kingdom Market Value and Volume Analysis 2017 to 2021 and Forecast 2022 to 2032

        21.10.1. By Product Type

        21.10.2. By Flavor

        21.10.3. By Component

        21.10.4. By Sales Channel

    21.11. South Korea Market Value and Volume Analysis 2017 to 2021 and Forecast 2022 to 2032

        21.11.1. By Product Type

        21.11.2. By Flavor

        21.11.3. By Component

        21.11.4. By Sales Channel

    21.12. China Market Value and Volume Analysis 2017 to 2021 and Forecast 2022 to 2032

        21.12.1. By Product Type

        21.12.2. By Flavor

        21.12.3. By Component

        21.12.4. By Sales Channel

    21.13. Japan Market Value and Volume Analysis 2017 to 2021 and Forecast 2022 to 2032

        21.13.1. By Product Type

        21.13.2. By Flavor

        21.13.3. By Component

        21.13.4. By Sales Channel

    21.14. India Market Value and Volume Analysis 2017 to 2021 and Forecast 2022 to 2032

        21.14.1. By Product Type

        21.14.2. By Flavor

        21.14.3. By Component

        21.14.4. By Sales Channel

    21.15. GCC Countries Market Value and Volume Analysis 2017 to 2021 and Forecast 2022 to 2032

        21.15.1. By Product Type

        21.15.2. By Flavor

        21.15.3. By Component

        21.15.4. By Sales Channel

    21.16. South Africa Market Value and Volume Analysis 2017 to 2021 and Forecast 2022 to 2032

        21.16.1. By Product Type

        21.16.2. By Flavor

        21.16.3. By Component

        21.16.4. By Sales Channel

    21.17. Australia Market Value and Volume Analysis 2017 to 2021 and Forecast 2022 to 2032

        21.17.1. By Product Type

        21.17.2. By Flavor

        21.17.3. By Component

        21.17.4. By Sales Channel

22. Market Structure Analysis

    22.1. Company Dashboard

    22.2. Industry Structure Analysis by Tier of Companies, 2021E

        22.2.1. % tier 1 market players

        22.2.2. % tier 2 market players

        22.2.3. % tier 3 market players

    22.3. Company Share Analysis of Top Players, 2021E

        22.3.1. By Product Type

        22.3.2. By Region

    22.4. Market Presence Analysis

        22.4.1. Regional Footprint of Players

        22.4.2. Product Footprint by Players

        22.4.3. Channel Footprint by Players

23. Competition Deep Dive (Tentative List)

    23.1. CAN

            23.1.1.1. Overview

            23.1.1.2. Product Portfolio

            23.1.1.3. Profitability by Market Segments

            23.1.1.4. Sales Footprint

            23.1.1.5. SWOT Analysis

            23.1.1.6. Strategy Overview

                23.1.1.6.1. Product Strategy

                23.1.1.6.2. Channel Strategy

    23.2. Artet

            23.2.1.1. Overview

            23.2.1.2. Product Portfolio

            23.2.1.3. Profitability by Market Segments

            23.2.1.4. Sales Footprint

            23.2.1.5. SWOT Analysis

            23.2.1.6. Strategy Overview

                23.2.1.6.1. Product Strategy

                23.2.1.6.2. Channel Strategy

    23.3. Phivida Holdings Inc.

            23.3.1.1. Overview

            23.3.1.2. Product Portfolio

            23.3.1.3. Profitability by Market Segments

            23.3.1.4. Sales Footprint

            23.3.1.5. SWOT Analysis

            23.3.1.6. Strategy Overview

                23.3.1.6.1. Product Strategy

                23.3.1.6.2. Channel Strategy

    23.4. The Alkaline Water Company

            23.4.1.1. Overview

            23.4.1.2. Product Portfolio

            23.4.1.3. Profitability by Market Segments

            23.4.1.4. Sales Footprint

            23.4.1.5. SWOT Analysis

            23.4.1.6. Strategy Overview

                23.4.1.6.1. Product Strategy

                23.4.1.6.2. Channel Strategy

    23.5. VCC Brands

            23.5.1.1. Overview

            23.5.1.2. Product Portfolio

            23.5.1.3. Profitability by Market Segments

            23.5.1.4. Sales Footprint

            23.5.1.5. SWOT Analysis

            23.5.1.6. Strategy Overview

                23.5.1.6.1. Product Strategy

                23.5.1.6.2. Channel Strategy

    23.6. Koios Beverage Corporation

            23.6.1.1. Overview

            23.6.1.2. Product Portfolio

            23.6.1.3. Profitability by Market Segments

            23.6.1.4. Sales Footprint

            23.6.1.5. SWOT Analysis

            23.6.1.6. Strategy Overview

                23.6.1.6.1. Product Strategy

                23.6.1.6.2. Channel Strategy

    23.7. Keef Brand

            23.7.1.1. Overview

            23.7.1.2. Product Portfolio

            23.7.1.3. Profitability by Market Segments

            23.7.1.4. Sales Footprint

            23.7.1.5. SWOT Analysis

            23.7.1.6. Strategy Overview

                23.7.1.6.1. Product Strategy

                23.7.1.6.2. Channel Strategy

    23.8. Dixie Brands Inc.

            23.8.1.1. Overview

            23.8.1.2. Product Portfolio

            23.8.1.3. Profitability by Market Segments

            23.8.1.4. Sales Footprint

            23.8.1.5. SWOT Analysis

            23.8.1.6. Strategy Overview

                23.8.1.6.1. Product Strategy

                23.8.1.6.2. Channel Strategy

    23.9. Aphria

            23.9.1.1. Overview

            23.9.1.2. Product Portfolio

            23.9.1.3. Profitability by Market Segments

            23.9.1.4. Sales Footprint

            23.9.1.5. SWOT Analysis

            23.9.1.6. Strategy Overview

                23.9.1.6.1. Product Strategy

                23.9.1.6.2. Channel Strategy

    23.10. Hexo Corp

            23.10.1.1. Overview

            23.10.1.2. Product Portfolio

            23.10.1.3. Profitability by Market Segments

            23.10.1.4. Sales Footprint

            23.10.1.5. SWOT Analysis

            23.10.1.6. Strategy Overview

                23.10.1.6.1. Product Strategy

                23.10.1.6.2. Channel Strategy

    23.11. Canopy Growth

            23.11.1.1. Overview

            23.11.1.2. Product Portfolio

            23.11.1.3. Profitability by Market Segments

            23.11.1.4. Sales Footprint

            23.11.1.5. SWOT Analysis

            23.11.1.6. Strategy Overview

                23.11.1.6.1. Product Strategy

                23.11.1.6.2. Channel Strategy

    23.12. Other Players (on Additional Request)

            23.12.1.1. Overview

            23.12.1.2. Product Portfolio

            23.12.1.3. Profitability by Market Segments

            23.12.1.4. Sales Footprint

            23.12.1.5. SWOT Analysis

            23.12.1.6. Strategy Overview

                23.12.1.6.1. Product Strategy

                23.12.1.6.2. Channel Strategy

 Note: Above list is subject to change during the course of the study

24. Assumptions and Acronyms Used

25. Research Methodology
Recommendations

Food and Beverage

Energy Drink Market

December 2021

REP-GB-11625

April 2024

315 pages

Food and Beverage

Low Fat Drinks Market

September 2024

REP-GB-13088

Upcoming

Explore Food and Beverage Insights

View Reports