Cannabis Beverages Market Outlook (2023 to 2033)

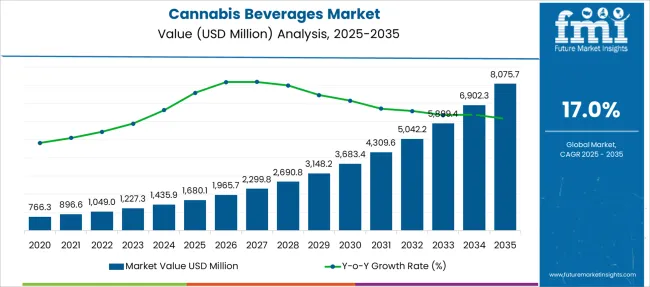
The adoption of the cannabis beverages market is expected to increase at a CAGR of 17.00% during the forecast period. The cannabis beverages market size is anticipated to rise from US$ 1,227.3 Million in 2023 to US$ 5,899.5 Million by 2033.

For a long time, cannabis was mostly used for medicinal purposes. However, in recent years, marijuana use has expanded to include consumable drinks such as cannabis-based beverages.

Cannabis beverage companies have entered the market to meet the growing demand for CBD products. Taking illegal consumption into account, recreational cannabis use is far superior to medicinal cannabis use.

Due to general public efforts to legalize marijuana for both medical and recreational uses, the industry's interest in CBD-based products has soared. Cannabidiol (CBD)-infused beverages are becoming more and more well-liked among consumers because of their non-psychoactive effects.

Furthermore, users prefer these beverages over marijuana smoking and the consumption of cannabis-infused brownies, cookies, chocolates, and confectioneries. Clubs, hotels, restaurants, cafés, and lounges are examples of off-trade sales channels that are likely to raise client interest in the product. While the sector has so far been able to function within the odd, frequently obscure regulations governing the production, marketing, and sale of its products, state and federal laws have significantly impeded growth. Since laws differ so greatly from state to state, all company functions, including logistics and fundraising, are more complex in this industry.

Attribute Details
Cannabis Beverages Market Estimated Size (2023) US$ 1,227.3 Million
Cannabis Beverages Market CAGR (2023 to 2033) 17.00%
Cannabis Beverages Market Forecasted Size (2033) US$ 5,899.5 Million

Declining sales of alcohol and soft drinks reflect a shift in customer taste for beverage use. Alcohol businesses are refocusing on marijuana in order to get a larger market share through Research and Development spending and the introduction of new products.

Despite the fact that millennials are the primary consumers of cannabis-infused products, Gen Z is quickly catching up due to the health benefits offered by these components.

Don't pay for what you don't need

Customize your report by selecting specific countries or regions and save 30%!

Top 2 Influences Affecting the Cannabis Beverages Market

  • Cannabis as a Wellness Option

Consumers concerned about their health are becoming increasingly Cali sober, a term that sounds antiquated but describes replacing alcohol intake with "less damaging" substitutes like cannabis. Alcohol makers should know that the cannabis-infused beverage sector primarily emphasizes wellness and health in their product promotion. Industry leaders are taking advantage of cultural shifts that make many consumers reevaluate their consumption of alcohol, sugar, and other substances. Marketing teams promote cannabis-infused beverages as a "health option" that can aid in improved sleep and relaxation because they lack alcohol and frequently have few calories.

  • Expansion of eCommerce Channels Would Assist Market Growth

There is a significant increase in demand for cannabis-infused beverages via e-commerce platforms that offer a high degree of autonomy, privacy, and accessibility in product selection. Cannabis sales have increased from regulated dispensaries, opening up many opportunities for specialized retailers to present delicious and creative drinks infused with some active principles from cannabis. Furthermore, these distribution channels intend to serve as the go-to place for cannabis-based edibles and aid their growth.

What are the Key Restraints Affecting the Cannabis Beverages Market Growth?

  • The strengths and purity of CBD products might differ between brands and even within a single brand. As a result, it could lead to less-than-ideal results and might not get FDA clearance. Their usage is, therefore, prohibited in several nations.
  • The market for cannabis beverages may be hampered by a few health issues related to marijuana use, such as acute anxiety, fear, distrust, panic, risk of depression, and memory lapses. Furthermore, low awareness among the general public is likely to be a significant obstacle to market growth.
Nandini Roy Choudhury

Principal Consultant

Talk to Analyst

Find your sweet spots for generating winning opportunities in this market.

Chemical-free to Create Better Sales Opportunities

Cannabis users are no longer satisfied with smoking flowers with joints, bongs, or pipes; instead, they have a growing preference for new products, including concentrated and infused items. As a result, the beverage sector is going through a necessary shift.

Customers, especially those in the developed markets of North America and Europe, are consistently establishing the category of organic and chemical-free, as well as detectable and herbal formulation trends and advancements. This is expected to support the market for cannabis beverages in the coming years.

Category-wise Insights of Cannabis Beverages

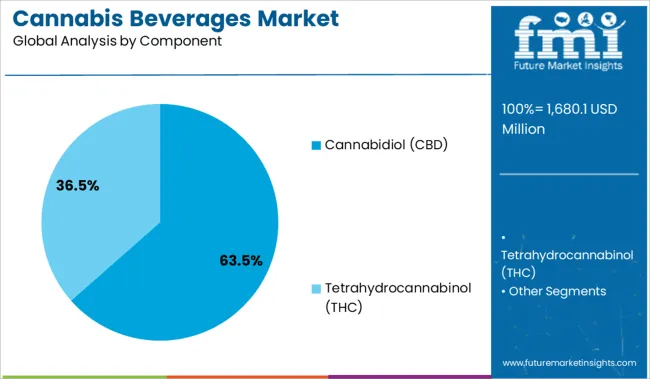
Why CBD Beverages are Emerging as Mainstream Products in the Component Segment?

Cannabis beverages with CBD as an ingredient saw the most substantial rise of 17.8% in 2021. Due to CBD's non-psychoactive qualities, the demand is also anticipated to increase over the projected time. Drinks containing CBD have fewer psychotropic side effects, increasing their potential for treatment in medical conditions. Like the probiotic kombucha, many customers are exploring CBD beverages as wellness and anti-inflammatory goods.

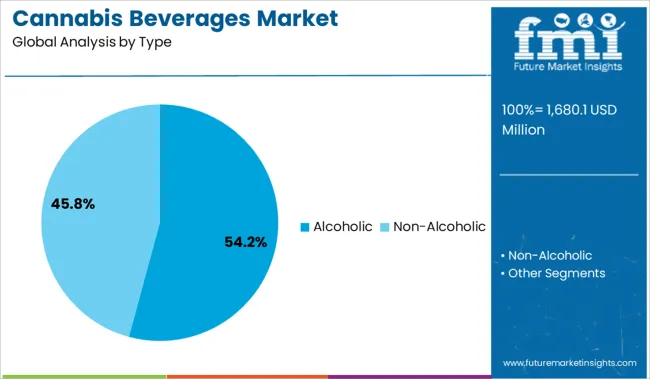
Non-alcoholic Segment to Capture around 50.1% of the Market

In 2023, it is anticipated that non-alcoholic cannabis beverages could represent the most significant and fastest-growing market as customers invest more in wellness drinks. The demand for non-alcoholic cannabis beverages is also increasing as more people have opened to trying new flavors and edibles. Non-alcoholic cannabis-infused beverages such as teas, drops, elixirs, water, carbonated beverages, energy drinks, lemonade, and fruit drinks are more popular among customers looking for healthy beverages.
Get the data you need at a Fraction of the cost

Personalize your report by choosing insights you need
and save 40%!

Regional Analysis of Cannabis Beverages Market

Favorable Policies led by Authorities in the Region to Augment Market Growth

The largest market share for cannabis beverages is held by North America, which also commands the top spot in the industry. In 2020, this region was expected to generate US$527.83 Million. The functional beverage market in the USA dominated the industry, where a sharp growth curve is exhibited.

Europe is Projected to be the Next Big Destination for the Cannabis Market

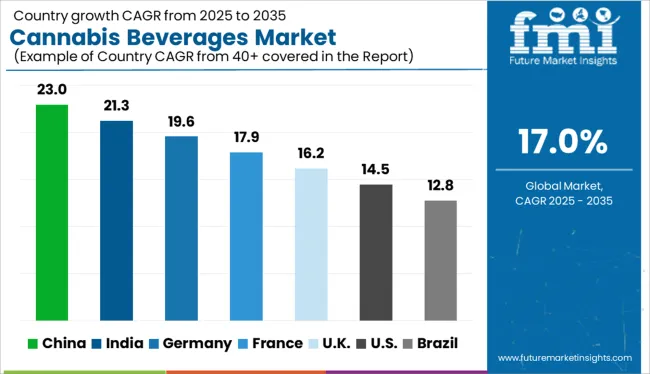
The regional market's rapid growth can be attributed to rising consumer demand for these beverages. According to the Cannabis Trade Association, many regional businesses are working to develop new products to meet the growing demand for wellness beverages. Marijuana-friendly restaurants and cafes in the Netherlands are also expected to contribute to demand opportunities. A noticeable increase in cannabis tourism across the country is expected to boost demand for these products even more. The European market is expected to account for 41% of the global platform in the coming years.

Startup Ecosystem

Cann, a Cannabis-infused Beverage Company, Sells 150,000 Units and Raises US$ 5 Million in Funding

Cann, a cannabis beverage firm that positions itself as a pleasant substitute for alcohol, is increasing funding as it introduces the product to Canada, its first venture into the foreign market. The company offers a wide range of products, some of which are only available in certain areas. These products include THC-infused syrups, which can be combined with tonic water or used as a component in cannabis cocktails.

Of course, Cann is constrained in what markets it can enter by more general cannabis regulation. Currently, the firm offers its goods in Illinois, Massachusetts, Nevada, California, and Massachusetts. Their debut in the Ontario market marks the beginning of their expansion into Canada.
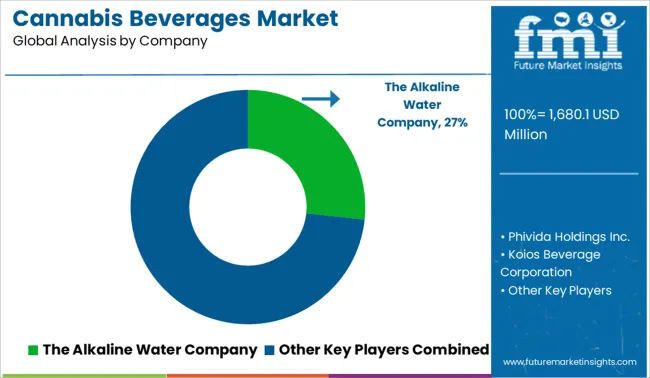
Competitive Landscape

The dominant competitors in the market employ various strategies to strengthen their position as the industry's top businesses. One such effective strategy is acquiring companies to increase brand value among consumers. Intermittently offering ground-breaking products after thoroughly analyzing the market and its target audience is another crucial tactic.

For instance, Molecule Holdings Inc. launched Molecule Crafted, a line of specialty beverages with cannabis infusions, in Canada in April 2021. These cannabis beverages have few calories and come in exotic and potent flavors.

Some of the Key Players Operating in Cannabis Beverages Market Include

  • Canopy Growth Corporation (Canada)
  • The Cronos Group (Canada)
  • Tilray. (USA)
  • Hexo (Canada)
  • CannTrust (Canada)
  • Aurora Cannabis Inc. (Canada)
  • GW Pharmaceuticals plc. (United Kingdom)
  • VIVO Cannabis Inc. (Canada)
  • Alkaline88, (USA)
  • NewAge Inc. (USA)
  • Cannara. (Canada)
  • Dixie Brands (USA)
  • KANNAWAY LLC. (USA)

Latest Developments in the Cannabis Beverages Market

In August 2021, Cann, a California-based producer of THC beverages, announced the release of Passion Peach Mate, a unique and exclusive caffeinated cannabis beverage. The producer created this line of products to give consumers who are looking for alternatives to alcoholic beverages all-natural caffeine with a trace amount of THC.

Beverage Giants are Eyeing for Capitalizing Cannabis Beverage Industry

Cannabidiol, or CBD as it is more commonly known, is a substance derived from cannabis that Coca-Cola Inc. (COKE) is considering incorporating into functional wellness beverages around the world. According to a preliminary study, CBD provides considerable medical benefits for treating neurological illnesses. Additionally, it is non-psychoactive, which means that it has no adverse effects on one's awareness of their surroundings.

Constellation Brands (STZ), the company behind the best-selling Corona and Modelo beers, entered the cannabis market last year by purchasing a 10% interest in Canopy Growth Corp., the country's most prominent cannabis producer (CGC). The beer business reportedly intends to create cannabis-infused beverages.

Two further breweries have joined the cannabis movement. Heineken, a Dutch brewer, introduced Hi-Fi Hops through its Lagunitas American brand, which is sold at a few California medicinal marijuana clinics. The beverage, which has a beer-likEflavor, substitutes tetrahydrocannabinol (THC), a psychoactive component of cannabis, for alcohol.

The Molson Coors Brewing Company (TAP), based in Denver, has teamed with the Canadian brand Hydropothecary. Following legalization, both businesses intend to "pursue chances to manufacture non-alcoholic, cannabis-infused beverages for the Canadian market."

Scope of the Report

Attribute Details
Growth Rate CAGR of 17.00% from 2023 to 2033
Base Year of Estimation 2023
Historical Data 2018 to 2022
Forecast Period 2023 to 2033
Quantitative Units Revenue in US$ Million and Volume in Units and F-CAGR from 2022 to 2032
Report Coverage Revenue Forecast, Volume Forecast, Company Ranking, Competitive Landscape, growth factors, Trends, and Pricing Analysis
Key Segments Covered
  • By Type
  • By Component
  • By Region
Regions Covered
  • North America
  • Latin America
  • Europe
  • East Asia
  • South Asia
  • Middle East & Africa
  • Oceania
Key Countries Profiled
  • USA
  • Canada
  • Brazil
  • Mexico
  • Germany
  • Italy
  • France
  • United Kingdom
  • Spain
  • Russia
  • China
  • Japan
  • India
  • GCC Countries
  • Australia
Key Companies Profiled
  • Canopy Growth Corporation (Canada)
  • The Cronos Group (Canada)
  • Tilray. (USA)
  • Hexo (Canada)
  • CannTrust (Canada)
  • Aurora Cannabis Inc. (Canada)
  • GW Pharmaceuticals plc. (United Kingdom)
  • VIVO Cannabis Inc. (Canada)
  • Alkaline88, (USA)
  • NewAge Inc. (USA)
  • Cannara. (Canada)
  • Dixie Brands (USA)
  • KANNAWAY LLC. (USA)

Key Segments Covered in the Cannabis Beverages Market Report

By Type:

  • Alcoholic
  • Non-Alcoholic

By Component:

  • Cannabidiol (CBD)
  • Tetrahydrocannabinol (THC)

By Region:

  • North America
  • Latin America
  • Western Europe
  • Eastern Europe
  • Asia Pacific excluding Japan (APEJ)
  • Japan
  • Middle East & Africa (MEA)

Frequently Asked Questions

What is the Estimated Cannabis Beverages Market Value in 2023?

The global Cannabis Beverages market is estimated to be valued at US$ 1,227.3 Million in 2023.

What is the Growth Outlook of Global Cannabis Beverages Market?

The Cannabis Beverages market is likely to grow at a CAGR of 17.00% from 2023 to 2033.

What is the Projected Value of Cannabis Beverages Market by 2033?

The Cannabis Beverages market is projected to reach a valuation of US$ 5,899.5 Million by 2033.

Which Region Dominates the Global Cannabis Beverages Market?

North America is projected to lead the global Cannabis Beverages market by 2033.

Table of Content
1. Executive Summary | Cannabis Beverages Market
    1.1. Global Market Outlook
    1.2. Demand-side Trends
    1.3. Supply-side Trends
    1.4. Technology Roadmap Analysis
    1.5. Analysis and Recommendations
2. Market Overview
    2.1. Market Coverage / Taxonomy
    2.2. Market Definition / Scope / Limitations
3. Market Background
    3.1. Market Dynamics
        3.1.1. Drivers
        3.1.2. Restraints
        3.1.3. Opportunity
        3.1.4. Trends
    3.2. Scenario Forecast
        3.2.1. Demand in Optimistic Scenario
        3.2.2. Demand in Likely Scenario
        3.2.3. Demand in Conservative Scenario
    3.3. Opportunity Map Analysis
    3.4. Product Life Cycle Analysis
    3.5. Supply Chain Analysis
        3.5.1. Supply Side Participants and their Roles
            3.5.1.1. Producers
            3.5.1.2. Mid-Level Participants (Traders/ Agents/ Brokers)
            3.5.1.3. Wholesalers and Distributors
        3.5.2. Value Added and Value Created at Node in the Supply Chain
        3.5.3. List of Raw Material Suppliers
        3.5.4. List of Existing and Potential Buyers
    3.6. Investment Feasibility Matrix
    3.7. Value Chain Analysis
        3.7.1. Profit Margin Analysis
        3.7.2. Wholesalers and Distributors
        3.7.3. Retailers
    3.8. PESTLE and Porter’s Analysis
    3.9. Regulatory Landscape
        3.9.1. By Key Regions
        3.9.2. By Key Countries
    3.10. Regional Parent Market Outlook
    3.11. Production and Consumption Statistics
    3.12. Import and Export Statistics
4. Global Market Analysis 2018 to 2022 and Forecast, 2023 to 2033
    4.1. Historical Market Size Value (US$ Million) & Volume (Litres) Analysis, 2018 to 2022
    4.2. Current and Future Market Size Value (US$ Million) & Volume (Litres) Projections, 2023 to 2033
        4.2.1. Y-o-Y Growth Trend Analysis
        4.2.2. Absolute $ Opportunity Analysis
5. Global Market Analysis 2018 to 2022 and Forecast 2023 to 2033, By Type
    5.1. Introduction / Key Findings
    5.2. Historical Market Size Value (US$ Million) & Volume (Litres) Analysis By Type, 2018 to 2022
    5.3. Current and Future Market Size Value (US$ Million) & Volume (Litres) Analysis and Forecast By Type, 2023 to 2033
        5.3.1. Alcoholic
        5.3.2. Non-Alcoholic
    5.4. Y-o-Y Growth Trend Analysis By Type, 2018 to 2022
    5.5. Absolute $ Opportunity Analysis By Type, 2023 to 2033
6. Global Market Analysis 2018 to 2022 and Forecast 2023 to 2033, By Component
    6.1. Introduction / Key Findings
    6.2. Historical Market Size Value (US$ Million) & Volume (Litres) Analysis By Component, 2018 to 2022
    6.3. Current and Future Market Size Value (US$ Million) & Volume (Litres) Analysis and Forecast By Component, 2023 to 2033
        6.3.1. Cannabidiol (CBD)
        6.3.2. Tetrahydrocannabinol (THC)
    6.4. Y-o-Y Growth Trend Analysis By Component, 2018 to 2022
    6.5. Absolute $ Opportunity Analysis By Component, 2023 to 2033
7. Global Market Analysis 2018 to 2022 and Forecast 2023 to 2033, By Region
    7.1. Introduction
    7.2. Historical Market Size Value (US$ Million) & Volume (Litres) Analysis By Region, 2018 to 2022
    7.3. Current Market Size Value (US$ Million) & Volume (Litres) Analysis and Forecast By Region, 2023 to 2033
        7.3.1. North America
        7.3.2. Latin America
        7.3.3. Europe
        7.3.4. Asia Pacific
        7.3.5. Middle East and Africa(MEA)
    7.4. Market Attractiveness Analysis By Region
8. North America Market Analysis 2018 to 2022 and Forecast 2023 to 2033, By Country
    8.1. Historical Market Size Value (US$ Million) & Volume (Litres) Trend Analysis By Market Taxonomy, 2018 to 2022
    8.2. Market Size Value (US$ Million) & Volume (Litres) Forecast By Market Taxonomy, 2023 to 2033
        8.2.1. By Country
            8.2.1.1. USA
            8.2.1.2. Canada
        8.2.2. By Type
        8.2.3. By Component
    8.3. Market Attractiveness Analysis
        8.3.1. By Country
        8.3.2. By Type
        8.3.3. By Component
    8.4. Key Takeaways
9. Latin America Market Analysis 2018 to 2022 and Forecast 2023 to 2033, By Country
    9.1. Historical Market Size Value (US$ Million) & Volume (Litres) Trend Analysis By Market Taxonomy, 2018 to 2022
    9.2. Market Size Value (US$ Million) & Volume (Litres) Forecast By Market Taxonomy, 2023 to 2033
        9.2.1. By Country
            9.2.1.1. Brazil
            9.2.1.2. Mexico
            9.2.1.3. Rest of Latin America
        9.2.2. By Type
        9.2.3. By Component
    9.3. Market Attractiveness Analysis
        9.3.1. By Country
        9.3.2. By Type
        9.3.3. By Component
    9.4. Key Takeaways
10. Europe Market Analysis 2018 to 2022 and Forecast 2023 to 2033, By Country
    10.1. Historical Market Size Value (US$ Million) & Volume (Litres) Trend Analysis By Market Taxonomy, 2018 to 2022
    10.2. Market Size Value (US$ Million) & Volume (Litres) Forecast By Market Taxonomy, 2023 to 2033
        10.2.1. By Country
            10.2.1.1. Germany
            10.2.1.2. United Kingdom
            10.2.1.3. France
            10.2.1.4. Spain
            10.2.1.5. Italy
            10.2.1.6. Rest of Europe
        10.2.2. By Type
        10.2.3. By Component
    10.3. Market Attractiveness Analysis
        10.3.1. By Country
        10.3.2. By Type
        10.3.3. By Component
    10.4. Key Takeaways
11. Asia Pacific Market Analysis 2018 to 2022 and Forecast 2023 to 2033, By Country
    11.1. Historical Market Size Value (US$ Million) & Volume (Litres) Trend Analysis By Market Taxonomy, 2018 to 2022
    11.2. Market Size Value (US$ Million) & Volume (Litres) Forecast By Market Taxonomy, 2023 to 2033
        11.2.1. By Country
            11.2.1.1. China
            11.2.1.2. Japan
            11.2.1.3. South Korea
            11.2.1.4. Singapore
            11.2.1.5. Thailand
            11.2.1.6. Indonesia
            11.2.1.7. Australia
            11.2.1.8. New Zealand
            11.2.1.9. Rest of Asia Pacific
        11.2.2. By Type
        11.2.3. By Component
    11.3. Market Attractiveness Analysis
        11.3.1. By Country
        11.3.2. By Type
        11.3.3. By Component
    11.4. Key Takeaways
12. MEA Market Analysis 2018 to 2022 and Forecast 2023 to 2033, By Country
    12.1. Historical Market Size Value (US$ Million) & Volume (Litres) Trend Analysis By Market Taxonomy, 2018 to 2022
    12.2. Market Size Value (US$ Million) & Volume (Litres) Forecast By Market Taxonomy, 2023 to 2033
        12.2.1. By Country
            12.2.1.1. GCC Countries
            12.2.1.2. South Africa
            12.2.1.3. Israel
            12.2.1.4. Rest of Middle East and Africa(MEA)
        12.2.2. By Type
        12.2.3. By Component
    12.3. Market Attractiveness Analysis
        12.3.1. By Country
        12.3.2. By Type
        12.3.3. By Component
    12.4. Key Takeaways
13. Key Countries Market Analysis
    13.1. USA
        13.1.1. Pricing Analysis
        13.1.2. Market Share Analysis, 2022
            13.1.2.1. By Type
            13.1.2.2. By Component
    13.2. Canada
        13.2.1. Pricing Analysis
        13.2.2. Market Share Analysis, 2022
            13.2.2.1. By Type
            13.2.2.2. By Component
    13.3. Brazil
        13.3.1. Pricing Analysis
        13.3.2. Market Share Analysis, 2022
            13.3.2.1. By Type
            13.3.2.2. By Component
    13.4. Mexico
        13.4.1. Pricing Analysis
        13.4.2. Market Share Analysis, 2022
            13.4.2.1. By Type
            13.4.2.2. By Component
    13.5. Germany
        13.5.1. Pricing Analysis
        13.5.2. Market Share Analysis, 2022
            13.5.2.1. By Type
            13.5.2.2. By Component
    13.6. United Kingdom
        13.6.1. Pricing Analysis
        13.6.2. Market Share Analysis, 2022
            13.6.2.1. By Type
            13.6.2.2. By Component
    13.7. France
        13.7.1. Pricing Analysis
        13.7.2. Market Share Analysis, 2022
            13.7.2.1. By Type
            13.7.2.2. By Component
    13.8. Spain
        13.8.1. Pricing Analysis
        13.8.2. Market Share Analysis, 2022
            13.8.2.1. By Type
            13.8.2.2. By Component
    13.9. Italy
        13.9.1. Pricing Analysis
        13.9.2. Market Share Analysis, 2022
            13.9.2.1. By Type
            13.9.2.2. By Component
    13.10. China
        13.10.1. Pricing Analysis
        13.10.2. Market Share Analysis, 2022
            13.10.2.1. By Type
            13.10.2.2. By Component
    13.11. Japan
        13.11.1. Pricing Analysis
        13.11.2. Market Share Analysis, 2022
            13.11.2.1. By Type
            13.11.2.2. By Component
    13.12. South Korea
        13.12.1. Pricing Analysis
        13.12.2. Market Share Analysis, 2022
            13.12.2.1. By Type
            13.12.2.2. By Component
    13.13. Singapore
        13.13.1. Pricing Analysis
        13.13.2. Market Share Analysis, 2022
            13.13.2.1. By Type
            13.13.2.2. By Component
    13.14. Thailand
        13.14.1. Pricing Analysis
        13.14.2. Market Share Analysis, 2022
            13.14.2.1. By Type
            13.14.2.2. By Component
    13.15. Indonesia
        13.15.1. Pricing Analysis
        13.15.2. Market Share Analysis, 2022
            13.15.2.1. By Type
            13.15.2.2. By Component
    13.16. Australia
        13.16.1. Pricing Analysis
        13.16.2. Market Share Analysis, 2022
            13.16.2.1. By Type
            13.16.2.2. By Component
    13.17. New Zealand
        13.17.1. Pricing Analysis
        13.17.2. Market Share Analysis, 2022
            13.17.2.1. By Type
            13.17.2.2. By Component
    13.18. GCC Countries
        13.18.1. Pricing Analysis
        13.18.2. Market Share Analysis, 2022
            13.18.2.1. By Type
            13.18.2.2. By Component
    13.19. South Africa
        13.19.1. Pricing Analysis
        13.19.2. Market Share Analysis, 2022
            13.19.2.1. By Type
            13.19.2.2. By Component
    13.20. Israel
        13.20.1. Pricing Analysis
        13.20.2. Market Share Analysis, 2022
            13.20.2.1. By Type
            13.20.2.2. By Component
14. Market Structure Analysis
    14.1. Competition Dashboard
    14.2. Competition Benchmarking
    14.3. Market Share Analysis of Top Players
        14.3.1. By Regional
        14.3.2. By Type
        14.3.3. By Component
15. Competition Analysis
    15.1. Competition Deep Dive
        15.1.1. The Alkaline Water Company
            15.1.1.1. Overview
            15.1.1.2. Product Portfolio
            15.1.1.3. Profitability by Market Segments
            15.1.1.4. Sales Footprint
            15.1.1.5. Strategy Overview
                15.1.1.5.1. Marketing Strategy
                15.1.1.5.2. Product Strategy
                15.1.1.5.3. Channel Strategy
        15.1.2. Phivida Holdings Inc.
            15.1.2.1. Overview
            15.1.2.2. Product Portfolio
            15.1.2.3. Profitability by Market Segments
            15.1.2.4. Sales Footprint
            15.1.2.5. Strategy Overview
                15.1.2.5.1. Marketing Strategy
                15.1.2.5.2. Product Strategy
                15.1.2.5.3. Channel Strategy
        15.1.3. Koios Beverage Corporation
            15.1.3.1. Overview
            15.1.3.2. Product Portfolio
            15.1.3.3. Profitability by Market Segments
            15.1.3.4. Sales Footprint
            15.1.3.5. Strategy Overview
                15.1.3.5.1. Marketing Strategy
                15.1.3.5.2. Product Strategy
                15.1.3.5.3. Channel Strategy
        15.1.4. Dixie Brands Inc.
            15.1.4.1. Overview
            15.1.4.2. Product Portfolio
            15.1.4.3. Profitability by Market Segments
            15.1.4.4. Sales Footprint
            15.1.4.5. Strategy Overview
                15.1.4.5.1. Marketing Strategy
                15.1.4.5.2. Product Strategy
                15.1.4.5.3. Channel Strategy
        15.1.5. Keef Brand
            15.1.5.1. Overview
            15.1.5.2. Product Portfolio
            15.1.5.3. Profitability by Market Segments
            15.1.5.4. Sales Footprint
            15.1.5.5. Strategy Overview
                15.1.5.5.1. Marketing Strategy
                15.1.5.5.2. Product Strategy
                15.1.5.5.3. Channel Strategy
        15.1.6. Hexo Corp.
            15.1.6.1. Overview
            15.1.6.2. Product Portfolio
            15.1.6.3. Profitability by Market Segments
            15.1.6.4. Sales Footprint
            15.1.6.5. Strategy Overview
                15.1.6.5.1. Marketing Strategy
                15.1.6.5.2. Product Strategy
                15.1.6.5.3. Channel Strategy
        15.1.7. MedReleaf Corp.
            15.1.7.1. Overview
            15.1.7.2. Product Portfolio
            15.1.7.3. Profitability by Market Segments
            15.1.7.4. Sales Footprint
            15.1.7.5. Strategy Overview
                15.1.7.5.1. Marketing Strategy
                15.1.7.5.2. Product Strategy
                15.1.7.5.3. Channel Strategy
        15.1.8. Vivo Cannabis Inc.
            15.1.8.1. Overview
            15.1.8.2. Product Portfolio
            15.1.8.3. Profitability by Market Segments
            15.1.8.4. Sales Footprint
            15.1.8.5. Strategy Overview
                15.1.8.5.1. Marketing Strategy
                15.1.8.5.2. Product Strategy
                15.1.8.5.3. Channel Strategy
        15.1.9. Canopy Growth
            15.1.9.1. Overview
            15.1.9.2. Product Portfolio
            15.1.9.3. Profitability by Market Segments
            15.1.9.4. Sales Footprint
            15.1.9.5. Strategy Overview
                15.1.9.5.1. Marketing Strategy
                15.1.9.5.2. Product Strategy
                15.1.9.5.3. Channel Strategy
        15.1.10. Aphria Inc.
            15.1.10.1. Overview
            15.1.10.2. Product Portfolio
            15.1.10.3. Profitability by Market Segments
            15.1.10.4. Sales Footprint
            15.1.10.5. Strategy Overview
                15.1.10.5.1. Marketing Strategy
                15.1.10.5.2. Product Strategy
                15.1.10.5.3. Channel Strategy
        15.1.11. GW Pharmaceutical, PLc.
            15.1.11.1. Overview
            15.1.11.2. Product Portfolio
            15.1.11.3. Profitability by Market Segments
            15.1.11.4. Sales Footprint
            15.1.11.5. Strategy Overview
                15.1.11.5.1. Marketing Strategy
                15.1.11.5.2. Product Strategy
                15.1.11.5.3. Channel Strategy
16. Assumptions & Acronyms Used
17. Research Methodology
Recommendations

Food and Beverage

Cannabis Concentrate Market

November 2024

REP-GB-7499

Upcoming

Food and Beverage

Cannabis Drinks Market

October 2022

REP-GB-15262

300 pages

Explore Food and Beverage Insights

View Reports
Future Market Insights

Cannabis Beverages Market

Schedule a Call