Cannabis Packaging Equipment Market Outlook 2025 to 2035

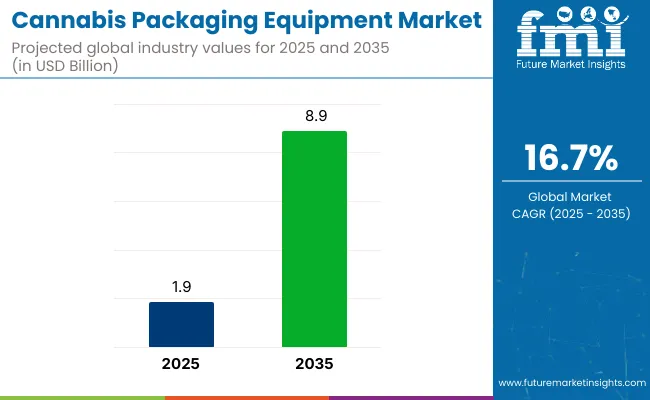
The cannabis packaging equipment market is projected to grow from USD 1.9 billion in 2025 to USD 8.9 billion by 2035, registering a CAGR of 16.7% during the forecast period. Sales in 2024 reached USD 1.6 billion, reflecting steady growth driven by increasing demand for efficient and compliant packaging solutions in the cannabis industry.
Quick Stats of Cannabis Packaging Equipment Market

  • Market Value (2025): USD 1.9 billion
  • Forecast Value (2035): USD 8.9 billion
  • Forecast CAGR: 16.7%
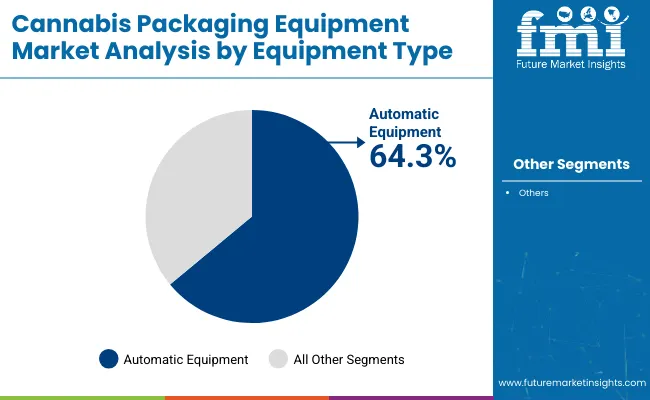
  • Equipment type Leader in 2025: Automatic Equipment (64.3% market share)
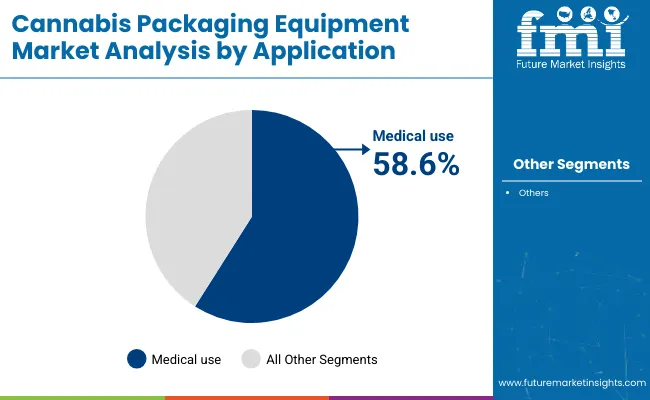
  • Top Application: Medical use (58.6% share)
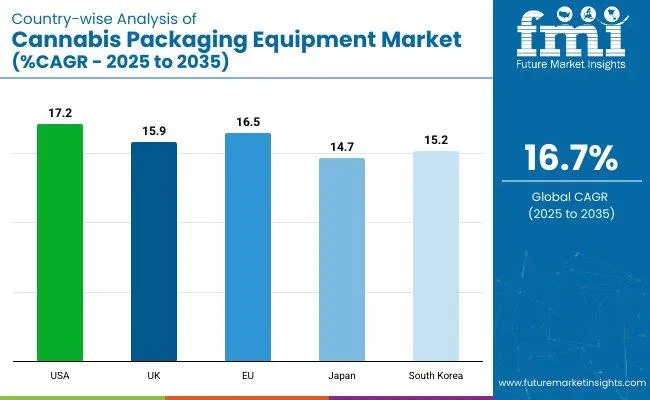
  • Key Growth Region: North America (USA is the fastest-growing market with 17.2% CAGR)

Cannabis Packaging Equipment Market

Attribute Value
Market Size in 2025 USD 1.9 billion
Market Size in 2035 USD 8.9 billion
CAGR (2025 to 2035) 16.7%

This growth is attributed to the rising legalization of cannabis for medical and recreational use across various regions, necessitating advanced packaging systems that ensure product integrity, safety, and regulatory compliance. The market's expansion is further supported by innovations in packaging technologies, automation, and sustainability initiatives.

Green Vault Systems (GVS), a leading manufacturer of cannabis weighing and packaging equipment asn Phat Panda announced partnership. Phat Panda, a premier cannabis grower and processor based in Washington State. Tyler Miller, Phat Panda Director of Facilities, explains the challenges the company faced with a competitor’s equipment before switching to Green Vault Systems’ equipment. “Making the change to Green Vault Systems increased our overall efficiency and output,” Tyler says, adding that the repairs for the competitor’s equipment were also difficult, resulting in considerable downtime for Phat Panda.

Environmental responsibility is increasingly shaping the cannabis packaging equipment market, as manufacturers concentrate on developing machines capable of processing biodegradable and recyclable packaging materials. Innovations include the development of energy-efficient machines, integration of smart technologies for real-time monitoring, and the use of advanced materials to enhance the environmental friendliness of packaging.

Additionally, advancements in automation and modular designs are improving the efficiency and flexibility of packaging lines, enabling manufacturers to meet the evolving needs of the cannabis industry. These innovations align with global sustainability goals and regulatory requirements, making cannabis packaging equipment an attractive option for environmentally conscious producers.

The cannabis packaging equipment market is expected to expand rapidly, propelled by the rising need for automated, regulatory-compliant, and eco-friendly packaging solutions within the cannabis sector. Companies investing in innovative technologies, such as smart packaging systems and modular machinery, are expected to gain a competitive edge.

The market's expansion is further supported by the growing legalization of cannabis across various regions and the rising consumer preference for packaged cannabis products. With continuous advancements in materials and manufacturing processes, the cannabis packaging equipment market is set to offer lucrative opportunities for stakeholders over the forecast period.

Analyzing Cannabis Packaging Equipment Market by Top Investment Segment

The market has been segmented based on equipment type, application, and region. By equipment type, automatic equipment and semi-automatic equipment have been adopted to support scalability, precision, and operational flexibility in cannabis packaging processes.

Applications have been categorized into medical use, recreational use, and others, where packaging machinery has been utilized to meet dosage accuracy, compliance, and branding requirements. Regional segmentation has been structured to include North America, Latin America, Europe, South Asia, East Asia, Oceania, and the Middle East & Africa to reflect varying regulatory landscapes and cannabis legalization trends.
Automatic Equipment Adopted for Speed, Precision, and Reduced Labor Dependency

Cannabis Packaging Equipment Market Analysis By Equipment Type

The automatic equipment segment is expected to hold the largest share of 64.3% in the cannabis packaging equipment market by 2025, as its use has been driven by high-volume processing demands and labor optimization. Fully integrated systems for weighing, filling, sealing, and labeling have been deployed across licensed facilities seeking GMP compliance.

Equipment reliability, throughput consistency, and tamper-proof output have been prioritized for premium and regulated product formats. Packaging speed and accuracy have been enhanced to meet the growing scale of cannabis operations in legal markets.

Downtime and human error have been minimized through programmable logic controllers and smart sensor integration. Strain-specific packaging runs have been executed efficiently using automated SKU switching capabilities. Capital investments have been justified by long-term cost savings and quality assurance needs. The dominance of automatic systems has been reinforced by rapid legalization trends and brand competition in standardized cannabis formats.
Medical Use Segment Drives Growth through Regulatory Packaging Demands

Cannabis Packaging Equipment Market Analysis By Application

The medical use segment is projected to account for a 58.6% share of the cannabis packaging equipment market in 2025, driven by strict compliance, patient safety, and dosage traceability. Tamper-evident closures, child-resistant formats, and batch-level labeling have been mandated across medical cannabis packaging lines.

Packaging machines compatible with opaque bottles, blister packs, and pre-measured sachets have been adopted to meet prescription-grade standards. Real-time serialization and barcode tracking have been implemented for pharmacovigilance and recall readiness.

Sterile barrier packaging and contamination controls have been enhanced to maintain clinical-grade handling protocols. Patient-specific product delivery and extended shelf life have been supported through nitrogen-flush and vacuum sealing technologies. Integration with EMR systems and pharmacy management software has improved distribution traceability. Market dominance has been maintained as global health authorities expand access to therapeutic cannabis treatments.

Challenges and Opportunities

Challenge

Regulatory Uncertainty and Compliance Costs

Another key challenge in the cannabis packaging equipment market is the dynamic regulatory environment. Laws around cannabis vary from place to place, with some countries and states legalizing its medical and recreational use, while others have strict restrictions. These inconsistencies in things like child-resistant packaging requirements, label mandates, and sustainability guidelines make things complex for equipment manufacturers as well as cannabis businesses.

Adhering to a constantly evolving regulatory framework adds to the operational costs of cannabis packaging firms. Businesses are regularly required to replace equipment and infrastructure to meet new standards that come into play, which drives up capital expenditure. Also, failing to comply with regulations can lead to costly fines or product recalls, both of which affect profitability.

To meet this challenge, cannabis packaging equipment manufacturers need to remain on top of regulatory updates and create flexible, modular solutions. Investing in research and development to develop packaging systems complying with several regional requirements will keep businesses on the right side of compliance without continuous expensive upgrades. The best practices include working closely with industry associations and regulatory bodies to future-proof their model and processes.

Opportunity

Growing Demand for Sustainable and Automated Packaging Solutions

As cannabis is increasingly legalized across the globe, the need for efficient cannabis packaging that is automatic and sustainable is on the rise. As a fast-growing industry, the cannabis companies are investing in the packaging capital for better productivity, lesser labour costs, and promoting standardization of products. Cannabis packaging equipment filling, labelling and sealing systems, for example are automated, so they speed up production, increase accuracy and reduce human error.

Cannabis packaging sustainability too has been identified as a significant concern. Consumers and regulators alike are increasingly demanding the use of eco-friendly solutions like biodegradable packaging, recyclable products, and reduced plastic usage. But, for the sake of sustainability, cannabis companies are spending on packaging equipment that is more conducive to sustainable initiatives such as automated machinery made to support compostable materials or packaging lines designed to prevent waste.

Businesses that utilize clean, green, customizable packaging solutions and save money on energy costs for consumers will have a leg up. Smart packaging and tamper-evident packaging, biodegradable materials, and other solutions will help propel the transformation of cannabis packaging equipment.
Country-wise Outlook

Cannabis Packaging Equipment Market Country Wise Analysis

United States

As the legal cannabis movement continues to grow, alongside increasingly stringent packaging regulations, we've come to the conclusion that our data will help drive the development of the USA cannabis packaging equipment market. As more states legalize both medical and recreational cannabis, the need for sophisticated, compliant and efficient packaging solutions is climbing. Innovations in child-resistant, tamper-proof, and sustainable packaging are forcing manufacturers to spend on automated packaging machinery.

Additionally, the rise of cannabis-infused drinks, edibles, and vapes, is driving this need for specialized packaging equipment. Development of the market is coupled with the presence of large cannabis companies and packaging technology companies in the USA.

Country CAGR (2025 to 2035)
USA 17.2%

United Kingdom

While cannabis is largely illegal within the UK, the medical cannabis sector is increasingly dominating the market, increasing the demand for compliant packaging equipment. As more patients gain access to cannabis-based medicines, pharmaceutical-grade packaging solutions are starting to become more prevalent.

The regulatory framework in the UK government imposes strict labelling, child-proofing, and tamper-evident packaging requirements, thus posing an opportunity for cannabis packaging equipment. Moreover, increasing consumption

Country CAGR (2025 to 2035)
UK 15.9%

European Union

Cannabis packaging equipment has recorded healthy growth over the past decade and this translucency is pushed by the growing leisure and medical cannabis market in countries like Germany, France, and The Netherlands, thus country is evolving as a key market for revenue generation for cannabis packaging equipment.

Demand for automated, compliant packaging solutions is being driven by strict EU regulations on pharmaceutical packaging standards. Companies are investing in new filling, sealing and labelling machinery to support the explosion in cannabis-derived wellness and pharmaceutical products. Additionally, the increase in cannabis related research and development in Europe is driving innovation in packaging technology.

Country CAGR (2025 to 2035)
European Union (EU) 16.5%

Japan

Stringent cannabis regulations make the Japanese cannabis packaging equipment market relatively small. But this nation has a rising appetite for CBD-linked health and wellness products and specific packaging needs. With Japan slowly gaining traction towards medical cannabis applications, pharmaceutical grade packaging equipment is expected to have gradual yet steady growth. Japanese Market: Niche opportunities for high precision, tamper proof packaging solutions for cannabis-derived products

Country CAGR (2025 to 2035)
Japan 14.7%

South Korea

Cannabis-based medicines have limited acceptance in South Korea, where a much regulated cannabis market exists. The growing sale of institutions for CBD-infused products is fuelling the demand for high-quality packaging solutions. Tempering with this demand, however, is strict government regulations with respect to product safety, labelling and compliance, which are providing a lucrative opportunity for automated packaging equipment manufacturers. Further, the country’s advanced technology in packaging machinery has contributed to the emergence of precision cannabis packaging solutions.

Country CAGR (2025 to 2035)
South Korea 15.2%

Competitive Outlook

As of today, data-based analysts drive on the cannabis packaging equipment market at large due to the growing legalization of cannabis for medical and recreational use and the demand for regulatory compliance, automated, tamper-proof, and child-proof packaging; the key driving factors for the cannabis packaging market.

An instance of a machine with multiple packaging forms is the all-purpose filler and sealing machines while prominent transformation areas comprise precision filling & sealing machines, sustainable packaging, and high-speed automated labelling or wrapping systems. Businesses are focusing on compliant-driven solutions that also drive improvements in efficiency while adhering to changing industry standards.

Key Players

  • Marijuana Packaging (Includes pre-roll tube filling, vacuum sealing, and tamper-proof packaging machines)
  • Duravant (Automated weighing, sorting and bagging equipment for cannabis processors and distributors)
  • PAC Machinery (Heat sealing, vacuum packaging, and automated bagging for cannabis and hemp products)
  • Jornen Machinery (Creates blister packaging technologies for both cannabis-infused foods and medicines)
  • All-Fill Inc. (Specializes in precision powder-filling and weighing equipment for cannabis concentrates and edibles)

Key Segmentation

By Equipment Type:

  • Automatic Equipment
  • SEMI- Automatic Equipment

By Application:

  • Medical use
  • Recreational use
  • Others

By Region:

  • North America
  • Latin America
  • Europe
  • South Asia
  • East Asia
  • Oceania
  • Middle East & Africa

Table of Content

  1. Executive Summary
    • Global Market Outlook
    • Demand-side Trends
    • Supply-side Trends
    • Technology Roadmap Analysis
    • Analysis and Recommendations
  2. Market Overview
    • Market Coverage / Taxonomy
    • Market Definition / Scope / Limitations
  3. Market Background
    • Market Dynamics
      • Drivers
      • Restraints
      • Opportunity
      • Trends
    • Scenario Forecast
      • Demand in Optimistic Scenario
      • Demand in Likely Scenario
      • Demand in Conservative Scenario
    • Opportunity Map Analysis
    • Product Life Cycle Analysis
    • Supply Chain Analysis
      • Supply Side Participants and their Roles
        • Producers
        • Mid-Level Participants (Traders/ Agents/ Brokers)
        • Wholesalers and Distributors
      • Value Added and Value Created at Node in the Supply Chain
      • List of Raw Material Suppliers
      • List of Existing and Potential Buyer’s
    • Investment Feasibility Matrix
    • Value Chain Analysis
      • Profit Margin Analysis
      • Wholesalers and Distributors
      • Retailers
    • PESTLE and Porter’s Analysis
    • Regulatory Landscape
      • By Key Regions
      • By Key Countries
    • Regional Parent Market Outlook
    • Production and Consumption Statistics
    • Import and Export Statistics
  4. Global Market Analysis 2020 to 2024 and Forecast, 2025 to 2035
    • Historical Market Size Value (USD Billion) & Volume (Units) Analysis, 2020 to 2024
    • Current and Future Market Size Value (USD Billion) & Volume (Units) Projections, 2025 to 2035
      • Y-o-Y Growth Trend Analysis
      • Absolute $ Opportunity Analysis
  5. Global Market Pricing Analysis 2020 to 2024 and Forecast 2025 to 2035
  6. Global Market Analysis 2020 to 2024 and Forecast 2025 to 2035, By Equipment type
    • Introduction / Key Findings
    • Historical Market Size Value (USD Billion) & Volume (Units) Analysis By Equipment type, 2020 to 2024
    • Current and Future Market Size Value (USD Billion) & Volume (Units) Analysis and Forecast By Equipment type, 2025 to 2035
      • Automatic Equipment
      • SEMI-Automatic Equipment
    • Y-o-Y Growth Trend Analysis By Equipment type, 2020 to 2024
    • Absolute $ Opportunity Analysis By Equipment type, 2025 to 2035
  7. Global Market Analysis 2020 to 2024 and Forecast 2025 to 2035, By Application
    • Introduction / Key Findings
    • Historical Market Size Value (USD Billion) & Volume (Units) Analysis By Application, 2020 to 2024
    • Current and Future Market Size Value (USD Billion) & Volume (Units) Analysis and Forecast By Application, 2025 to 2035
      • Medical use
      • Recreational use
      • Others
    • Y-o-Y Growth Trend Analysis By Application, 2020 to 2024
    • Absolute $ Opportunity Analysis By Application, 2025 to 2035
  8. Global Market Analysis 2020 to 2024 and Forecast 2025 to 2035, By Region
    • Introduction
    • Historical Market Size Value (USD Billion) & Volume (Units) Analysis By Region, 2020 to 2024
    • Current Market Size Value (USD Billion) & Volume (Units) Analysis and Forecast By Region, 2025 to 2035
      • North America
      • Latin America
      • Europe
      • East Asia
      • South Asia
      • Oceania
      • MEA
    • Market Attractiveness Analysis By Region
  9. North America Market Analysis 2020 to 2024 and Forecast 2025 to 2035, By Country
    • Historical Market Size Value (USD Billion) & Volume (Units) Trend Analysis By Market Taxonomy, 2020 to 2024
    • Market Size Value (USD Billion) & Volume (Units) Forecast By Market Taxonomy, 2025 to 2035
      • By Country
        • U.S.
        • Canada
      • By Equipment type
      • By Application
    • Market Attractiveness Analysis
      • By Country
      • By Equipment type
      • By Application
    • Key Takeaways
  10. Latin America Market Analysis 2020 to 2024 and Forecast 2025 to 2035, By Country
    • Historical Market Size Value (USD Billion) & Volume (Units) Trend Analysis By Market Taxonomy, 2020 to 2024
    • Market Size Value (USD Billion) & Volume (Units) Forecast By Market Taxonomy, 2025 to 2035
      • By Country
        • Brazil
        • Mexico
        • Argentina
        • Chile
        • Peru
        • Rest of Latin America
      • By Equipment type
      • By Application
    • Market Attractiveness Analysis
      • By Country
      • By Equipment type
      • By Application
    • Key Takeaways
  11. Europe Market Analysis 2020 to 2024 and Forecast 2025 to 2035, By Country
    • Historical Market Size Value (USD Billion) & Volume (Units) Trend Analysis By Market Taxonomy, 2020 to 2024
    • Market Size Value (USD Billion) & Volume (Units) Forecast By Market Taxonomy, 2025 to 2035
      • By Country
        • Germany
        • Italy
        • France
        • UK
        • Spain
        • Russia
        • BENELUX
        • Rest of Europe
      • By Equipment type
      • By Application
    • Market Attractiveness Analysis
      • By Country
      • By Equipment type
      • By Application
    • Key Takeaways
  12. East Asia Market Analysis 2020 to 2024 and Forecast 2025 to 2035, By Country
    • Historical Market Size Value (USD Billion) & Volume (Units) Trend Analysis By Market Taxonomy, 2020 to 2024
    • Market Size Value (USD Billion) & Volume (Units) Forecast By Market Taxonomy, 2025 to 2035
      • By Country
        • China
        • Japan
        • South Korea
      • By Equipment type
      • By Application
    • Market Attractiveness Analysis
      • By Country
      • By Equipment type
      • By Application
    • Key Takeaways
  13. South Asia Market Analysis 2020 to 2024 and Forecast 2025 to 2035, By Country
    • Historical Market Size Value (USD Billion) & Volume (Units) Trend Analysis By Market Taxonomy, 2020 to 2024
    • Market Size Value (USD Billion) & Volume (Units) Forecast By Market Taxonomy, 2025 to 2035
      • By Country
        • India
        • Thailand
        • Malaysia
        • Indonesia
        • Rest of South Asia
      • By Equipment type
      • By Application
    • Market Attractiveness Analysis
      • By Country
      • By Equipment type
      • By Application
    • Key Takeaways
  14. Oceania Market Analysis 2020 to 2024 and Forecast 2025 to 2035, By Country
    • Historical Market Size Value (USD Billion) & Volume (Units) Trend Analysis By Market Taxonomy, 2020 to 2024
    • Market Size Value (USD Billion) & Volume (Units) Forecast By Market Taxonomy, 2025 to 2035
      • By Country
        • Australia
        • New Zealand
      • By Equipment type
      • By Application
    • Market Attractiveness Analysis
      • By Country
      • By Equipment type
      • By Application
    • Key Takeaways
  15. MEA Market Analysis 2020 to 2024 and Forecast 2025 to 2035, By Country
    • Historical Market Size Value (USD Billion) & Volume (Units) Trend Analysis By Market Taxonomy, 2020 to 2024
    • Market Size Value (USD Billion) & Volume (Units) Forecast By Market Taxonomy, 2025 to 2035
      • By Country
        • GCC
        • Rest of MEA
      • By Equipment type
      • By Application
    • Market Attractiveness Analysis
      • By Country
      • By Equipment type
      • By Application
    • Key Takeaways
  16. Key Countries Market Analysis
    • U.S.
      • Pricing Analysis
      • Market Share Analysis, 2024
        • By Equipment type
        • By Application
    • Canada
      • Pricing Analysis
      • Market Share Analysis, 2024
        • By Equipment type
        • By Application
    • Brazil
      • Pricing Analysis
      • Market Share Analysis, 2024
        • By Equipment type
        • By Application
    • Mexico
      • Pricing Analysis
      • Market Share Analysis, 2024
        • By Equipment type
        • By Application
    • Argentina
      • Pricing Analysis
      • Market Share Analysis, 2024
        • By Equipment type
        • By Application
  17. Market Structure Analysis
    • Competition Dashboard
    • Competition Benchmarking
    • Market Share Analysis of Top Players
      • By Regional
      • By Equipment type
      • By Application
  18. Competition Analysis
    • Competition Deep Dive
      • Cannabis Packaging Machinery
        • Overview
        • Product Portfolio
        • Profitability by Market Segments (Product/Age /Sales Channel/Region)
        • Sales Footprint
        • Strategy Overview
          • Marketing Strategy
          • Product Strategy
          • Channel Strategy
      • Dura-Pack
        • Overview
        • Product Portfolio
        • Profitability by Market Segments (Product/Age /Sales Channel/Region)
        • Sales Footprint
        • Strategy Overview
          • Marketing Strategy
          • Product Strategy
          • Channel Strategy
      • Paxiom
        • Overview
        • Product Portfolio
        • Profitability by Market Segments (Product/Age /Sales Channel/Region)
        • Sales Footprint
        • Strategy Overview
          • Marketing Strategy
          • Product Strategy
          • Channel Strategy
      • Canapa Solutions
        • Overview
        • Product Portfolio
        • Profitability by Market Segments (Product/Age /Sales Channel/Region)
        • Sales Footprint
        • Strategy Overview
          • Marketing Strategy
          • Product Strategy
          • Channel Strategy
      • ActionPac Scales and Automation
        • Overview
        • Product Portfolio
        • Profitability by Market Segments (Product/Age /Sales Channel/Region)
        • Sales Footprint
        • Strategy Overview
          • Marketing Strategy
          • Product Strategy
          • Channel Strategy
      • Ohlson Packaging, Inc.
        • Overview
        • Product Portfolio
        • Profitability by Market Segments (Product/Age /Sales Channel/Region)
        • Sales Footprint
        • Strategy Overview
          • Marketing Strategy
          • Product Strategy
          • Channel Strategy
      • All-Fill Inc.
        • Overview
        • Product Portfolio
        • Profitability by Market Segments (Product/Age /Sales Channel/Region)
        • Sales Footprint
        • Strategy Overview
          • Marketing Strategy
          • Product Strategy
          • Channel Strategy
      • Paxiom
        • Overview
        • Product Portfolio
        • Profitability by Market Segments (Product/Age /Sales Channel/Region)
        • Sales Footprint
        • Strategy Overview
          • Marketing Strategy
          • Product Strategy
          • Channel Strategy
      • Viking Masek Global Packaging
        • Overview
        • Product Portfolio
        • Profitability by Market Segments (Product/Age /Sales Channel/Region)
        • Sales Footprint
        • Strategy Overview
          • Marketing Strategy
          • Product Strategy
          • Channel Strategy
      • WeighPack Systems Inc.
        • Overview
        • Product Portfolio
        • Profitability by Market Segments (Product/Age /Sales Channel/Region)
        • Sales Footprint
        • Strategy Overview
          • Marketing Strategy
          • Product Strategy
          • Channel Strategy
  19. Assumptions & Acronyms Used
  20. Research Methodology

List of Tables

  • Table 1: Global Market Value (USD Billion) Forecast by Region, 2020-2035
  • Table 2: Global Market Volume (Units) Forecast by Region, 2020-2035
  • Table 3: Global Market Value (USD Billion) Forecast by Equipment type, 2020-2035
  • Table 4: Global Market Volume (Units) Forecast by Equipment type, 2020-2035
  • Table 5: Global Market Value (USD Billion) Forecast by Application, 2020-2035
  • Table 6: Global Market Volume (Units) Forecast by Application, 2020-2035
  • Table 7: North America Market Value (USD Billion) Forecast by Country, 2020-2035
  • Table 8: North America Market Volume (Units) Forecast by Country, 2020-2035
  • Table 9: North America Market Value (USD Billion) Forecast by Equipment type, 2020-2035
  • Table 10: North America Market Volume (Units) Forecast by Equipment type, 2020-2035
  • Table 11: North America Market Value (USD Billion) Forecast by Application, 2020-2035
  • Table 12: North America Market Volume (Units) Forecast by Application, 2020-2035
  • Table 13: Latin America Market Value (USD Billion) Forecast by Country, 2020-2035
  • Table 14: Latin America Market Volume (Units) Forecast by Country, 2020-2035
  • Table 15: Latin America Market Value (USD Billion) Forecast by Equipment type, 2020-2035
  • Table 16: Latin America Market Volume (Units) Forecast by Equipment type, 2020-2035
  • Table 17: Latin America Market Value (USD Billion) Forecast by Application, 2020-2035
  • Table 18: Latin America Market Volume (Units) Forecast by Application, 2020-2035
  • Table 19: Europe Market Value (USD Billion) Forecast by Country, 2020-2035
  • Table 20: Europe Market Volume (Units) Forecast by Country, 2020-2035
  • Table 21: Europe Market Value (USD Billion) Forecast by Equipment type, 2020-2035
  • Table 22: Europe Market Volume (Units) Forecast by Equipment type, 2020-2035
  • Table 23: Europe Market Value (USD Billion) Forecast by Application, 2020-2035
  • Table 24: Europe Market Volume (Units) Forecast by Application, 2020-2035
  • Table 25: East Asia Market Value (USD Billion) Forecast by Country, 2020-2035
  • Table 26: East Asia Market Volume (Units) Forecast by Country, 2020-2035
  • Table 27: East Asia Market Value (USD Billion) Forecast by Equipment type, 2020-2035
  • Table 28: East Asia Market Volume (Units) Forecast by Equipment type, 2020-2035
  • Table 29: East Asia Market Value (USD Billion) Forecast by Application, 2020-2035
  • Table 30: East Asia Market Volume (Units) Forecast by Application, 2020-2035
  • Table 31: South Asia Market Value (USD Billion) Forecast by Country, 2020-2035
  • Table 32: South Asia Market Volume (Units) Forecast by Country, 2020-2035
  • Table 33: South Asia Market Value (USD Billion) Forecast by Equipment type, 2020-2035
  • Table 34: South Asia Market Volume (Units) Forecast by Equipment type, 2020-2035
  • Table 35: South Asia Market Value (USD Billion) Forecast by Application, 2020-2035
  • Table 36: South Asia Market Volume (Units) Forecast by Application, 2020-2035
  • Table 37: Oceania Market Value (USD Billion) Forecast by Country, 2020-2035
  • Table 38: Oceania Market Volume (Units) Forecast by Country, 2020-2035
  • Table 39: Oceania Market Value (USD Billion) Forecast by Equipment type, 2020-2035
  • Table 40: Oceania Market Volume (Units) Forecast by Equipment type, 2020-2035
  • Table 41: Oceania Market Value (USD Billion) Forecast by Application, 2020-2035
  • Table 42: Oceania Market Volume (Units) Forecast by Application, 2020-2035
  • Table 43: MEA Market Value (USD Billion) Forecast by Country, 2020-2035
  • Table 44: MEA Market Volume (Units) Forecast by Country, 2020-2035
  • Table 45: MEA Market Value (USD Billion) Forecast by Equipment type, 2020-2035
  • Table 46: MEA Market Volume (Units) Forecast by Equipment type, 2020-2035
  • Table 47: MEA Market Value (USD Billion) Forecast by Application, 2020-2035
  • Table 48: MEA Market Volume (Units) Forecast by Application, 2020-2035

List of Figures

  • Figure 1: Global Market Volume (Units) Forecast 2020-2035
  • Figure 2: Global Market Pricing Analysis
  • Figure 3: Global Market Value (USD Billion) Forecast 2020-2035
  • Figure 4: Global Market Value Share and BPS Analysis by Equipment type, 2025 and 2035
  • Figure 5: Global Market Y-o-Y Growth Comparison by Equipment type, 2025-2035
  • Figure 6: Global Market Attractiveness Analysis by Equipment type
  • Figure 7: Global Market Value Share and BPS Analysis by Application, 2025 and 2035
  • Figure 8: Global Market Y-o-Y Growth Comparison by Application, 2025-2035
  • Figure 9: Global Market Attractiveness Analysis by Application
  • Figure 10: Global Market Value (USD Billion) Share and BPS Analysis by Region, 2025 and 2035
  • Figure 11: Global Market Y-o-Y Growth Comparison by Region, 2025-2035
  • Figure 12: Global Market Attractiveness Analysis by Region
  • Figure 13: North America Market Incremental $ Opportunity, 2025-2035
  • Figure 14: Latin America Market Incremental $ Opportunity, 2025-2035
  • Figure 15: Europe Market Incremental $ Opportunity, 2025-2035
  • Figure 16: East Asia Market Incremental $ Opportunity, 2025-2035
  • Figure 17: South Asia Market Incremental $ Opportunity, 2025-2035
  • Figure 18: Oceania Market Incremental $ Opportunity, 2025-2035
  • Figure 19: MEA Market Incremental $ Opportunity, 2025-2035
  • Figure 20: North America Market Value Share and BPS Analysis by Country, 2025 and 2035
  • Figure 21: North America Market Value Share and BPS Analysis by Equipment type, 2025 and 2035
  • Figure 22: North America Market Y-o-Y Growth Comparison by Equipment type, 2025-2035
  • Figure 23: North America Market Attractiveness Analysis by Equipment type
  • Figure 24: North America Market Value Share and BPS Analysis by Application, 2025 and 2035
  • Figure 25: North America Market Y-o-Y Growth Comparison by Application, 2025-2035
  • Figure 26: North America Market Attractiveness Analysis by Application
  • Figure 27: Latin America Market Value Share and BPS Analysis by Country, 2025 and 2035
  • Figure 28: Latin America Market Value Share and BPS Analysis by Equipment type, 2025 and 2035
  • Figure 29: Latin America Market Y-o-Y Growth Comparison by Equipment type, 2025-2035
  • Figure 30: Latin America Market Attractiveness Analysis by Equipment type
  • Figure 31: Latin America Market Value Share and BPS Analysis by Application, 2025 and 2035
  • Figure 32: Latin America Market Y-o-Y Growth Comparison by Application, 2025-2035
  • Figure 33: Latin America Market Attractiveness Analysis by Application
  • Figure 34: Europe Market Value Share and BPS Analysis by Country, 2025 and 2035
  • Figure 35: Europe Market Value Share and BPS Analysis by Equipment type, 2025 and 2035
  • Figure 36: Europe Market Y-o-Y Growth Comparison by Equipment type, 2025-2035
  • Figure 37: Europe Market Attractiveness Analysis by Equipment type
  • Figure 38: Europe Market Value Share and BPS Analysis by Application, 2025 and 2035
  • Figure 39: Europe Market Y-o-Y Growth Comparison by Application, 2025-2035
  • Figure 40: Europe Market Attractiveness Analysis by Application
  • Figure 41: East Asia Market Value Share and BPS Analysis by Country, 2025 and 2035
  • Figure 42: East Asia Market Value Share and BPS Analysis by Equipment type, 2025 and 2035
  • Figure 43: East Asia Market Y-o-Y Growth Comparison by Equipment type, 2025-2035
  • Figure 44: East Asia Market Attractiveness Analysis by Equipment type
  • Figure 45: East Asia Market Value Share and BPS Analysis by Application, 2025 and 2035
  • Figure 46: East Asia Market Y-o-Y Growth Comparison by Application, 2025-2035
  • Figure 47: East Asia Market Attractiveness Analysis by Application
  • Figure 48: South Asia Market Value Share and BPS Analysis by Country, 2025 and 2035
  • Figure 49: South Asia Market Value Share and BPS Analysis by Equipment type, 2025 and 2035
  • Figure 50: South Asia Market Y-o-Y Growth Comparison by Equipment type, 2025-2035
  • Figure 51: South Asia Market Attractiveness Analysis by Equipment type
  • Figure 52: South Asia Market Value Share and BPS Analysis by Application, 2025 and 2035
  • Figure 53: South Asia Market Y-o-Y Growth Comparison by Application, 2025-2035
  • Figure 54: South Asia Market Attractiveness Analysis by Application
  • Figure 55: Oceania Market Value Share and BPS Analysis by Country, 2025 and 2035
  • Figure 56: Oceania Market Value Share and BPS Analysis by Equipment type, 2025 and 2035
  • Figure 57: Oceania Market Y-o-Y Growth Comparison by Equipment type, 2025-2035
  • Figure 58: Oceania Market Attractiveness Analysis by Equipment type
  • Figure 59: Oceania Market Value Share and BPS Analysis by Application, 2025 and 2035
  • Figure 60: Oceania Market Y-o-Y Growth Comparison by Application, 2025-2035
  • Figure 61: Oceania Market Attractiveness Analysis by Application
  • Figure 62: MEA Market Value Share and BPS Analysis by Country, 2025 and 2035
  • Figure 63: MEA Market Value Share and BPS Analysis by Equipment type, 2025 and 2035
  • Figure 64: MEA Market Y-o-Y Growth Comparison by Equipment type, 2025-2035
  • Figure 65: MEA Market Attractiveness Analysis by Equipment type
  • Figure 66: MEA Market Value Share and BPS Analysis by Application, 2025 and 2035
  • Figure 67: MEA Market Y-o-Y Growth Comparison by Application, 2025-2035
  • Figure 68: MEA Market Attractiveness Analysis by Application
  • Figure 69: Global Market - Tier Structure Analysis
  • Figure 70: Global Market - Company Share Analysis

Frequently Asked Questions

What was the overall size of the Cannabis Packaging Equipment Market in 2025?

The Cannabis Packaging Equipment Market was valued at approximately USD 1.9 billion in 2025.

How big is the Cannabis Packaging Equipment Market expected to be in 2035?

The market is projected to reach USD 8.9 billion by 2035, growing at a compound annual growth rate (CAGR) of 16.7% from 2025 to 2035.

What will drive the demand for Cannabis Packaging Equipment during the forecast period?

The demand for Cannabis Packaging Equipment Market is expected to be driven by the rapid legalization of cannabis products, increasing demand for child-resistant and tamper-evident packaging, the shift towards automation for efficiency and compliance, and the rising adoption of sustainable and biodegradable packaging solutions.

List the top 5 countries contributing to the Cannabis Packaging Equipment Market.

The top 5 countries contributing to the Cannabis Packaging Equipment Market are the United States, Canada, Germany, the Netherlands, and Australia.

Which segment in type is expected to lead in the Cannabis Packaging Equipment Market?

The Automation and Sustainability segment is expected to lead the Cannabis Packaging Equipment market, driven by increasing regulatory requirements, growing investment in automated packaging solutions, and the push for eco-friendly materials in cannabis product packaging.

Explore Similar Insights

Future Market Insights

Cannabis Packaging Equipment Market