Eco Funnel Market Size and Share Forecast Outlook 2025 to 2035

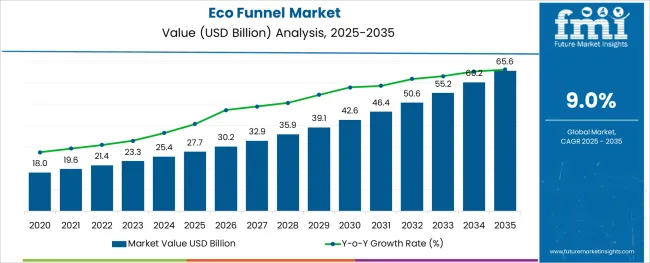
The Eco Funnel Market is estimated to be valued at USD 27.7 billion in 2025 and is projected to reach USD 65.6 billion by 2035, registering a compound annual growth rate (CAGR) of 9.0% over the forecast period.
Quick Stats for Eco Funnel Market

  • Eco Funnel Market Industry Value (2025): USD 27.7 billion
  • Eco Funnel Market Forecast Value (2035): USD 65.6 billion
  • Eco Funnel Market Forecast CAGR: 9.0%
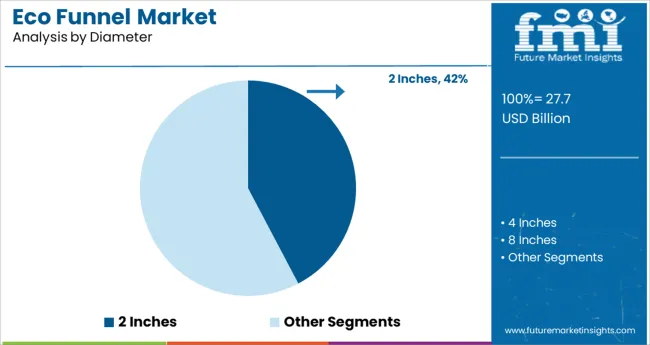
  • Leading Segment in Eco Funnel Market in 2025: 2 Inches (42.3%)
  • Key Growth Region in Eco Funnel Market: North America, Asia-Pacific, Europe
  • Top Key Players in Eco Funnel Market: CP Lab Safety, Chemglass Inc., Cole-Parmer LLC, VWR International, LLC

Eco Funnel Market

Rationale for Segmental Growth in the Eco Funnel Market

Market Overview

The eco funnel market is witnessing sustained growth as laboratories and industrial settings increasingly prioritize spill prevention, chemical handling safety, and regulatory compliance. Heightened focus on environmentally responsible practices has accelerated the adoption of closed system transfer devices such as eco funnels, which help minimize exposure to hazardous fumes and volatile chemicals.

Innovations in funnel design now support seamless integration with various container types and are engineered to comply with strict safety standards. The use of autoclavable materials, threaded connections, and vapor-sealing lids has enhanced operational safety while supporting sustainability goals through reusability.

As laboratory waste management and chemical disposal protocols tighten across the pharmaceutical, academic, and industrial sectors, eco funnels are emerging as standard tools for safety-compliant liquid transfer. Future market expansion is expected to be supported by growth in pharmaceutical R&D, institutional laboratory investments, and evolving regulatory frameworks aimed at minimizing environmental exposure to hazardous substances.

Segmental Analysis

The market is segmented by Diameter, Capacity, and End Use and region. By Diameter, the market is divided into 2 Inches, 4 Inches, and 8 Inches. In terms of Capacity, the market is classified into Up to 500 ML, 501-1000 ML, and Above 1000 ML. Based on End Use, the market is segmented into Pharmaceuticals, Chemicals & Fertilizers, and Automotive. Regionally, the market is classified into North America, Latin America, Western Europe, Eastern Europe, Balkan & Baltic Countries, Russia & Belarus, Central Asia, East Asia, South Asia & Pacific, and the Middle East & Africa.
Insights into the 2 Inches Diameter Segment

Eco Funnel Market Analysis By Diameter

The 2 inches diameter sub segment is projected to hold 42.3% of total revenue in 2025, making it the leading choice in the diameter category. This preference is being driven by its compatibility with a wide range of standard laboratory containers and reagent bottles.

The 2 inches size offers an optimal balance between flow rate and control, enabling safe and efficient transfer of liquids without splashing or overflow. Its dominance is further supported by increased adoption in regulated environments where standardized opening sizes are favored for consistency and cross-equipment compatibility.

The ability to integrate with various closure types and container threads has made this diameter especially popular across institutions and commercial laboratories alike. Additionally, ease of handling and minimal storage requirements reinforce the continued leadership of this subsegment.
Insights into the Up to 500 ML Capacity Segment

Eco Funnel Market Analysis By Capacity

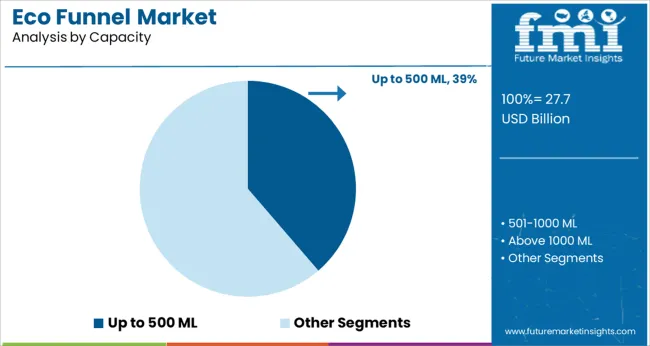
In the capacity category, eco funnels with up to 500 ML capacity are expected to contribute 38.7% of total revenue in 2025, securing their position as the preferred volume range. This is due to their suitability for small to mid-volume transfers, commonly required in analytical and quality control labs.

These funnels offer a compact footprint, which is ideal for benchtop environments where space and precision are priorities. Their reduced size also supports better vapor containment and handling control, which are critical in volatile chemical applications.

Laboratories favoring frequent but low-volume transfers have increasingly opted for the 500 ML and below range to ensure accuracy while minimizing waste. The growing preference for individualized workstations and portable lab setups has further supported the rise of this capacity segment within both academic and commercial research facilities.

Insights into the Pharmaceuticals End Use Segment

The pharmaceuticals segment is anticipated to hold 45.8% of the eco funnel market revenue in 2025, making it the dominant end use category. This is being driven by the pharmaceutical industry’s stringent safety protocols, chemical handling standards, and waste containment requirements.

Eco funnels have become essential tools in GMP-compliant labs for minimizing contamination risks during reagent transfers, sample disposal, and solvent management. The rising demand for cleanroom-compatible and autoclavable equipment has accelerated adoption within R&D, quality assurance, and production environments.

With increased emphasis on workplace safety, environmental health, and waste reduction, pharmaceutical companies are standardizing eco funnel usage across their lab operations. Additionally, regulatory audits and safety inspections are prompting investment in containment tools that align with institutional risk management frameworks. As pharmaceutical R&D expands and facility upgrades continue, this segment is expected to retain its leadership position.

What leads to the growth of the Eco Funnel Market?

The demand for the eco funnel is present in businesses in training & learning institutes, pharmaceuticals, chemicals, automobiles, and many and much similar industrial manufacturing. Due to wide demand and multiple applications, sales of the Eco funnel are extreme.

Sales of the eco funnel have seen a significant increase in recent years, and this trend is expected to continue. Due to an increase in potential customers and emerging growth in each economy around the world, sales of the eco funnel are at heights.

What are the Trends in the Eco Funnel Market?

Demand for the eco funnel is high, as it is required by regulatory authorities such as the Occupational Safety and Health Administration (OSHA) and the Environmental Protection Agency (EPA) in all businesses that employ hazardous chemicals in their operations.

The eco funnel has a strong resistance to harm; it resists all types of corrosion and fire attacks, making it functional for a long time, contributing to greater revenue and higher sales of the eco funnel.
Which is the key Region in the Eco Funnel Market?

Eco Funnel Market Country Value Analysis

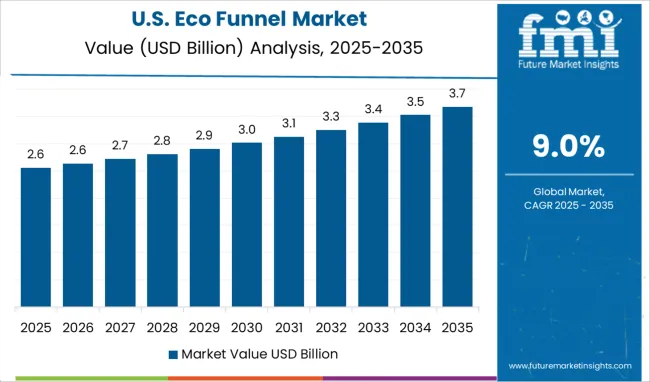
North America has been one of the world's most developed economies, followed by Western Europe. It is likely to provide considerable potential for the eco funnel market, which could be attributed to their high per capita consumption, owing to strict labor regulations.

In the coming years, African and Latin Americans could be important for eco funnel market share. The growth of the hygiene goods industry will be fueled by the disposable income of individuals in emerging economies.

The regional administration will enact stricter safety regulations for the use of dangerous gases and chemicals. In the following years, the overall sales of the eco funnel are predicted to have a positive outlook and grow at a high CAGR.
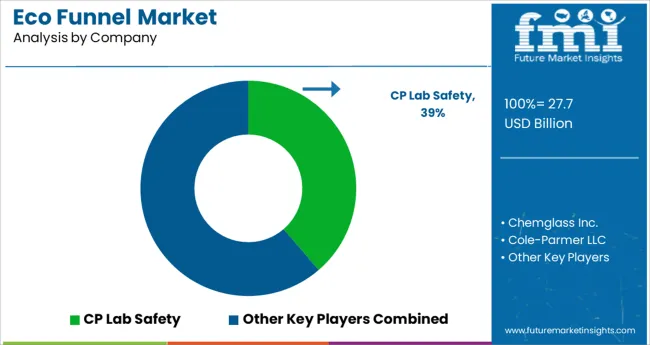
What is the competitive Outlook of the Eco Funnel Market?

Eco Funnel Market Analysis By Company

Some of the key players operating in the eco funnel market are Chemglass Life Sciences LLC, Cole-Parmer, CP Lab Safety, Fisher Scientific, and many others are expected to contribute to the global eco funnel market share in recent years to come.

  • Due to the rapid rise of the majority of economies on an international market as a result of globalization, each company organization has boosted its research and development spending to fulfill the demand for the eco funnel and in order to get a competitive advantage over its competitors.
  • Manufacturers have increased their production capacity to meet the demand for the eco funnel due to an increase in potential customers and emerging growth in each economy of the world.

Report Scope

Report Attribute Details
Growth rate CAGR of 9% from 2025 to 2035
The base year for estimation 2024
Historical data 2020 to 2024
Forecast period 2025 to 2035
Quantitative units Revenue in million and CAGR from 2025 to 2035
Report Coverage Revenue forecast, volume forecast, company ranking, competitive landscape, growth factors, and trends, Pricing Analysis,
Segments Covered Diameter, end uses, region
Regional scope North America; Western Europe; Eastern Europe; Middle East; Africa; ASEAN; South Asia; Rest of Asia; Australia; and New Zealand
Country scope United States of America, Canada, Mexico, Germany, United Kingdom, France, Italy, Spain, Russia, Belgium, Poland, Czech Republic, China, India, Japan, Australia, Brazil, Argentina, Colombia, Saudi Arabia, UAE, Iran, South Africa
Key companies profiled CP Lab Safety; Chemglass Life Sciences LLC; Fisher Scientific; Cole-Parmer
Customization scope Free report customization (equivalent to up to 8 analysts' working days) with purchase. Addition or alteration to country, regional & segment scope.
Pricing and purchase options Avail customized purchase options to meet your exact research needs.

Key Segments in the Eco Funnel Market

By Diameter:

  • 4 inches
  • 8 inches
  • 2 inches

By End Use:

  • Pharmaceuticals Industry
  • Nutraceuticals Industry
  • Chemical Industry
  • Automotive Industry
  • Petrochemical Industry

By Region:

  • North America
  • Latin America
  • Asia Pacific
  • Europe
  • Middle East and Africa

Table of Content

  1. Executive Summary
    • Global Market Outlook
    • Demand-side Trends
    • Supply-side Trends
    • Technology Roadmap Analysis
    • Analysis and Recommendations
  2. Market Overview
    • Market Coverage / Taxonomy
    • Market Definition / Scope / Limitations
  3. Market Background
    • Market Dynamics
      • Drivers
      • Restraints
      • Opportunity
      • Trends
    • Scenario Forecast
      • Demand in Optimistic Scenario
      • Demand in Likely Scenario
      • Demand in Conservative Scenario
    • Opportunity Map Analysis
    • Product Life Cycle Analysis
    • Supply Chain Analysis
    • Investment Feasibility Matrix
    • Value Chain Analysis
    • PESTLE and Porter’s Analysis
    • Regulatory Landscape
    • Regional Parent Market Outlook
    • Production and Consumption Statistics
    • Import and Export Statistics
  4. Global Market Analysis 2020-2024 and Forecast, 2025-2035
    • Historical Market Size Value (USD Million) Analysis, 2020-2024
    • Current and Future Market Size Value (USD Million) Projections, 2025-2035
      • Y-o-Y Growth Trend Analysis
      • Absolute $ Opportunity Analysis
  5. Global Market Pricing Analysis 2020-2024 and Forecast 2025-2035
  6. Global Market Analysis 2020-2024 and Forecast 2025-2035, By Diameter
    • Introduction / Key Findings
    • Historical Market Size Value (USD Million) Analysis By Diameter , 2020-2024
    • Current and Future Market Size Value (USD Million) Analysis and Forecast By Diameter , 2025-2035
      • 2 Inches
      • 4 Inches
      • 8 Inches
    • Y-o-Y Growth Trend Analysis By Diameter , 2020-2024
    • Absolute $ Opportunity Analysis By Diameter , 2025-2035
  7. Global Market Analysis 2020-2024 and Forecast 2025-2035, By Capacity
    • Introduction / Key Findings
    • Historical Market Size Value (USD Million) Analysis By Capacity, 2020-2024
    • Current and Future Market Size Value (USD Million) Analysis and Forecast By Capacity, 2025-2035
      • Up to 500 ML
      • 501-1000 ML
      • Above 1000 ML
    • Y-o-Y Growth Trend Analysis By Capacity, 2020-2024
    • Absolute $ Opportunity Analysis By Capacity, 2025-2035
  8. Global Market Analysis 2020-2024 and Forecast 2025-2035, By End Use
    • Introduction / Key Findings
    • Historical Market Size Value (USD Million) Analysis By End Use, 2020-2024
    • Current and Future Market Size Value (USD Million) Analysis and Forecast By End Use, 2025-2035
      • Pharmaceuticals
      • Chemicals & Fertilizers
      • Automotive
    • Y-o-Y Growth Trend Analysis By End Use, 2020-2024
    • Absolute $ Opportunity Analysis By End Use, 2025-2035
  9. Global Market Analysis 2020-2024 and Forecast 2025-2035, By Region
    • Introduction
    • Historical Market Size Value (USD Million) Analysis By Region, 2020-2024
    • Current Market Size Value (USD Million) Analysis and Forecast By Region, 2025-2035
      • North America
      • Latin America
      • Western Europe
      • Eastern Europe
      • East Asia
      • South Asia and Pacific
      • Middle East & Africa
    • Market Attractiveness Analysis By Region
  10. North America Market Analysis 2020-2024 and Forecast 2025-2035, By Country
    • Historical Market Size Value (USD Million) Trend Analysis By Market Taxonomy, 2020-2024
    • Market Size Value (USD Million) Forecast By Market Taxonomy, 2025-2035
      • By Country
        • U.S.
        • Canada
        • Mexico
      • By Diameter
      • By Capacity
      • By End Use
    • Market Attractiveness Analysis
      • By Country
      • By Diameter
      • By Capacity
      • By End Use
    • Key Takeaways
  11. Latin America Market Analysis 2020-2024 and Forecast 2025-2035, By Country
    • Historical Market Size Value (USD Million) Trend Analysis By Market Taxonomy, 2020-2024
    • Market Size Value (USD Million) Forecast By Market Taxonomy, 2025-2035
      • By Country
        • Brazil
        • Chile
        • Rest of Latin America
      • By Diameter
      • By Capacity
      • By End Use
    • Market Attractiveness Analysis
      • By Country
      • By Diameter
      • By Capacity
      • By End Use
    • Key Takeaways
  12. Western Europe Market Analysis 2020-2024 and Forecast 2025-2035, By Country
    • Historical Market Size Value (USD Million) Trend Analysis By Market Taxonomy, 2020-2024
    • Market Size Value (USD Million) Forecast By Market Taxonomy, 2025-2035
      • By Country
        • Germany
        • U.K.
        • Italy
        • Spain
        • France
        • Nordic
        • BENELUX
        • Rest of Western Europe
      • By Diameter
      • By Capacity
      • By End Use
    • Market Attractiveness Analysis
      • By Country
      • By Diameter
      • By Capacity
      • By End Use
    • Key Takeaways
  13. Eastern Europe Market Analysis 2020-2024 and Forecast 2025-2035, By Country
    • Historical Market Size Value (USD Million) Trend Analysis By Market Taxonomy, 2020-2024
    • Market Size Value (USD Million) Forecast By Market Taxonomy, 2025-2035
      • By Country
        • Russia
        • Poland
        • Hungary
        • Balkan & Baltic
        • Rest of Eastern Europe
      • By Diameter
      • By Capacity
      • By End Use
    • Market Attractiveness Analysis
      • By Country
      • By Diameter
      • By Capacity
      • By End Use
    • Key Takeaways
  14. East Asia Market Analysis 2020-2024 and Forecast 2025-2035, By Country
    • Historical Market Size Value (USD Million) Trend Analysis By Market Taxonomy, 2020-2024
    • Market Size Value (USD Million) Forecast By Market Taxonomy, 2025-2035
      • By Country
        • China
        • Japan
        • South Korea
      • By Diameter
      • By Capacity
      • By End Use
    • Market Attractiveness Analysis
      • By Country
      • By Diameter
      • By Capacity
      • By End Use
    • Key Takeaways
  15. South Asia and Pacific Market Analysis 2020-2024 and Forecast 2025-2035, By Country
    • Historical Market Size Value (USD Million) Trend Analysis By Market Taxonomy, 2020-2024
    • Market Size Value (USD Million) Forecast By Market Taxonomy, 2025-2035
      • By Country
        • India
        • ASEAN
        • Australia & New Zealand
        • Rest of South Asia and Pacific
      • By Diameter
      • By Capacity
      • By End Use
    • Market Attractiveness Analysis
      • By Country
      • By Diameter
      • By Capacity
      • By End Use
    • Key Takeaways
  16. Middle East & Africa Market Analysis 2020-2024 and Forecast 2025-2035, By Country
    • Historical Market Size Value (USD Million) Trend Analysis By Market Taxonomy, 2020-2024
    • Market Size Value (USD Million) Forecast By Market Taxonomy, 2025-2035
      • By Country
        • Kingdom of Saudi Arabia
        • Other GCC Countries
        • Turkiye
        • South Africa
        • Other African Union
        • Rest of Middle East & Africa
      • By Diameter
      • By Capacity
      • By End Use
    • Market Attractiveness Analysis
      • By Country
      • By Diameter
      • By Capacity
      • By End Use
    • Key Takeaways
  17. Key Countries Market Analysis
    • U.S.
      • Pricing Analysis
      • Market Share Analysis, 2024
        • By Diameter
        • By Capacity
        • By End Use
    • Canada
      • Pricing Analysis
      • Market Share Analysis, 2024
        • By Diameter
        • By Capacity
        • By End Use
    • Mexico
      • Pricing Analysis
      • Market Share Analysis, 2024
        • By Diameter
        • By Capacity
        • By End Use
    • Brazil
      • Pricing Analysis
      • Market Share Analysis, 2024
        • By Diameter
        • By Capacity
        • By End Use
    • Chile
      • Pricing Analysis
      • Market Share Analysis, 2024
        • By Diameter
        • By Capacity
        • By End Use
    • Germany
      • Pricing Analysis
      • Market Share Analysis, 2024
        • By Diameter
        • By Capacity
        • By End Use
    • U.K.
      • Pricing Analysis
      • Market Share Analysis, 2024
        • By Diameter
        • By Capacity
        • By End Use
    • Italy
      • Pricing Analysis
      • Market Share Analysis, 2024
        • By Diameter
        • By Capacity
        • By End Use
    • Spain
      • Pricing Analysis
      • Market Share Analysis, 2024
        • By Diameter
        • By Capacity
        • By End Use
    • France
      • Pricing Analysis
      • Market Share Analysis, 2024
        • By Diameter
        • By Capacity
        • By End Use
    • India
      • Pricing Analysis
      • Market Share Analysis, 2024
        • By Diameter
        • By Capacity
        • By End Use
    • ASEAN
      • Pricing Analysis
      • Market Share Analysis, 2024
        • By Diameter
        • By Capacity
        • By End Use
    • Australia & New Zealand
      • Pricing Analysis
      • Market Share Analysis, 2024
        • By Diameter
        • By Capacity
        • By End Use
    • China
      • Pricing Analysis
      • Market Share Analysis, 2024
        • By Diameter
        • By Capacity
        • By End Use
    • Japan
      • Pricing Analysis
      • Market Share Analysis, 2024
        • By Diameter
        • By Capacity
        • By End Use
    • South Korea
      • Pricing Analysis
      • Market Share Analysis, 2024
        • By Diameter
        • By Capacity
        • By End Use
    • Russia
      • Pricing Analysis
      • Market Share Analysis, 2024
        • By Diameter
        • By Capacity
        • By End Use
    • Poland
      • Pricing Analysis
      • Market Share Analysis, 2024
        • By Diameter
        • By Capacity
        • By End Use
    • Hungary
      • Pricing Analysis
      • Market Share Analysis, 2024
        • By Diameter
        • By Capacity
        • By End Use
    • Kingdom of Saudi Arabia
      • Pricing Analysis
      • Market Share Analysis, 2024
        • By Diameter
        • By Capacity
        • By End Use
    • Turkiye
      • Pricing Analysis
      • Market Share Analysis, 2024
        • By Diameter
        • By Capacity
        • By End Use
    • South Africa
      • Pricing Analysis
      • Market Share Analysis, 2024
        • By Diameter
        • By Capacity
        • By End Use
  18. Market Structure Analysis
    • Competition Dashboard
    • Competition Benchmarking
    • Market Share Analysis of Top Players
      • By Regional
      • By Diameter
      • By Capacity
      • By End Use
  19. Competition Analysis
    • Competition Deep Dive
      • CP Lab Safety
        • Overview
        • Product Portfolio
        • Profitability by Market Segments (Product/Age /Sales Channel/Region)
        • Sales Footprint
        • Strategy Overview
          • Marketing Strategy
          • Product Strategy
          • Channel Strategy
      • Chemglass Inc.
      • Cole-Parmer LLC
      • VWR International, LLC
  20. Assumptions & Acronyms Used
  21. Research Methodology

List of Tables

  • Table 1: Global Market Value (USD Million) Forecast by Region, 2020-2035
  • Table 2: North America Market Value (USD Million) Forecast by Country, 2020-2035
  • Table 3: Latin America Market Value (USD Million) Forecast by Country, 2020-2035
  • Table 4: Western Europe Market Value (USD Million) Forecast by Country, 2020-2035
  • Table 5: Eastern Europe Market Value (USD Million) Forecast by Country, 2020-2035
  • Table 6: East Asia Market Value (USD Million) Forecast by Country, 2020-2035
  • Table 7: South Asia and Pacific Market Value (USD Million) Forecast by Country, 2020-2035
  • Table 8: Middle East & Africa Market Value (USD Million) Forecast by Country, 2020-2035

List of Figures

  • Figure 1: Global Market Pricing Analysis
  • Figure 2: Global Market Value (USD Million) Forecast 2020-2035
  • Figure 3: Global Market Value (USD Million) Share and BPS Analysis by Region, 2025 and 2035
  • Figure 4: Global Market Y-o-Y Growth Comparison by Region, 2025-2035
  • Figure 5: Global Market Attractiveness Analysis by Region
  • Figure 6: North America Market Incremental $ Opportunity, 2025-2035
  • Figure 7: Latin America Market Incremental $ Opportunity, 2025-2035
  • Figure 8: Western Europe Market Incremental $ Opportunity, 2025-2035
  • Figure 9: Eastern Europe Market Incremental $ Opportunity, 2025-2035
  • Figure 10: East Asia Market Incremental $ Opportunity, 2025-2035
  • Figure 11: South Asia and Pacific Market Incremental $ Opportunity, 2025-2035
  • Figure 12: Middle East & Africa Market Incremental $ Opportunity, 2025-2035
  • Figure 13: North America Market Value Share and BPS Analysis by Country, 2025 and 2035
  • Figure 14: Latin America Market Value Share and BPS Analysis by Country, 2025 and 2035
  • Figure 15: Western Europe Market Value Share and BPS Analysis by Country, 2025 and 2035
  • Figure 16: Eastern Europe Market Value Share and BPS Analysis by Country, 2025 and 2035
  • Figure 17: East Asia Market Value Share and BPS Analysis by Country, 2025 and 2035
  • Figure 18: South Asia and Pacific Market Value Share and BPS Analysis by Country, 2025 and 2035
  • Figure 19: Middle East & Africa Market Value Share and BPS Analysis by Country, 2025 and 2035
  • Figure 20: Global Market - Tier Structure Analysis
  • Figure 21: Global Market - Company Share Analysis

Frequently Asked Questions

How big is the eco funnel market in 2025?

The global eco funnel market is estimated to be valued at USD 27.7 billion in 2025.

What will be the market size for the eco funnel market in 2035?

It is projected to reach USD 65.6 billion by 2035.

How much will be the CAGR of the eco funnel market between 2025 and 2035?

The market is expected to grow at a 9.0% CAGR between 2025 and 2035.

What are the key product types in the eco funnel market?

The key product types are 2 inches, 4 inches and 8 inches.

Which up to 500 ml segment is expected to dominate the eco funnel market in 2025?

up to 500 ml segment is expected to dominate with a 38.7% industry share in 2025.

Explore Similar Insights

Future Market Insights

Eco Funnel Market