Eco-friendly Bottle Market Size and Share Forecast Outlook 2025 to 2035

The Eco-friendly Bottle Market is estimated to be valued at USD 198.0 million in 2025 and is projected to reach USD 396.8 million by 2035, registering a compound annual growth rate (CAGR) of 7.2% over the forecast period.

The eco-friendly bottle market is witnessing robust growth due to increasing environmental awareness, stringent regulatory measures on plastic usage, and rising consumer preference for sustainable packaging solutions. The current market scenario reflects strong momentum from industries adopting recyclable and biodegradable materials to meet sustainability goals.

Manufacturers are focusing on material innovation, lightweight design, and lifecycle optimization to enhance product performance while reducing carbon footprint. The future outlook remains optimistic, driven by the expansion of beverage and personal care sectors, corporate sustainability commitments, and advancements in biodegradable and compostable technologies.

Demand is also being reinforced by growing adoption in e-commerce and retail packaging, where eco-labeling and brand differentiation are playing key roles The market’s growth rationale is based on the shift toward circular economy practices, government incentives promoting sustainable manufacturing, and consistent consumer demand for environmentally responsible products, ensuring steady long-term expansion across multiple end-use sectors.
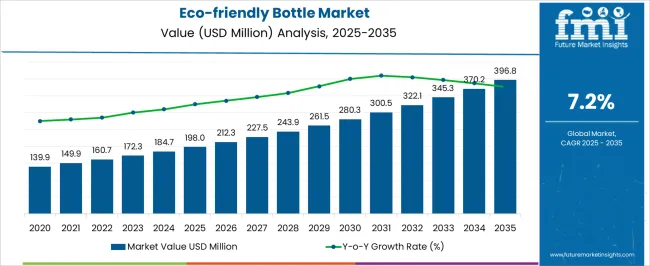
Quick Stats for Eco-friendly Bottle Market

  • Eco-friendly Bottle Market Industry Value (2025): USD 198.0 million
  • Eco-friendly Bottle Market Forecast Value (2035): USD 396.8 million
  • Eco-friendly Bottle Market Forecast CAGR: 7.2%
  • Leading Segment in Eco-friendly Bottle Market in 2025: Paper (36.8%)
  • Key Growth Region in Eco-friendly Bottle Market: North America, Asia-Pacific, Europe
  • Top Key Players in Eco-friendly Bottle Market: Paper Water Bottle, One Green Bottle, Earthlust, Ecologic Brands, SKS Bottle and Packaging, Pachamama, Kanrel, ENSO Bottles, Earth Bottles, SafeBottles, Pepsi-Cola Metropolitan Bottling Company, Cascade Designs Inc.

Eco Friendly Bottle Market Market Value Analysis

Metric Value
Eco-friendly Bottle Market Estimated Value in (2025 E) USD 198.0 million
Eco-friendly Bottle Market Forecast Value in (2035 F) USD 396.8 million
Forecast CAGR (2025 to 2035) 7.2%

Segmental Analysis

The market is segmented by Material, End-Use Industry, and Capacity and region. By Material, the market is divided into Paper, Poly Lactic Acid (PLA), Starch Based, Sugarcane & Bagasse, and Molded Fiber. In terms of End-Use Industry, the market is classified into Beverage, Water, Personal Care & Cosmetics, Pharmaceutical, and Other Industrial. Based on Capacity, the market is segmented into 201 To 500 Ml, Up To 200 Ml, and Above 500 Ml. Regionally, the market is classified into North America, Latin America, Western Europe, Eastern Europe, Balkan & Baltic Countries, Russia & Belarus, Central Asia, East Asia, South Asia & Pacific, and the Middle East & Africa.
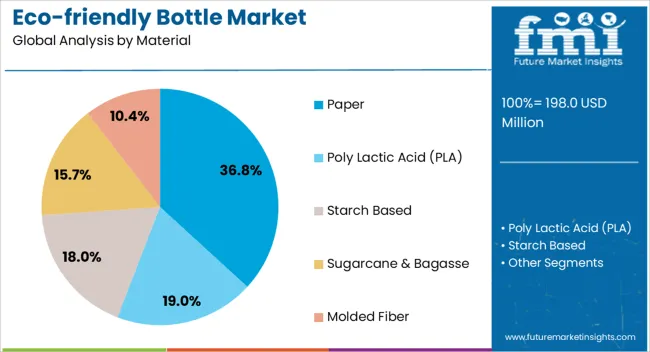
Insights into the Material Segment

Eco Friendly Bottle Market Analysis By Material

The paper segment, accounting for 36.80% of the material category, has been leading the market due to its recyclability, biodegradability, and compatibility with sustainable packaging initiatives. Adoption has been driven by growing regulatory restrictions on single-use plastics and rising demand from beverage and food brands seeking eco-friendly alternatives.

Continuous advancements in coating technologies have improved barrier properties and durability of paper bottles, making them suitable for both dry and liquid products. Production scalability and cost competitiveness have strengthened the segment’s market position.

Increased investment in molded fiber packaging and material innovation is expected to further enhance performance and availability The segment’s sustained dominance reflects the balance between environmental compliance and functional usability, ensuring continued preference among manufacturers transitioning toward sustainable packaging solutions.
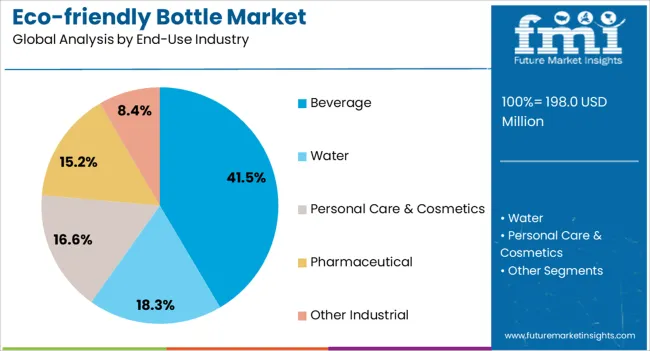
Insights into the End-Use Industry Segment

Eco Friendly Bottle Market Analysis By End Use Industry

The beverage segment, representing 41.50% of the end-use industry category, has maintained a leading share owing to the rapid shift from plastic to biodegradable packaging in soft drinks, juices, and water products. Growing awareness among consumers regarding sustainability and the environmental impact of packaging waste has accelerated demand for eco-friendly bottles.

Beverage manufacturers are increasingly partnering with sustainable material suppliers to align with corporate environmental goals. Market growth is further reinforced by government regulations encouraging the use of renewable packaging and by technological advancements that improve bottle strength, shelf life, and aesthetic appeal.

Expanding consumption in both premium and mass-market beverage categories is expected to maintain steady volume growth, reinforcing the beverage sector’s dominance in the overall eco-friendly bottle market.
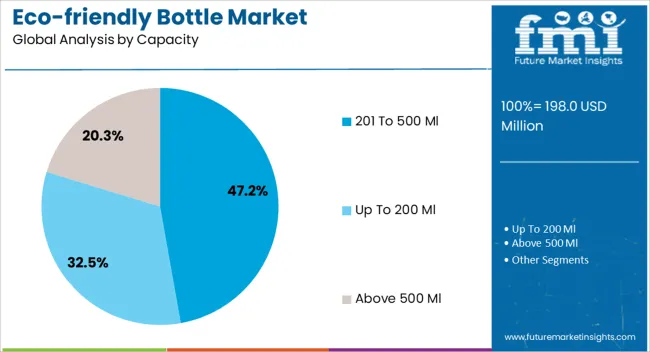
Insights into the Capacity Segment

Eco Friendly Bottle Market Analysis By Capacity

The 201 to 500 ml segment, holding 47.20% of the capacity category, has emerged as the dominant range due to its widespread use in beverages, personal care products, and household consumables. Its popularity is attributed to portability, consumer convenience, and compatibility with on-the-go consumption trends.

Manufacturers have optimized production for this size range, enabling efficient packaging, transportation, and retail placement. Demand is further supported by increasing use in single-serve and travel-friendly formats, particularly among eco-conscious consumers.

Continuous innovation in lightweighting and material flexibility has reduced production costs while maintaining durability The segment’s strong market position is expected to persist as brands continue to emphasize compact, sustainable packaging that aligns with evolving consumer lifestyles and sustainability commitments.

Eco-friendly Bottle Market Overview

  • Sustainability concerns among consumers are the primary factor fueling the growth of the eco-friendly bottle market.
  • School-going children make up a notable consumer base for bottles. With parents becoming increasingly eco-friendly and schools expounding on the benefit of sustainability, eco-friendly bottles are becoming more commonplace in schools.
  • Various regulatory authorities are curbing down on the use of single-use plastic and bottle manufacturers are also coming under the radar of these authorities. Thus, bottle producers are turning to eco-friendly bottles to maintain demand.
  • Eco-friendly bottles are being manufactured with the help of innovative materials, like green plastic or starch. Thus, the introduction of new raw materials is keeping the demand in the market fresh.
  • Aversion to plastic and other materials from which bottles are made which have the potential to seep into the liquid inside is making people more inclined towards the use of eco-friendly bottles.

Eco-friendly Bottle Market Trends

  • Bottle vendors are appealing to customers by offering functions like temperature-reading and cooling in the product. Eco-friendly bottles are also hopping on the trend and providing enhanced features to consumers.
  • Eco-friendly concerns are affecting the packaging industry and suppliers are looking at eco-friendly packaging solutions. Eco-friendly bottle is one such green packaging solution that is being relied upon by packaging industry players.
  • Reusable bottles are winning over consumers and the demand for reusable, eco-friendly bottles is growing.
  • Biodegradability is becoming a prominent concern among consumers and biodegradable bottles are thus building a significant consumer base.
  • By using recycled material, eco-friendly bottle manufacturers are obtaining material on the cheap, while also involving consumers in the manufacturing process. Thus the production of water bottles made from recycled material is increasing.
  • Food & beverage demands of people are ever-expanding, and thus bottles, including eco-friendly bottles, are seeing continuously developing demand.
  • Manufacturers of eco-friendly bottles have to contend with infrastructural challenges. The infrastructure for producing bottles from recycled or plant-based material is not as advanced as it is for traditional bottles, and thus, the production of eco-friendly bottles is still in the developing stage.

Category-wise Outlook

Paper is the topmost material used in the manufacture of eco-friendly bottles. Eco-friendly bottles are predominantly used to store water.

Easy Availability and Use of Paper in the Production of Eco-friendly Bottles

The demand for paper is expected to account for 43.2% of the market share by material in 2025. Factors driving the growth of the paper in the market for eco-friendly bottles are:

  • Paper has already earned the thumbs up from both consumers and manufacturers for other packaging materials and that success is translating into the eco-friendly bottle industry.
  • Paper is easily available, while also providing the requisite toughness desired by manufacturers, thus enabling its ascent atop the material segment.
Attributes Details
Top Material Paper
Market Share (2025) 43.2%

Water Industry to Drive Demand for Eco-friendly Bottles

The water industry is anticipated to account for 62.1% of the market share in 2025. Some of the factors for the growth of the segment are:

  • Water bottles are continuing to gain in popularity, especially with the number of school-going children increasing, and thus the demand for eco-friendly water bottles is rising.
  • With gym-going culture in full flow, water bottles are becoming an important accessory for a considerable number of people, thus propagating the use of eco-friendly bottles.
Attributes Details
Top End-Use Industry Water
Market Share (2025) 62.1%

Country-wise Analysis

The Asia Pacific is set to be an intensely lucrative region for the eco-friendly bottle industry. The growing population of the region is a key factor in the market’s acceleration in the region.

The obsession with innovative packaging is leading the market in Europe. The rise in sustainability standards imposed by the European Union is also motivating bottle manufacturers to produce eco-friendly versions of their products.

Countries CAGR (2025 to 2035)
France 6.8%
India 8.7%
China 7.9%
Thailand 7.5%
South Korea 7.1%

Rising Governmental Restrictions Over the Use of Single-use Plastic in India

The market in India is anticipated to register a CAGR of 8.7% over the forecast period. Some of the factors driving the growth of the market in the country are:

  • The government in India is taking numerous steps to curb the sale and manufacture of single-use plastic. Thus, eco-friendly bottles are emerging as a prominent alternative to plastic bottles in the country.
  • The use of recycled material for eco-friendly bottles is an emerging trend in Indian manufacturing practices.

Use of Local Material in the Manufacture of Eco-friendly Bottles in South Korea

The market in South Korea is set to rise at a CAGR of 7.1% over the forecast period. Prominent factors driving the growth of the market are:

  • South Korean eco-friendly bottle manufacturers are turning towards local materials to produce their products. Thus, the likes of starch and fiber obtained locally are prominent among South Korean manufacturers.
  • Innovative bottles in terms of technology, like temperature showing or quick freeze bottles, are popular in South Korea.

China’s Notable Population Sees the Eco-friendly Bottle Market Thrive in the Country

The market in China is expected to register a CAGR of 7.9% through 2035. Some of the factors driving the growth of the market in China are:

  • China’s humungous population counts among its numbers plenty of people partial to water bottles, from school children to working professionals. Thus, eco-friendly bottles are climbing in popularity in the country.
  • The popularity of green plastic in China is driving the production of green plastic bottles.

Fancy and Colorful Designs on Eco-friendly Bottles Attract Consumers in Thailand

The market in Thailand is set to progress at a CAGR of 7.5% through 2035. The factors influencing the growth of the market in Thailand include:

  • The Thai population is enamored of glamorous designs and paint on bottles. Eco-friendly bottle manufacturers are thus being creative in designing the outside of their bottles.
  • Manufacturers in Thailand are establishing tie-ups with green societies and manufacturing eco-friendly bottles in collaboration with them.

France’s Staunchly Eco-Conscious Population Driving the Market’s Growth

The market in France is expected to register a CAGR of 6.8% over the forecast period. Some of the reasons for the growth of eco-friendly bottles in the country are:
  • From apparel to travel, a significant number of the French population has committed itself to sustainability. This eco-conscious population is thus inclining towards eco-friendly bottles as its preferred mode of storing and drinking drinks.
  • The government and regulatory authorities in France are imposing strict restrictions on the manufacture of environment-harming products. To avoid coming under the sanctions of strict rules, an increasing number of bottle manufacturers are turning towards eco-friendly solutions.

Competitive Landscape in the Eco-friendly Bottle Market

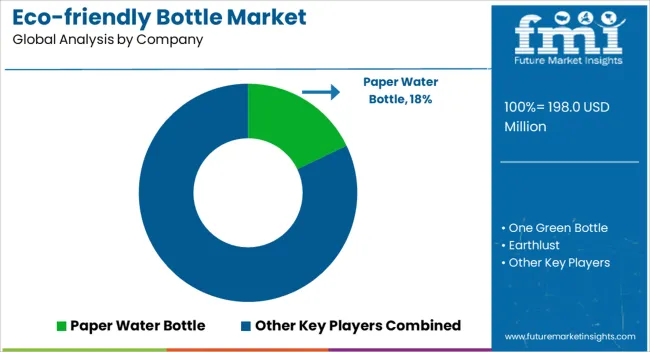
Eco Friendly Bottle Market Analysis By Company

Market players in the eco-friendly bottle landscape are focused on coming up with new materials that ease the production process. For this reason, a considerable amount of money is being poured into Research and Development.

Multinational bottle brands are making their way into the eco-friendly bottle market, sensing the opportunities present for them. Eco-friendly bottle manufacturers are establishing partnerships with companies in the packaging sector to capitalize on opportunities.

Recent Developments in the Eco-friendly Bottle Market

  • In September 2025, the India-based Defence Food Research Laboratory (DFRL) launched a biodegradable water bottle.
  • In 2025, JRE- Slovenija together with Hrastnik 1860 Design Studio launched the REwater bottle. It is a glass bottle that not only highlights the eco-consciousness but also uses illusion to give the effect of the water inside shimmering.
  • Also in 2025, Philippine enterprise BBDO Guerrero introduced the Dissolving Bottles, shampoo bars made in the shape of bottles, eliminating the need for plastic packaging.

Key Companies in the Eco-friendly Bottle Market

  • One Green Bottle
  • Earthlust
  • Ecologic Brands
  • SKS Bottle and Packaging
  • Pachamama
  • Paper Water Bottle
  • Kanrel
  • ENSO Bottles
  • Earth Bottles
  • SafeBottles
  • Pepsi-Cola Metropolitan Bottling Company
  • Cascade Designs Inc.

Key Coverage in the Eco-friendly Bottle Industry Report

  • Eco-friendly Bottle Market Size and Share Analysis
  • Eco-friendly Industry Growth Assessment
  • Reusable Bottle Market Coverage
  • Eco-friendly Water Bottle Market Report
  • Reusable Water Bottles Market Analysis
  • Eco-friendly plastic bottle market assessment

Key Market Segmentation

By Material:

  • Paper
  • Poly Lactic Acid (PLA)
  • Starch Based
  • Sugarcane & Bagasse
  • Molded Fiber

By End-Use Industry:

  • Water
  • Beverage
  • Personal Care & Cosmetics
  • Pharmaceutical
  • Other Industrial

By Capacity:

  • Up to 200 ml
  • 201 to 500 ml
  • Above 500 ml

By Region:

  • North America
  • Latin America
  • Europe
  • South Asia
  • East Asia
  • Oceania
  • Middle East and Africa (MEA)

Frequently Asked Questions

How big is the eco-friendly bottle market in 2025?

The global eco-friendly bottle market is estimated to be valued at USD 198.0 million in 2025.

What will be the size of eco-friendly bottle market in 2035?

The market size for the eco-friendly bottle market is projected to reach USD 396.8 million by 2035.

How much will be the eco-friendly bottle market growth between 2025 and 2035?

The eco-friendly bottle market is expected to grow at a 7.2% CAGR between 2025 and 2035.

What are the key product types in the eco-friendly bottle market?

The key product types in eco-friendly bottle market are paper, poly lactic acid (pla), starch based, sugarcane & bagasse and molded fiber.

Which end-use industry segment to contribute significant share in the eco-friendly bottle market in 2025?

In terms of end-use industry, beverage segment to command 41.5% share in the eco-friendly bottle market in 2025.

Table of Content

  1. Executive Summary
    • Global Market Outlook
    • Demand-side Trends
    • Supply-side Trends
    • Technology Roadmap Analysis
    • Analysis and Recommendations
  2. Market Overview
    • Market Coverage / Taxonomy
    • Market Definition / Scope / Limitations
  3. Market Background
    • Market Dynamics
      • Drivers
      • Restraints
      • Opportunity
      • Trends
    • Scenario Forecast
      • Demand in Optimistic Scenario
      • Demand in Likely Scenario
      • Demand in Conservative Scenario
    • Opportunity Map Analysis
    • Product Life Cycle Analysis
    • Supply Chain Analysis
    • Investment Feasibility Matrix
    • Value Chain Analysis
    • PESTLE and Porter’s Analysis
    • Regulatory Landscape
    • Regional Parent Market Outlook
    • Production and Consumption Statistics
    • Import and Export Statistics
  4. Global Market Analysis 2020 to 2024 and Forecast, 2025 to 2035
    • Historical Market Size Value (USD Million) Analysis, 2020 to 2024
    • Current and Future Market Size Value (USD Million) Projections, 2025 to 2035
      • Y-o-Y Growth Trend Analysis
      • Absolute $ Opportunity Analysis
  5. Global Market Pricing Analysis 2020 to 2024 and Forecast 2025 to 2035
  6. Global Market Analysis 2020 to 2024 and Forecast 2025 to 2035, By Material
    • Introduction / Key Findings
    • Historical Market Size Value (USD Million) Analysis By Material , 2020 to 2024
    • Current and Future Market Size Value (USD Million) Analysis and Forecast By Material , 2025 to 2035
      • Paper
      • Poly Lactic Acid (PLA)
      • Starch Based
      • Sugarcane & Bagasse
      • Molded Fiber
    • Y-o-Y Growth Trend Analysis By Material , 2020 to 2024
    • Absolute $ Opportunity Analysis By Material , 2025 to 2035
  7. Global Market Analysis 2020 to 2024 and Forecast 2025 to 2035, By End-Use Industry
    • Introduction / Key Findings
    • Historical Market Size Value (USD Million) Analysis By End-Use Industry, 2020 to 2024
    • Current and Future Market Size Value (USD Million) Analysis and Forecast By End-Use Industry, 2025 to 2035
      • Beverage
      • Water
      • Personal Care & Cosmetics
      • Pharmaceutical
      • Other Industrial
    • Y-o-Y Growth Trend Analysis By End-Use Industry, 2020 to 2024
    • Absolute $ Opportunity Analysis By End-Use Industry, 2025 to 2035
  8. Global Market Analysis 2020 to 2024 and Forecast 2025 to 2035, By Capacity
    • Introduction / Key Findings
    • Historical Market Size Value (USD Million) Analysis By Capacity, 2020 to 2024
    • Current and Future Market Size Value (USD Million) Analysis and Forecast By Capacity, 2025 to 2035
      • 201 To 500 Ml
      • Up To 200 Ml
      • Above 500 Ml
    • Y-o-Y Growth Trend Analysis By Capacity, 2020 to 2024
    • Absolute $ Opportunity Analysis By Capacity, 2025 to 2035
  9. Global Market Analysis 2020 to 2024 and Forecast 2025 to 2035, By Region
    • Introduction
    • Historical Market Size Value (USD Million) Analysis By Region, 2020 to 2024
    • Current Market Size Value (USD Million) Analysis and Forecast By Region, 2025 to 2035
      • North America
      • Latin America
      • Western Europe
      • Eastern Europe
      • East Asia
      • South Asia and Pacific
      • Middle East & Africa
    • Market Attractiveness Analysis By Region
  10. North America Market Analysis 2020 to 2024 and Forecast 2025 to 2035, By Country
    • Historical Market Size Value (USD Million) Trend Analysis By Market Taxonomy, 2020 to 2024
    • Market Size Value (USD Million) Forecast By Market Taxonomy, 2025 to 2035
      • By Country
        • USA
        • Canada
        • Mexico
      • By Material
      • By End-Use Industry
      • By Capacity
    • Market Attractiveness Analysis
      • By Country
      • By Material
      • By End-Use Industry
      • By Capacity
    • Key Takeaways
  11. Latin America Market Analysis 2020 to 2024 and Forecast 2025 to 2035, By Country
    • Historical Market Size Value (USD Million) Trend Analysis By Market Taxonomy, 2020 to 2024
    • Market Size Value (USD Million) Forecast By Market Taxonomy, 2025 to 2035
      • By Country
        • Brazil
        • Chile
        • Rest of Latin America
      • By Material
      • By End-Use Industry
      • By Capacity
    • Market Attractiveness Analysis
      • By Country
      • By Material
      • By End-Use Industry
      • By Capacity
    • Key Takeaways
  12. Western Europe Market Analysis 2020 to 2024 and Forecast 2025 to 2035, By Country
    • Historical Market Size Value (USD Million) Trend Analysis By Market Taxonomy, 2020 to 2024
    • Market Size Value (USD Million) Forecast By Market Taxonomy, 2025 to 2035
      • By Country
        • Germany
        • UK
        • Italy
        • Spain
        • France
        • Nordic
        • BENELUX
        • Rest of Western Europe
      • By Material
      • By End-Use Industry
      • By Capacity
    • Market Attractiveness Analysis
      • By Country
      • By Material
      • By End-Use Industry
      • By Capacity
    • Key Takeaways
  13. Eastern Europe Market Analysis 2020 to 2024 and Forecast 2025 to 2035, By Country
    • Historical Market Size Value (USD Million) Trend Analysis By Market Taxonomy, 2020 to 2024
    • Market Size Value (USD Million) Forecast By Market Taxonomy, 2025 to 2035
      • By Country
        • Russia
        • Poland
        • Hungary
        • Balkan & Baltic
        • Rest of Eastern Europe
      • By Material
      • By End-Use Industry
      • By Capacity
    • Market Attractiveness Analysis
      • By Country
      • By Material
      • By End-Use Industry
      • By Capacity
    • Key Takeaways
  14. East Asia Market Analysis 2020 to 2024 and Forecast 2025 to 2035, By Country
    • Historical Market Size Value (USD Million) Trend Analysis By Market Taxonomy, 2020 to 2024
    • Market Size Value (USD Million) Forecast By Market Taxonomy, 2025 to 2035
      • By Country
        • China
        • Japan
        • South Korea
      • By Material
      • By End-Use Industry
      • By Capacity
    • Market Attractiveness Analysis
      • By Country
      • By Material
      • By End-Use Industry
      • By Capacity
    • Key Takeaways
  15. South Asia and Pacific Market Analysis 2020 to 2024 and Forecast 2025 to 2035, By Country
    • Historical Market Size Value (USD Million) Trend Analysis By Market Taxonomy, 2020 to 2024
    • Market Size Value (USD Million) Forecast By Market Taxonomy, 2025 to 2035
      • By Country
        • India
        • ASEAN
        • Australia & New Zealand
        • Rest of South Asia and Pacific
      • By Material
      • By End-Use Industry
      • By Capacity
    • Market Attractiveness Analysis
      • By Country
      • By Material
      • By End-Use Industry
      • By Capacity
    • Key Takeaways
  16. Middle East & Africa Market Analysis 2020 to 2024 and Forecast 2025 to 2035, By Country
    • Historical Market Size Value (USD Million) Trend Analysis By Market Taxonomy, 2020 to 2024
    • Market Size Value (USD Million) Forecast By Market Taxonomy, 2025 to 2035
      • By Country
        • Kingdom of Saudi Arabia
        • Other GCC Countries
        • Turkiye
        • South Africa
        • Other African Union
        • Rest of Middle East & Africa
      • By Material
      • By End-Use Industry
      • By Capacity
    • Market Attractiveness Analysis
      • By Country
      • By Material
      • By End-Use Industry
      • By Capacity
    • Key Takeaways
  17. Key Countries Market Analysis
    • USA
      • Pricing Analysis
      • Market Share Analysis, 2024
        • By Material
        • By End-Use Industry
        • By Capacity
    • Canada
      • Pricing Analysis
      • Market Share Analysis, 2024
        • By Material
        • By End-Use Industry
        • By Capacity
    • Mexico
      • Pricing Analysis
      • Market Share Analysis, 2024
        • By Material
        • By End-Use Industry
        • By Capacity
    • Brazil
      • Pricing Analysis
      • Market Share Analysis, 2024
        • By Material
        • By End-Use Industry
        • By Capacity
    • Chile
      • Pricing Analysis
      • Market Share Analysis, 2024
        • By Material
        • By End-Use Industry
        • By Capacity
    • Germany
      • Pricing Analysis
      • Market Share Analysis, 2024
        • By Material
        • By End-Use Industry
        • By Capacity
    • UK
      • Pricing Analysis
      • Market Share Analysis, 2024
        • By Material
        • By End-Use Industry
        • By Capacity
    • Italy
      • Pricing Analysis
      • Market Share Analysis, 2024
        • By Material
        • By End-Use Industry
        • By Capacity
    • Spain
      • Pricing Analysis
      • Market Share Analysis, 2024
        • By Material
        • By End-Use Industry
        • By Capacity
    • France
      • Pricing Analysis
      • Market Share Analysis, 2024
        • By Material
        • By End-Use Industry
        • By Capacity
    • India
      • Pricing Analysis
      • Market Share Analysis, 2024
        • By Material
        • By End-Use Industry
        • By Capacity
    • ASEAN
      • Pricing Analysis
      • Market Share Analysis, 2024
        • By Material
        • By End-Use Industry
        • By Capacity
    • Australia & New Zealand
      • Pricing Analysis
      • Market Share Analysis, 2024
        • By Material
        • By End-Use Industry
        • By Capacity
    • China
      • Pricing Analysis
      • Market Share Analysis, 2024
        • By Material
        • By End-Use Industry
        • By Capacity
    • Japan
      • Pricing Analysis
      • Market Share Analysis, 2024
        • By Material
        • By End-Use Industry
        • By Capacity
    • South Korea
      • Pricing Analysis
      • Market Share Analysis, 2024
        • By Material
        • By End-Use Industry
        • By Capacity
    • Russia
      • Pricing Analysis
      • Market Share Analysis, 2024
        • By Material
        • By End-Use Industry
        • By Capacity
    • Poland
      • Pricing Analysis
      • Market Share Analysis, 2024
        • By Material
        • By End-Use Industry
        • By Capacity
    • Hungary
      • Pricing Analysis
      • Market Share Analysis, 2024
        • By Material
        • By End-Use Industry
        • By Capacity
    • Kingdom of Saudi Arabia
      • Pricing Analysis
      • Market Share Analysis, 2024
        • By Material
        • By End-Use Industry
        • By Capacity
    • Turkiye
      • Pricing Analysis
      • Market Share Analysis, 2024
        • By Material
        • By End-Use Industry
        • By Capacity
    • South Africa
      • Pricing Analysis
      • Market Share Analysis, 2024
        • By Material
        • By End-Use Industry
        • By Capacity
  18. Market Structure Analysis
    • Competition Dashboard
    • Competition Benchmarking
    • Market Share Analysis of Top Players
      • By Regional
      • By Material
      • By End-Use Industry
      • By Capacity
  19. Competition Analysis
    • Competition Deep Dive
      • Paper Water Bottle
        • Overview
        • Product Portfolio
        • Profitability by Market Segments (Product/Age /Sales Channel/Region)
        • Sales Footprint
        • Strategy Overview
          • Marketing Strategy
          • Product Strategy
          • Channel Strategy
      • One Green Bottle
      • Earthlust
      • Ecologic Brands
      • SKS Bottle and Packaging
      • Pachamama
      • Kanrel
      • ENSO Bottles
      • Earth Bottles
      • SafeBottles
      • Pepsi-Cola Metropolitan Bottling Company
      • Cascade Designs Inc.
  20. Assumptions & Acronyms Used
  21. Research Methodology

List of Tables

  • Table 1: Global Market Value (USD Million) Forecast by Region, 2020-2035
  • Table 2: Global Market Value (USD Million) Forecast by Material , 2020-2035
  • Table 3: Global Market Value (USD Million) Forecast by End-Use Industry, 2020-2035
  • Table 4: Global Market Value (USD Million) Forecast by Capacity, 2020-2035
  • Table 5: North America Market Value (USD Million) Forecast by Country, 2020-2035
  • Table 6: North America Market Value (USD Million) Forecast by Material , 2020-2035
  • Table 7: North America Market Value (USD Million) Forecast by End-Use Industry, 2020-2035
  • Table 8: North America Market Value (USD Million) Forecast by Capacity, 2020-2035
  • Table 9: Latin America Market Value (USD Million) Forecast by Country, 2020-2035
  • Table 10: Latin America Market Value (USD Million) Forecast by Material , 2020-2035
  • Table 11: Latin America Market Value (USD Million) Forecast by End-Use Industry, 2020-2035
  • Table 12: Latin America Market Value (USD Million) Forecast by Capacity, 2020-2035
  • Table 13: Western Europe Market Value (USD Million) Forecast by Country, 2020-2035
  • Table 14: Western Europe Market Value (USD Million) Forecast by Material , 2020-2035
  • Table 15: Western Europe Market Value (USD Million) Forecast by End-Use Industry, 2020-2035
  • Table 16: Western Europe Market Value (USD Million) Forecast by Capacity, 2020-2035
  • Table 17: Eastern Europe Market Value (USD Million) Forecast by Country, 2020-2035
  • Table 18: Eastern Europe Market Value (USD Million) Forecast by Material , 2020-2035
  • Table 19: Eastern Europe Market Value (USD Million) Forecast by End-Use Industry, 2020-2035
  • Table 20: Eastern Europe Market Value (USD Million) Forecast by Capacity, 2020-2035
  • Table 21: East Asia Market Value (USD Million) Forecast by Country, 2020-2035
  • Table 22: East Asia Market Value (USD Million) Forecast by Material , 2020-2035
  • Table 23: East Asia Market Value (USD Million) Forecast by End-Use Industry, 2020-2035
  • Table 24: East Asia Market Value (USD Million) Forecast by Capacity, 2020-2035
  • Table 25: South Asia and Pacific Market Value (USD Million) Forecast by Country, 2020-2035
  • Table 26: South Asia and Pacific Market Value (USD Million) Forecast by Material , 2020-2035
  • Table 27: South Asia and Pacific Market Value (USD Million) Forecast by End-Use Industry, 2020-2035
  • Table 28: South Asia and Pacific Market Value (USD Million) Forecast by Capacity, 2020-2035
  • Table 29: Middle East & Africa Market Value (USD Million) Forecast by Country, 2020-2035
  • Table 30: Middle East & Africa Market Value (USD Million) Forecast by Material , 2020-2035
  • Table 31: Middle East & Africa Market Value (USD Million) Forecast by End-Use Industry, 2020-2035
  • Table 32: Middle East & Africa Market Value (USD Million) Forecast by Capacity, 2020-2035

List of Figures

  • Figure 1: Global Market Pricing Analysis
  • Figure 2: Global Market Value (USD Million) Forecast 2020-2035
  • Figure 3: Global Market Value Share and BPS Analysis by Material , 2025 and 2035
  • Figure 4: Global Market Y-o-Y Growth Comparison by Material , 2025-2035
  • Figure 5: Global Market Attractiveness Analysis by Material
  • Figure 6: Global Market Value Share and BPS Analysis by End-Use Industry, 2025 and 2035
  • Figure 7: Global Market Y-o-Y Growth Comparison by End-Use Industry, 2025-2035
  • Figure 8: Global Market Attractiveness Analysis by End-Use Industry
  • Figure 9: Global Market Value Share and BPS Analysis by Capacity, 2025 and 2035
  • Figure 10: Global Market Y-o-Y Growth Comparison by Capacity, 2025-2035
  • Figure 11: Global Market Attractiveness Analysis by Capacity
  • Figure 12: Global Market Value (USD Million) Share and BPS Analysis by Region, 2025 and 2035
  • Figure 13: Global Market Y-o-Y Growth Comparison by Region, 2025-2035
  • Figure 14: Global Market Attractiveness Analysis by Region
  • Figure 15: North America Market Incremental Dollar Opportunity, 2025-2035
  • Figure 16: Latin America Market Incremental Dollar Opportunity, 2025-2035
  • Figure 17: Western Europe Market Incremental Dollar Opportunity, 2025-2035
  • Figure 18: Eastern Europe Market Incremental Dollar Opportunity, 2025-2035
  • Figure 19: East Asia Market Incremental Dollar Opportunity, 2025-2035
  • Figure 20: South Asia and Pacific Market Incremental Dollar Opportunity, 2025-2035
  • Figure 21: Middle East & Africa Market Incremental Dollar Opportunity, 2025-2035
  • Figure 22: North America Market Value Share and BPS Analysis by Country, 2025 and 2035
  • Figure 23: North America Market Value Share and BPS Analysis by Material , 2025 and 2035
  • Figure 24: North America Market Y-o-Y Growth Comparison by Material , 2025-2035
  • Figure 25: North America Market Attractiveness Analysis by Material
  • Figure 26: North America Market Value Share and BPS Analysis by End-Use Industry, 2025 and 2035
  • Figure 27: North America Market Y-o-Y Growth Comparison by End-Use Industry, 2025-2035
  • Figure 28: North America Market Attractiveness Analysis by End-Use Industry
  • Figure 29: North America Market Value Share and BPS Analysis by Capacity, 2025 and 2035
  • Figure 30: North America Market Y-o-Y Growth Comparison by Capacity, 2025-2035
  • Figure 31: North America Market Attractiveness Analysis by Capacity
  • Figure 32: Latin America Market Value Share and BPS Analysis by Country, 2025 and 2035
  • Figure 33: Latin America Market Value Share and BPS Analysis by Material , 2025 and 2035
  • Figure 34: Latin America Market Y-o-Y Growth Comparison by Material , 2025-2035
  • Figure 35: Latin America Market Attractiveness Analysis by Material
  • Figure 36: Latin America Market Value Share and BPS Analysis by End-Use Industry, 2025 and 2035
  • Figure 37: Latin America Market Y-o-Y Growth Comparison by End-Use Industry, 2025-2035
  • Figure 38: Latin America Market Attractiveness Analysis by End-Use Industry
  • Figure 39: Latin America Market Value Share and BPS Analysis by Capacity, 2025 and 2035
  • Figure 40: Latin America Market Y-o-Y Growth Comparison by Capacity, 2025-2035
  • Figure 41: Latin America Market Attractiveness Analysis by Capacity
  • Figure 42: Western Europe Market Value Share and BPS Analysis by Country, 2025 and 2035
  • Figure 43: Western Europe Market Value Share and BPS Analysis by Material , 2025 and 2035
  • Figure 44: Western Europe Market Y-o-Y Growth Comparison by Material , 2025-2035
  • Figure 45: Western Europe Market Attractiveness Analysis by Material
  • Figure 46: Western Europe Market Value Share and BPS Analysis by End-Use Industry, 2025 and 2035
  • Figure 47: Western Europe Market Y-o-Y Growth Comparison by End-Use Industry, 2025-2035
  • Figure 48: Western Europe Market Attractiveness Analysis by End-Use Industry
  • Figure 49: Western Europe Market Value Share and BPS Analysis by Capacity, 2025 and 2035
  • Figure 50: Western Europe Market Y-o-Y Growth Comparison by Capacity, 2025-2035
  • Figure 51: Western Europe Market Attractiveness Analysis by Capacity
  • Figure 52: Eastern Europe Market Value Share and BPS Analysis by Country, 2025 and 2035
  • Figure 53: Eastern Europe Market Value Share and BPS Analysis by Material , 2025 and 2035
  • Figure 54: Eastern Europe Market Y-o-Y Growth Comparison by Material , 2025-2035
  • Figure 55: Eastern Europe Market Attractiveness Analysis by Material
  • Figure 56: Eastern Europe Market Value Share and BPS Analysis by End-Use Industry, 2025 and 2035
  • Figure 57: Eastern Europe Market Y-o-Y Growth Comparison by End-Use Industry, 2025-2035
  • Figure 58: Eastern Europe Market Attractiveness Analysis by End-Use Industry
  • Figure 59: Eastern Europe Market Value Share and BPS Analysis by Capacity, 2025 and 2035
  • Figure 60: Eastern Europe Market Y-o-Y Growth Comparison by Capacity, 2025-2035
  • Figure 61: Eastern Europe Market Attractiveness Analysis by Capacity
  • Figure 62: East Asia Market Value Share and BPS Analysis by Country, 2025 and 2035
  • Figure 63: East Asia Market Value Share and BPS Analysis by Material , 2025 and 2035
  • Figure 64: East Asia Market Y-o-Y Growth Comparison by Material , 2025-2035
  • Figure 65: East Asia Market Attractiveness Analysis by Material
  • Figure 66: East Asia Market Value Share and BPS Analysis by End-Use Industry, 2025 and 2035
  • Figure 67: East Asia Market Y-o-Y Growth Comparison by End-Use Industry, 2025-2035
  • Figure 68: East Asia Market Attractiveness Analysis by End-Use Industry
  • Figure 69: East Asia Market Value Share and BPS Analysis by Capacity, 2025 and 2035
  • Figure 70: East Asia Market Y-o-Y Growth Comparison by Capacity, 2025-2035
  • Figure 71: East Asia Market Attractiveness Analysis by Capacity
  • Figure 72: South Asia and Pacific Market Value Share and BPS Analysis by Country, 2025 and 2035
  • Figure 73: South Asia and Pacific Market Value Share and BPS Analysis by Material , 2025 and 2035
  • Figure 74: South Asia and Pacific Market Y-o-Y Growth Comparison by Material , 2025-2035
  • Figure 75: South Asia and Pacific Market Attractiveness Analysis by Material
  • Figure 76: South Asia and Pacific Market Value Share and BPS Analysis by End-Use Industry, 2025 and 2035
  • Figure 77: South Asia and Pacific Market Y-o-Y Growth Comparison by End-Use Industry, 2025-2035
  • Figure 78: South Asia and Pacific Market Attractiveness Analysis by End-Use Industry
  • Figure 79: South Asia and Pacific Market Value Share and BPS Analysis by Capacity, 2025 and 2035
  • Figure 80: South Asia and Pacific Market Y-o-Y Growth Comparison by Capacity, 2025-2035
  • Figure 81: South Asia and Pacific Market Attractiveness Analysis by Capacity
  • Figure 82: Middle East & Africa Market Value Share and BPS Analysis by Country, 2025 and 2035
  • Figure 83: Middle East & Africa Market Value Share and BPS Analysis by Material , 2025 and 2035
  • Figure 84: Middle East & Africa Market Y-o-Y Growth Comparison by Material , 2025-2035
  • Figure 85: Middle East & Africa Market Attractiveness Analysis by Material
  • Figure 86: Middle East & Africa Market Value Share and BPS Analysis by End-Use Industry, 2025 and 2035
  • Figure 87: Middle East & Africa Market Y-o-Y Growth Comparison by End-Use Industry, 2025-2035
  • Figure 88: Middle East & Africa Market Attractiveness Analysis by End-Use Industry
  • Figure 89: Middle East & Africa Market Value Share and BPS Analysis by Capacity, 2025 and 2035
  • Figure 90: Middle East & Africa Market Y-o-Y Growth Comparison by Capacity, 2025-2035
  • Figure 91: Middle East & Africa Market Attractiveness Analysis by Capacity
  • Figure 92: Global Market - Tier Structure Analysis
  • Figure 93: Global Market - Company Share Analysis
Dashboard
Dashboard
Dashboard
Dashboard
Dashboard
Dashboard

Full Research Suite comprises of:

Market outlook & trends analysis

Market outlook & trends analysis

Interviews & case studies

Interviews & case studies

Strategic recommendations

Strategic recommendations

Vendor profiles & capabilities analysis

Vendor profiles & capabilities analysis

5-year forecasts

5-year forecasts

8 regions and 60+ country-level data splits

8 regions and 60+ country-level data splits

Market segment data splits

Market segment data splits

12 months of continuous data updates

12 months of continuous data updates

DELIVERED AS:

PDF EXCEL ONLINE

Full Research Suite


$5000

$7500

$10000

Buy Report Now
Similar Industry Reports

Similar Industry Reports

Bottle Sealing Wax Market

Bottle Sealing Wax Market Size and Share Forecast Outlook 2025 to 2035

Bottle Filling Machines Market

Bottle Filling Machines Market Size and Share Forecast Outlook 2025 to 2035

Bottle Shippers Market

Bottle Shippers Market Size and Share Forecast Outlook 2025 to 2035

Bottled Water Packaging Market

Bottled Water Packaging Market Size and Share Forecast Outlook 2025 to 2035

Bottle Sticker Labelling Machine Market

Bottle Sticker Labelling Machine Market Size and Share Forecast Outlook 2025 to 2035

Bottle Dividers Market

Bottle Dividers Market Size and Share Forecast Outlook 2025 to 2035

Bottle Jack Market
Bottle Jack Market

Bottle Jack Market Size and Share Forecast Outlook 2025 to 2035

Bottles Market
Bottles Market

Bottles Market Analysis - Growth & Forecast 2025 to 2035

Bottle Capping Machine Market

Bottle Capping Machine Market Analysis by Automation, Operating Speed, Machine Type, End-use Industry, and Region Forecast Through 2035

Bottle Dividers Market Share Analysis

Market Share Distribution Among Bottle Dividers Suppliers

Bottle Carrier Market

Bottle Carrier Market Trends – Growth & Forecast 2024-2034

Bottle Cap Market
Bottle Cap Market

Bottle Cap Market Analysis & Industry Forecast 2024-2034

Bottled Water Processing Equipment Market

Bottled Water Processing Equipment Market Trends – Growth & Industry Forecast 2025-2035

Bottle Pourers Market

Bottle Pourers Market

RTD Bottled Cocktail Market

RTD Bottled Cocktail Market - Size, Share, and Forecast Outlook 2025 to 2035

PET Bottles Market
PET Bottles Market

PET Bottles Market Demand and Insights 2025 to 2035

PCR Bottles Market
PCR Bottles Market

PCR Bottles Market Growth - Demand, Innovations & Outlook 2024 to 2034

PET Bottle Industry Analysis in Asia and Middle East and Africa

Asia & MEA PET Bottle Market Trends & Industry Forecast 2024-2034

Foam Bottle Technology Market

Foam Bottle Technology Market Size and Share Forecast Outlook 2025 to 2035

Beer Bottles Market
Beer Bottles Market

Beer Bottles Market Size and Share Forecast Outlook 2025 to 2035

Future Market Insights

Eco-friendly Bottle Market

Chat With MaRIA

Chat With

MaRIA

Hi There, I am MaRIA, Your Market Research Intelligence Assistant. How may I help you?