The economic grade precision power analyzers market begins its transformative decade journey from a USD 130.8 million foundation in 2025, establishing the groundwork for substantial expansion ahead. The first half of the decade witnesses accelerated momentum building, with market value climbing from USD 140.0 million in 2026 to USD 196.3 million by 2030. This initial phase reflects growing industrial automation sophistication and increasing precision requirements across manufacturing and testing environments.
The latter half demonstrates sustained high-growth dynamics, propelling the market from USD 210.1 million in 2031 to reach USD 257.3 million by 2035. Dollar additions during 2030-2035 maintain consistent growth patterns, with annual increments averaging USD 12.2 million compared to USD 13.1 million in the first phase. This progression represents a 96.6% total value increase over the forecast decade.
Market maturation factors include expanding industrial automation volumes, educational sector precision demands, and power electronics manufacturing sophistication. The 7.0% compound annual growth rate positions participants to capitalize on USD 126.5 million in additional market value creation. This trajectory signals robust opportunities for technology innovators, distribution network developers, and end-user solution providers across the global industrial measurement landscape.
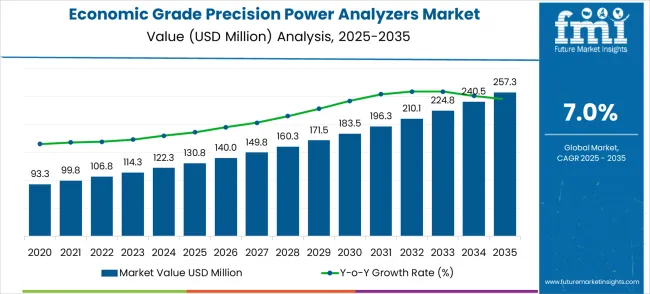
Market expansion unfolds through two distinct growth periods with different competitive characteristics for each phase. The 2025-2030 foundation period delivers USD 65.5 million in value additions, representing 50.1% growth from the baseline. Market dynamics during this phase center on technology standardization, distribution channel establishment, and end-user adoption acceleration across manufacturing and educational testing sectors.
The 2030-2035 acceleration period generates USD 61.0 million in incremental value, reflecting 31.1% growth from the 2030 position. This phase exhibits mature market characteristics with enhanced competition, product differentiation strategies, and geographic expansion initiatives. Dollar contributions shift from foundational infrastructure development to market share optimization and technological advancement in high-precision measurement capabilities.
The competitive landscape evolves from early market development to established player positioning. The first period focuses on market education and reducing adoption barriers in traditional industrial testing applications. The second period witnesses intensified competition for premium market segments and the expansion of geographical territories. Market maturation factors include standardized measurement requirements, automated testing integration capabilities, and cross-industry application development across manufacturing, education, and power electronics sectors.
| Metric | Value |
|---|---|
| Market Value (2025) | USD 130.8 million |
| Market Forecast (2035) | USD 257.3 million |
| Growth Rate | 7.0% CAGR |
| Segment Leader | Single Phase |
| Application Focus | Production Line Testing |
Market expansion rests on four fundamental shifts driving industrial demand acceleration:
The growth faces headwinds from high instrument costs and complex calibration requirements. Traditional basic measurement alternatives maintain cost advantages for less demanding applications. Technical complexity creates adoption barriers for smaller organizations without specialized measurement expertise and technical support capabilities.
Primary Classification: Phase Type Distribution
Secondary Breakdown: Application Categories
Geographic Segmentation: Regional Market Distribution
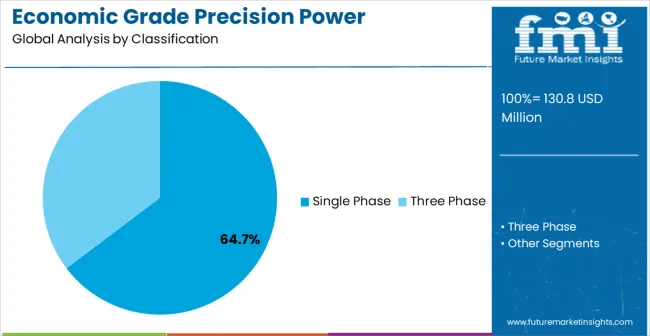
Market Position: Single phase precision power analyzers establish clear market leadership through superior cost-effectiveness and application versatility benefits. High-accuracy single phase systems eliminate complexity limitations in demanding measurement applications. Consistent performance capabilities enable precise power parameter analysis where multi-phase alternatives cannot achieve required cost-efficiency specifications.
Value Drivers: Advanced measurement technology improvements enhance accuracy precision and reduce calibration complexities. Digital interface integration provides real-time data visualization and automated reporting capabilities. Specialized software capabilities accommodate multiple measurement requirements within single instrument configurations for operational efficiency and cost optimization.
Competitive Advantages: Single phase systems offer enhanced measurement simplicity compared to complex three-phase alternatives requiring specialized expertise and training. Superior cost-effectiveness increases accessibility through reduced equipment investments in educational and small-scale industrial environments. Economic pricing justification occurs through total cost of ownership advantages and measurement reliability benefits for standard applications.
Market Challenges: Limited measurement capabilities for complex three-phase power systems requiring comprehensive analysis. Application constraints demand supplementary instrumentation for multi-phase industrial environments. Market positioning challenges occur when competing against integrated multi-phase solutions offering comprehensive measurement capabilities and advanced analysis functions.
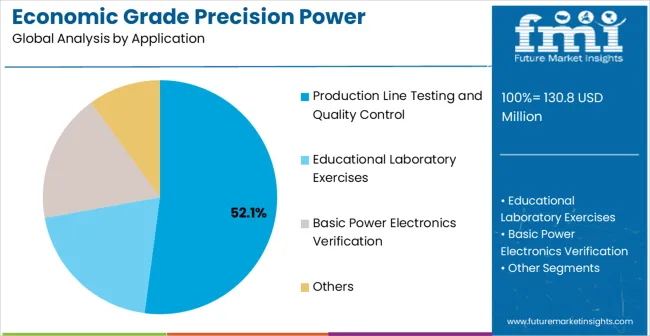
Strategic Market Importance: Manufacturing quality control represents the primary demand driver for precision power measurement applications across global production facilities. Electronic device manufacturing, automotive component testing, and consumer product applications require precise power parameter analysis for operational efficiency. Quality control standards mandate consistent measurement performance for production optimization and product reliability verification.
Market Dynamics Q&A:
Business Logic: Manufacturing facilities prioritize product quality and process consistency, making precision power analyzers essential for meeting production targets and quality standards. Cost justification occurs through reduced defect rates and enhanced production efficiency. Quality control requirements demand consistent measurement accuracy for operational continuity and regulatory compliance.
Forward-looking Implications: Smart manufacturing initiatives create new application requirements for automated measurement systems with advanced data integration capabilities. Industry 4.0 development demands enhanced connectivity and real-time monitoring for specialized production environments. Global manufacturing expansion sustains market demand across emerging production regions with expanding industrial infrastructure and quality control requirements.
Drivers of the Economic Grade Precision Power Analyzers Market
The economic grade precision power analyzers market is primarily driven by increasing demand from industries requiring accurate power measurement and energy efficiency analysis. Applications in manufacturing quality control, educational institutions, and power electronics development necessitate instruments that maintain measurement precision under varying conditions, making economic-grade analyzers attractive solutions. The integration of advanced measurement technologies into industrial operations further emphasizes the need for cost-effective precision instruments and reliable data acquisition capabilities, ensuring consistent performance standards. Stringent energy efficiency regulations across manufacturing and educational sectors encourage the use of precision measurement tools that reduce operational costs and improve system optimization. Economic grade analyzers' compliance with international measurement standards also makes them preferred choices for budget-conscious applications, where documented accuracy and reliability are essential for cost-effective operations, creating a stable demand pipeline globally.
Restraints Affecting Market Growth
Despite advantages, the economic grade precision power analyzers market faces several growth inhibitors. Performance limitations compared to higher-grade instruments create measurement accuracy constraints, discouraging adoption in high-precision applications and advanced research environments. The calibration and maintenance requirements are complex, demanding specialized technical expertise and periodic recalibration services, which are not universally available. Limited measurement bandwidth and analysis capabilities further constrain applications in advanced power electronics and high-frequency measurement requirements. The technical complexity involved in proper instrument operation necessitates trained operators and comprehensive understanding of measurement principles, adding to operational overhead costs. These challenges collectively slow market penetration, particularly in advanced research environments or high-precision industrial sectors, restraining market growth despite rising demand for cost-effective measurement solutions.
Key Trends and Market Evolution Patterns
The economic grade precision power analyzers market is evolving rapidly, driven by technological innovations and connectivity requirements. Digital interface integration allows enhanced data visualization and automated reporting capabilities, improving measurement efficiency for educational and industrial applications. Cloud connectivity and IoT integration represent growing trends, enabling remote monitoring, data sharing, and collaborative measurement environments. Energy efficiency initiatives are gaining traction, prompting the development of power analyzers with advanced energy measurement capabilities and environmental monitoring features. There is increasing demand for portable and compact analyzers tailored to field measurement requirements, offering operational flexibility while maintaining measurement accuracy standards. These trends collectively indicate a market that is technologically advancing while responding to the needs of education, industry, and environmental measurement, ensuring growth and innovation in cost-effective precision measurement solutions.
Global market dynamics reveal distinct performance tiers reflecting regional manufacturing capabilities and industrial development levels. Growth Leaders including China (9.5% market share) and India (8.8% share) demonstrate expanding manufacturing production ecosystems with advanced measurement adoption, while Germany (8.1% share) represents European manufacturing excellence in precision testing applications. Steady Performers such as Brazil (7.4% share) and the United States (6.7% share) show consistent demand growth aligned with industrial modernization and educational sector requirements. Mature Markets including the United Kingdom (6.0% share) and Japan (5.3% share) display established market participation reflecting advanced technology integration and specialized measurement application focus.
Regional synthesis indicates Asia Pacific dominance through manufacturing concentration and educational institution expansion. European markets emphasize quality standards and precision engineering applications. North American demand reflects industrial innovation adoption and advanced educational facility development initiatives.
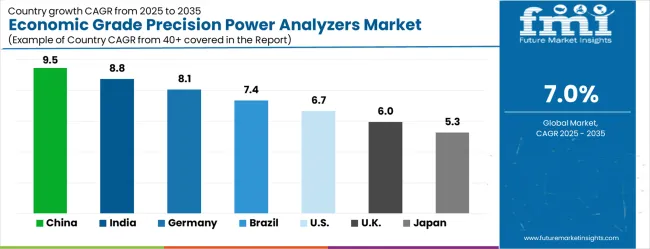
| Country | Market Share (%) |
|---|---|
| China | 9.5 |
| India | 8.8 |
| Germany | 8.1 |
| Brazil | 7.4 |
| USA | 6.7 |
| UK | 6.0 |
| Japan | 5.3 |
China establishes market leadership with a commanding 9.5% market share through manufacturing sector dominance across electronics production, automotive component testing, and industrial automation facilities. The nation's extensive production capacity and export-oriented manufacturing requirements drive consistent demand for cost-effective precision measurement instruments, supported by comprehensive industrial modernization and government technology development initiatives. Market dynamics center on smart manufacturing expansion creating new measurement requirements for automated production systems and quality control integration. State-owned enterprise modernization programs promote widespread adoption of precision measurement tools for operational efficiency and international competitiveness enhancement. Manufacturing concentration in major industrial producing regions creates significant demand density for economic grade measurement instruments, while industrial development policies specifically include measurement technology requirements for comprehensive production upgrading initiatives. Export market demands necessitate strict quality control standard adherence through documented measurement capabilities and certification processes. Strategic indicators include manufacturing production capacity exceeding global leadership positions with growing demand for cost-effective precision instruments, government industrial automation initiatives mandating advanced measurement adoption. Quality assurance requirements supporting affordable measurement technology development for expanding manufacturing sectors and educational institution modernization programs.
India demonstrates robust growth potential with an 8.8% market share through rapidly expanding manufacturing capabilities and comprehensive government promotion of domestic production initiatives under various industrial development programs. The market reflects increasing technical education sophistication and widespread quality standard adoption across manufacturing and educational sectors, with industrial sector growth creating consistent demand for cost-effective precision measurement instruments across both large-scale production facilities and technical educational institutions. Automotive electronics manufacturing expansion drives significant secondary demand through stringent testing requirements for component verification and quality assurance operations. Government technical education mandates actively promote precision measurement adoption for enhanced curriculum standards and international education compliance, while major infrastructure development projects increase industrial equipment production volumes requiring affordable measurement applications. Market activity centers on comprehensive technology transfer agreements bringing international measurement standards to domestic manufacturing and educational facilities. Foreign direct investment introduces advanced measurement requirements for improved operational efficiency and competitive advantage development. Technical education expansion exceeds 12% annually, creating consistent growth opportunities for affordable precision measurement instruments, while government skill development initiatives mandate documented measurement capabilities and technical training protocols for export competitiveness and educational excellence in engineering and technical programs.
Germany maintains an 8.1% market share through exceptional engineering excellence and established precision manufacturing traditions across diverse industrial and educational sectors. The market demand is supported by an established industrial base with advanced automotive capabilities and technical education expertise, where manufacturing quality control requirements create consistent demand for precision measurement instruments across component testing and specialized automotive system verification applications. Industrial equipment manufacturing requires extensively certified measurement specifications for strict export compliance and international quality standards adherence, while technical education institutions utilize precision analyzers for advanced curriculum development and comprehensive laboratory applications. Quality standard development significantly influences global measurement practices, requiring advanced instrument adoption and technical innovation programs. Advanced manufacturing research initiatives continually develop innovative applications for precision power analyzers across emerging industrial sectors, with export market leadership necessitating comprehensive measurement documentation to support international sales and regulatory compliance requirements. The technical education network requires consistent measurement performance for precision laboratory exercises and engineering curriculum applications. Automotive component testing exceeds USD 35 billion annually, technical education exports maintain global leadership with certified measurement capabilities, and research initiatives advance power measurement technologies across manufacturing and educational sectors, establishing Germany as a precision engineering hub for advanced measurement applications.
Brazil represents a significant emerging market with 7.4% market share through comprehensive industrial development initiatives and educational sector expansion across domestic and regional markets. The market reflects increasing manufacturing sophistication and the adoption of quality standards driven by government policies that promote domestic production capabilities and technical education advancements. Meanwhile, industrial development programs create consistent demand for cost-effective measurement instruments across manufacturing facilities and technical educational institutions. The growth of automotive component manufacturing drives primary market demand through domestic production expansion and regional export requirements for Latin American markets. Additionally, the development of the technical education sector creates substantial opportunities for precision measurement applications and educational laboratory solutions. Infrastructure development significantly increases industrial equipment production volumes requiring affordable measurement instruments and educational facility modernization. Market development benefits from government industrial promotion supporting domestic manufacturing capabilities and strategic educational investment for regional technical competitiveness, while infrastructure projects support manufacturing sector growth, requiring precision measurement capabilities and technical education advancement. Regional trade agreements facilitate improved market access for measurement instrument applications and technical education services. Industrial development initiatives create measurement demand advantages across manufacturing expansion and educational facility development, with government education policies promoting technical institution capabilities and affordable measurement technology adoption for enhanced regional competitiveness and industrial growth.
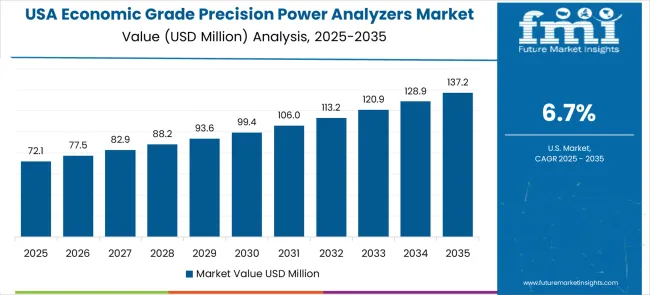
The United States demonstrates steady growth with a 6.7% market share through comprehensive technology innovation leadership and strategic advanced manufacturing initiatives bringing precision measurement capabilities to domestic facilities. The market reflects an established industrial base with significant aerospace sector strength and advanced educational institution capabilities, where defense electronics testing creates substantial demand for precision measurement instruments and cost-effective power analysis systems meeting stringent military and educational requirements. Aerospace industry leadership requires precision power measurement for critical component testing and specialized high-performance system verification, while technical education institutions maintain consistent demand for affordable measurement instruments supporting advanced engineering programs and laboratory curriculum applications. Technology innovation adoption creates integration requirements for measurement instruments with sophisticated manufacturing execution and educational management systems. Manufacturing competitiveness initiatives encourage substantial investment in cost-effective measurement technologies and educational facility enhancement capabilities, with technical education programs requiring extensively documented measurement capabilities supporting comprehensive curriculum applications and regulatory adherence. Aerospace sector leadership drives specialized precision measurement applications, defense electronics maintain consistent demand for certified affordable instruments, technical education innovation creates opportunities for cost-effective measurement solutions, and manufacturing competitiveness programs increase requirements for precision measurement integration and educational facility modernization, establishing the United States as a leading technology innovation hub for advanced measurement development.
The United Kingdom demonstrates market stability with a 6.0% market share through comprehensive advanced manufacturing modernization and strategic technology sector initiatives across key industrial and educational applications. The established manufacturing base emphasizes quality standards and precision aerospace applications, where aerospace sector strength creates substantial demand for precision power measurement in critical aircraft component testing and high-performance system verification applications. Technical education sector requires precision measurement instruments for advanced engineering curricula and secure laboratory hardware meeting stringent educational standards and international accreditation requirements, while advanced manufacturing research initiatives continuously develop innovative applications for cost-effective measurement instruments and educational laboratory equipment. Educational institution modernization maintains strict quality standard requirements for international competitiveness and curriculum excellence. Post-Brexit considerations create significant opportunities for domestic measurement instrument adoption requiring precision manufacturing capabilities and educational facility solutions, with government industrial strategy initiatives actively supporting advanced manufacturing technology adoption and educational excellence development. Strategic technology sector policies emphasize domestic capability development and affordable measurement technology investment for manufacturing and education sectors. Aerospace industry leadership creates specialized precision measurement demand, technical education sector modernization requires cost-effective measurement instruments, and advanced manufacturing initiatives support precision measurement adoption and educational facility development, positioning the United Kingdom as an advanced manufacturing and education hub for measurement applications.
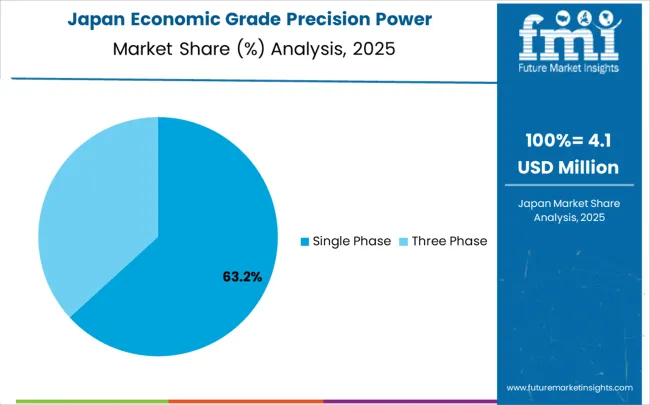
Japan maintains technological leadership with a 5.3% market share through exceptional precision manufacturing excellence and comprehensive quality standard development across diverse industrial and educational sectors. The mature market features established advanced electronics adoption across industries and sophisticated educational institution capabilities, where electronics industry leadership creates consistent demand for precision power measurement technologies and cost-effective analysis instruments meeting strict quality and educational requirements. Industrial automation manufacturing requires precision measurement instruments for component production and comprehensive testing applications ensuring reliable performance and educational curriculum excellence, while automotive electronics industry utilizes specialized power analyzers for advanced vehicle system testing and precision educational applications. Quality management system development significantly influences global measurement practices and educational standard adoption worldwide. Manufacturing technology exports include precision measurement instrument requirements for international production facilities and educational institution technology transfer programs, with research initiatives continuously advancing measurement processing and educational application technologies. Educational institution development creates substantial opportunities for precision measurement integration and advanced technical curriculum applications. Electronics technology leadership requires precision measurement capabilities and cost-effective educational solutions; industrial automation exports include precision measurement requirements and educational specifications. Automotive electronics education creates specialized measurement application needs, and research initiatives advance power measurement technologies and innovative educational solutions, establishing Japan as a global leader in precision technology and measurement applications for high-performance industrial and educational sectors.
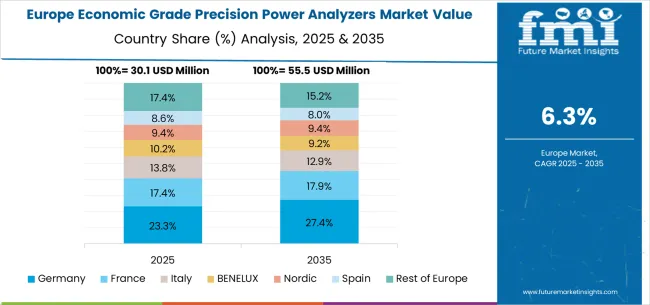
The European economic grade precision power analyzers market is valued at USD 34.2 million in 2025, accounting for 26.1% of global demand. Growth is underpinned by industrial automation expansion, rising emphasis on cost-effective measurement tools, and educational modernization programs. Germany dominates with USD 10.6 million (31.0%), supported by its strong automotive electronics base, precision manufacturing culture, and advanced technical education infrastructure. The United Kingdom follows at USD 7.8 million (22.8%), driven by aerospace quality standards, industrial modernization initiatives, and educational excellence efforts. France contributes USD 6.2 million (18.1%), with growth tied to investments in automation and manufacturing upgrades. Italy adds USD 4.1 million (12.0%), benefiting from infrastructure projects and the adoption of cost-effective analyzers in production facilities. Spain, at USD 2.7 million (7.9%), reflects the modernization of industry and upgrades in educational institutions. The Rest of Europe, worth USD 2.8 million (8.2%), including Nordic, BENELUX, and Eastern European countries, is driven by specialized manufacturing, increased automation adoption, and expanded technical training. Europe represents a mature yet steadily expanding market, where demand is driven by precision, affordability, and integration with evolving academic and industrial ecosystems.
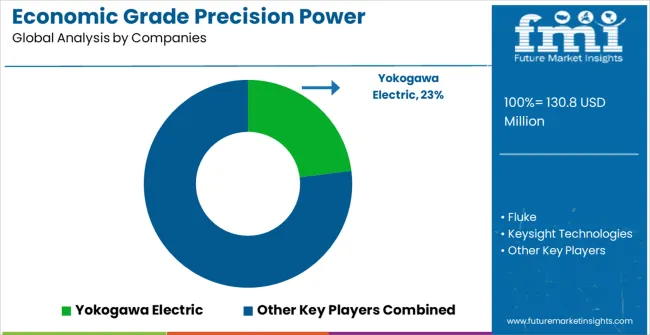
Market structure reflects moderate concentration with established global players maintaining significant market positions while regional competitors serve specialized segments. Competition style emphasizes technological differentiation, cost optimization, and application-specific solutions expansion. Industry dynamics favor companies combining measurement innovation with comprehensive technical service offerings and educational support capabilities.
Yokogawa Electric and Fluke dominate through comprehensive product portfolios, extensive global distribution networks, and advanced measurement capabilities spanning multiple industrial applications. Competitive advantages include substantial research and development resources, established long-term customer relationships, and significant manufacturing scale economies enabling cost optimization and rapid product development cycles. Market positions reflect exceptional quality reputation and deep technical expertise across diverse industrial and educational applications, with strong brand recognition supporting premium pricing strategies. These companies leverage comprehensive service networks, extensive technical documentation, and robust calibration support systems to maintain market leadership positions. Their global presence enables consistent product availability, standardized technical support, and coordinated customer service delivery across international markets, while continuous innovation investments ensure technological advancement and competitive differentiation in precision measurement capabilities.
Companies like Keysight Technologies and Hioki focus strategically on specific application segments and advanced measurement markets through highly specialized product offerings and targeted technical solutions. Competitive advantages include deep application expertise, specialized technical service capabilities, and concentrated innovation focus enabling rapid response to evolving market requirements and customer-specific needs. Market positioning emphasizes technical specialization, advanced feature development, and comprehensive customer relationship development across industrial and educational sectors requiring precision measurement solutions. These companies excel in niche market segments through superior technical knowledge, customized application support, and flexible product configurations meeting specific industry requirements. Their competitive strategies center on technological differentiation, specialized training programs, and comprehensive technical consultation services, enabling premium market positioning and customer loyalty development through expertise-based value propositions and innovative measurement solutions.
Companies including Dewesoft, DEWETRON GmbH, and Chroma ATE serve local markets and specialized applications through focused regional strategies and customized product offerings addressing specific market needs. Competitive advantages include cost competitiveness, responsive regional service capabilities, and exceptional customization flexibility enabling rapid adaptation to local market requirements and customer preferences. Market participation focuses strategically on price-sensitive segments and specialized measurement requirements across diverse industrial and educational applications where global players may lack focused attention or cost optimization. These companies leverage regional market knowledge, local technical support advantages, and flexible manufacturing capabilities to compete effectively against larger competitors. Their success strategies emphasize personalized customer service, rapid response times, competitive pricing structures, and specialized application expertise, enabling market penetration in segments requiring localized support, cost optimization, and customized measurement solutions for specific regional industrial and educational requirements.
The economic grade precision power analyzers market is central to manufacturing excellence, educational advancement, power electronics development, and industrial measurement applications. With increasing demands for cost-effective accuracy, energy efficiency compliance, and reliable measurement capabilities, the sector faces pressure to balance instrument affordability, measurement precision levels, and comprehensive technical support services. Coordinated action from governments, industry bodies, OEMs/technology players, suppliers, and investors is essential to transition toward cost-effective, technologically advanced, and globally accessible precision power analyzer systems.
How Governments Could Spur Local Production and Adoption?
How Industry Bodies Could Support Market Development?
How OEMs and Technology Players Could Strengthen the Ecosystem?
How Suppliers Could Navigate the Shift?
How Investors and Financial Enablers Could Unlock Value?
| Item | Value |
|---|---|
| Quantitative Units | USD 130.8 million |
| Phase Type | Single Phase, Three Phase |
| Application | Production Line Testing and Quality Control, Educational Laboratory Exercises, Basic Power Electronics Verification, Others |
| Regions Covered | North America, Latin America, Europe, East Asia, South Asia & Pacific, Middle East & Africa |
| Countries Covered | United States, Canada, Mexico, Germany, United Kingdom, France, Italy, Spain, Nordic, BENELUX, China, Japan, South Korea, India, ASEAN, Australia, New Zealand, Brazil, Chile, Kingdom of Saudi Arabia, GCC Countries, Turkey, South Africa |
| Key Companies Profiled | Yokogawa Electric, Fluke, Keysight Technologies, Hioki, Dewesoft, DEWETRON GmbH, Chroma ATE, ZLG, Ainuo Instrument, ZES ZIMMER Electronic Systems, Newtons4th, Vitrek |
How big is the economic grade precision power analyzers market in 2025?
The global economic grade precision power analyzers market is valued at USD 130.8 million in 2025.
What will be the size of economic grade precision power analyzers market in 2035?
The size for the economic grade precision power analyzers market is projected to reach USD 257.3 million by 2035.
How much will be the Economic Grade Precision Power Analyzers market growth between 2025 and 2035?
The economic grade precision power analyzers market is expected to grow at a 7.0% CAGR between 2025 and 2035.
What are the key phase type segments in the economic grade precision power analyzers market?
The key phase type segments in the economic grade precision power analyzers market are Single Phase and Three Phase.
Which application segment is expected to contribute significant share in the economic grade precision power analyzers market in 2025?
In terms of application, production line testing and quality control segment is set to command 52.1% share in the economic grade precision power analyzers market in 2025.
The global economic grade precision power analyzers market is estimated to be valued at USD 130.8 million in 2025.
The market size for the economic grade precision power analyzers market is projected to reach USD 257.3 million by 2035.
The economic grade precision power analyzers market is expected to grow at a 7.0% CAGR between 2025 and 2035.
The key product types in economic grade precision power analyzers market are single phase and three phase.
In terms of application, production line testing and quality control segment to command 52.1% share in the economic grade precision power analyzers market in 2025.


Our Research Products

The "Full Research Suite" delivers actionable market intel, deep dives on markets or technologies, so clients act faster, cut risk, and unlock growth.

The Leaderboard benchmarks and ranks top vendors, classifying them as Established Leaders, Leading Challengers, or Disruptors & Challengers.

Locates where complements amplify value and substitutes erode it, forecasting net impact by horizon

We deliver granular, decision-grade intel: market sizing, 5-year forecasts, pricing, adoption, usage, revenue, and operational KPIs—plus competitor tracking, regulation, and value chains—across 60 countries broadly.

Spot the shifts before they hit your P&L. We track inflection points, adoption curves, pricing moves, and ecosystem plays to show where demand is heading, why it is changing, and what to do next across high-growth markets and disruptive tech

Real-time reads of user behavior. We track shifting priorities, perceptions of today’s and next-gen services, and provider experience, then pace how fast tech moves from trial to adoption, blending buyer, consumer, and channel inputs with social signals (#WhySwitch, #UX).

Partner with our analyst team to build a custom report designed around your business priorities. From analysing market trends to assessing competitors or crafting bespoke datasets, we tailor insights to your needs.
Supplier Intelligence
Discovery & Profiling
Capacity & Footprint
Performance & Risk
Compliance & Governance
Commercial Readiness
Who Supplies Whom
Scorecards & Shortlists
Playbooks & Docs
Category Intelligence
Definition & Scope
Demand & Use Cases
Cost Drivers
Market Structure
Supply Chain Map
Trade & Policy
Operating Norms
Deliverables
Buyer Intelligence
Account Basics
Spend & Scope
Procurement Model
Vendor Requirements
Terms & Policies
Entry Strategy
Pain Points & Triggers
Outputs
Pricing Analysis
Benchmarks
Trends
Should-Cost
Indexation
Landed Cost
Commercial Terms
Deliverables
Brand Analysis
Positioning & Value Prop
Share & Presence
Customer Evidence
Go-to-Market
Digital & Reputation
Compliance & Trust
KPIs & Gaps
Outputs
Full Research Suite comprises of:
Market outlook & trends analysis
Interviews & case studies
Strategic recommendations
Vendor profiles & capabilities analysis
5-year forecasts
8 regions and 60+ country-level data splits
Market segment data splits
12 months of continuous data updates
DELIVERED AS:
PDF EXCEL ONLINE
Grader Blades Market Size and Share Forecast Outlook 2025 to 2035
Graders Market Size and Share Forecast Outlook 2025 to 2035
NAF Grade Broad Market Size and Share Forecast Outlook 2025 to 2035
Low-Grade Glioma Therapeutics Market Size and Share Forecast Outlook 2025 to 2035
Wear Grade PEEK Polymer Market Size and Share Forecast Outlook 2025 to 2035
Food Grade Crosslinked Polyvinylpolypyrrolidone (PVPP) Market Size and Share Forecast Outlook 2025 to 2035
Food Grade Cassia Gum Powder Market Size and Share Forecast Outlook 2025 to 2035
Food Grade Dry Film Lubricant Market Size and Share Forecast Outlook 2025 to 2035
Food Grade Tremella Polysaccharide Market Size and Share Forecast Outlook 2025 to 2035
Feed Grade Spray-dried Animal Plasma (SDAP) Market Size and Share Forecast Outlook 2025 to 2035
Food Grade Solvent Market Analysis - Size and Share Forecast Outlook 2025 to 2035
Food Grade Industrial Gases Market Size and Share Forecast Outlook 2025 to 2035
Food-Grade Mixing Tank Market Size and Share Forecast Outlook 2025 to 2035
Feed Grade Oils Market Analysis - Size, Share, and Forecast Outlook 2025 to 2035
Food Grade Glass Market Analysis - Size, Share, & Forecast Outlook 2025 to 2035
Food Grade Gas Market Analysis - Size, Share, and Forecast Outlook 2025 to 2035
Food Grade Antifoams Market Size, Growth, and Forecast for 2025 to 2035
Analysis and Growth Projections for Food Grade Phosphate Business
Analysis and Growth Projections for Food Grade Carrageenan Market
Food Grade Lubricant Market Analysis by Base Oil Type, Product Type and Application Through 2035

Thank you!
You will receive an email from our Business Development Manager. Please be sure to check your SPAM/JUNK folder too.
Chat With
MaRIA