Tanning Waters Market Analysis Size and Share Forecast Outlook 2025 to 2035

The Tanning Waters Market is expected to record a valuation of USD 127.8 million in 2025 and USD 230.9 million in 2035, which equals a growth of 80.5% over the decade. The overall expansion represents a CAGR of 6.1% and a 1.8X increase in market size.
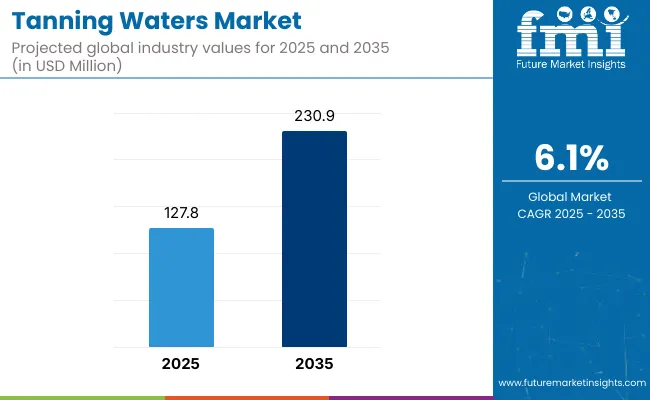
Quick Stats for Tanning Waters Market

  • Tanning Waters Market Value (2025): USD 127.8 million
  • Tanning Waters Market Forecast Value (2035): USD 230.9 million
  • Tanning Waters Market Forecast CAGR: 6.1%
  • Leading Segment in Tanning Waters Market in 2025: Gradual Tanning Water (31.2%)
  • Key Growth Regions in the Tanning Waters Market: North America, Asia-Pacific, Europe
  • Top Key Players in Tanning Waters Market:Isle of Paradise, St. Tropez, Tan-Luxe, Bondi Sands, Vita Liberata, James Read, Bali Body, MineTan, L'Oréal Paris, Three Warriors

Tanning Waters Market

Metric Value
Tanning Waters Market Estimated Value in (2025E) USD 127.8 million
Tanning Waters Market Forecast Value in (2035F) USD 230.9 million
Forecast CAGR (2025 to 2035) 6.1%

During the first five-year period from 2025 to 2030, the market increases from USD 127.8 million to USD 171.85million, which accounts for 42.7% of the total decade growth. This phase records steady adoption in skincare routines, facial tanning products, and hydrating formulations, driven by the need for non-invasive, streak-free self-tanning solutions. Gradual tanning waters dominate this period as they cater to over 30% of facial and body applications requiring daily use flexibility.

The second half from 2030 to 2035 contributes USD 59 million, equal to 57.3% of total growth, as the market jumps from USD 171.85million to USD 230.9 million. This acceleration is powered by widespread deployment of natural ingredient formulations, clean beauty innovations, and premium DTC brands offering targeted skincare-plus-tanning hybrids. Natural/organic-based formats capture a larger share above 55% by the end of the decade. Packaging and formulation upgrades add recurring revenue, increasing the spray bottle format share beyond 38% in total value.

From 2020 to 2024, the Tanning Waters Market transitioned from a niche beauty trend into an emerging product category, supported by growing consumer demand for lightweight, hydrating, and streak-free tanning solutions. During this early phase, market momentum was largely driven by clean beauty positioning, skincare-tanning hybridization, and the rise of direct-to-consumer (DTC) brands. Leading players such as Isle of Paradise, St. Tropez, and Tan-Luxe captured strong visibility, contributing to over 65% of category revenues through strategic online-first launches and high-performance gradual tanning products. Competitive differentiation centered around natural ingredient formulations, no-transfer claims, and inclusivity across skin tones. Larger cosmetic houses were present but often underweighted in this format, treating tanning waters as part of seasonal or limited-edition ranges.

Demand for tanning waters is projected to expand to USD 127.8 million in 2025, with a compound annual growth rate (CAGR) of 6.1% through 2035. The revenue mix is expected to evolve, with premium skincare-integrated tanning waters gaining preference across markets like the USA, UK, China, and Japan. Product innovations increasingly emphasize hydration, anti-aging benefits, and natural actives like coconut water and botanical extracts.

Traditional leaders are experiencing growing competition from emerging clean beauty brands and regional players in Asia-Pacific who are offering water-based formats tailored to localized skincare routines. Established brands are expanding into face-specific tanning waters, refillable formats, and dermatologist-tested claims to retain consumer trust.

The competitive advantage is shifting from standalone product performance to ecosystem depth spanning sustainable packaging, loyalty-driven DTC strategies, and AI-powered shade matching tools. Recurring revenue models are being tested through subscription boxes, mini packs, and bundling with skincare regimens. As clean-label and functional benefits converge, the market is likely to favor brands that deliver inclusive, ingredient-transparent, and digitally personalized tanning water solutions across a global consumer base.

Why the Tanning Waters Market is growing?

The tanning waters market is expanding due to its alignment with skincare-centric beauty routines. Unlike traditional self-tanners, tanning waters offer hydration, anti-aging actives, and vitamin-enriched formulations. Products combining coconut water, aloe vera, and botanical antioxidants now serve dual purposesproviding a natural tan while improving skin health. This hybrid positioning appeals to consumers seeking lightweight, non-comedogenic, and multifunctional solutions, especially in facial care.

Rapid growth of direct-to-consumer (DTC) channels and influencer-backed launches has accelerated tanning water adoption. Startups like Isle of Paradise and Bali Body have leveraged TikTok and Instagram to normalize clear, no-transfer tanning waters, reaching younger consumers who prioritize clean aesthetics, transparency, and convenience.

Segmental Analysis

The tanning waters market is segmented by product type, ingredient base, functionality, packaging format, distribution channel, and region, reflecting the category’s innovation depth and diverse consumer use cases. Product type includes gradual tanning water, instant tanning water, face and body tanning waters, tanning mists, self-tan sprays, tanning water serums, and lotionseach addressing varying levels of tan intensity, skin zones, and reapplication preferences.

Ingredient base covers natural/organic-based formulations such as coconut water, aloe vera, and botanical extracts like green tea and chamomile, alongside synthetic/chemical-based ingredients like dihydroxyacetone (DHA), erythrulose, glycerin, and alcohol-based formats, which ensure tanning efficacy and formulation stability.

Functional segmentation spans hydrating tanning waters, fragrance-infused variants, SPF-enriched options, anti-aging benefits, and streak-free or transfer-resistant formats designed to enhance user experience and product performance. Packaging formats include spray bottles, pump bottles, mist cans, dropper bottles, and travel-size packs, each supporting different use occasions and shelf appeal.

Distribution channels encompass beauty retail chains, e-commerce platforms, specialty cosmetic stores, pharmacies and drugstores, supermarkets and hypermarkets, salon and spa retail, and direct-to-consumer (DTC) brands, indicating an omni-channel expansion across premium and mass-market access points. Regionally, the market is active in North America, Europe, Asia-Pacific, and emerging areas across Latin America and the Middle East & Africa, driven by varying climate influences, digital retail maturity, and evolving beauty routines.
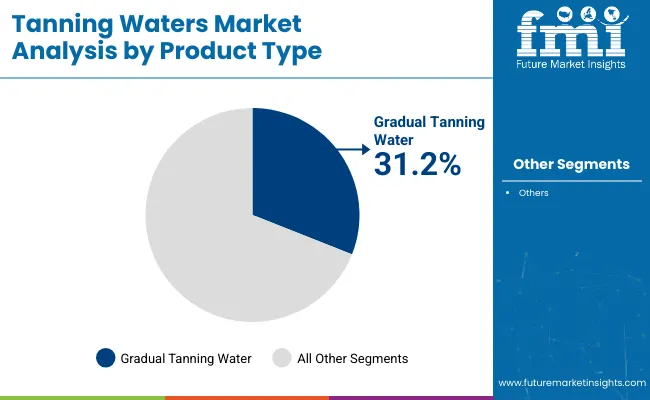
Insights into the Product Type Segment with Gradual Tanning Water Leading in Market Share

Tanning Waters Market By Product Type

Product Type Value Share% 2025
Gradual Tanning Water 31.2%
Others 68.8%

Gradual tanning water is expected to dominate the product type segment in 2025 with a 31.2% market share, reflecting its strong consumer appeal as a buildable, low-risk self-tanning solution. Its ease of use, minimal transfer, and compatibility with daily skincare routines have positioned it as the preferred format for new users and skincare-conscious consumers alike.

Compared to instant or spray-based variants, gradual tanning water allows controlled application with natural-looking results, contributing to higher repeat usage. The remaining 68.8% is shared across instant formats, face/body-specific waters, and mists, which cater to more specialized or occasional-use segments.
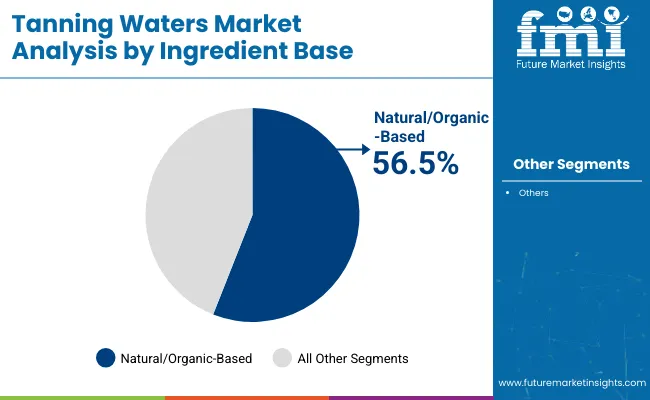
Insights into the Ingredient Base Segment with Natural/Organic-Based Dominating the Demand

Tanning Waters Market By Ingrdient Type

Ingredient Base Value Share% 2025
Natural/Organic-Based 56.50%
Others 43.5%

Natural/organic-based formulations are projected to lead the ingredient base segment with a 56.5% value share in 2025, driven by consumer preference for clean-label, skin-friendly ingredients. Tanning waters infused with coconut water, aloe vera, and botanical extracts like chamomile and green tea are increasingly favored for their dual benefits of hydration and skin nourishment.

This segment resonates strongly with health-conscious and sensitive-skin users who seek transparency in beauty formulations. In contrast, the remaining 43.5%comprising synthetic bases like DHA, erythrulose, and glycerincontinues to support efficacy-driven products but faces growing pressure from the clean beauty movement.
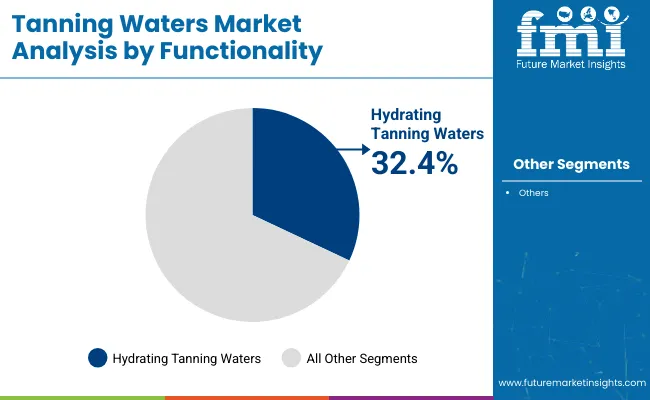
Insights into the Functionality Segment with Focus on Hydrating Tanning Waters

Tanning Waters Market By Functionality

Functionality Value Share% 2025
Hydrating Tanning Waters 32.4%
Others 67.6%

Hydrating tanning waters are set to account for 32.4% of the functionality segment’s value share in 2025, highlighting their strong alignment with modern skincare-first beauty preferences. These formulations appeal to users seeking a natural tan without compromising skin moisture, often featuring ingredients like hyaluronic acid, coconut water, or aloe vera. Their rise reflects growing demand for multipurpose products that offer both aesthetic and dermatological benefits.

While other functionalitiessuch as SPF, anti-aging, or fragrance-infused variantscollectively make up 67.6%, hydration remains the cornerstone of differentiation, particularly in facial tanning waters and daily-use routines.

What are the Drivers, Restraints, and Key Trends of the Tanning Waters Market?

Rise of Skincare-Tanning Hybrids

The integration of skincare functionality into tanning products has become a key growth lever for the tanning waters market. Unlike traditional self-tanners, which often dry out the skin or leave streaks, modern tanning waters are formulated with hydrating and skin-beneficial ingredients such as hyaluronic acid, aloe vera, vitamin C, niacinamide, and botanical extracts. These hybrid products not only offer a sun-kissed glow but also enhance skin texture, lock in moisture, and address sensitivity and redness.

This dual-functionality appeals to consumers who are increasingly seeking minimal-step beauty routines that are gentle on the skin. The skincare-first approach of tanning waters is particularly attractive to facial product users, as it eliminates the need for heavy creams or transfer-prone lotions. With consumers becoming more aware of what they apply to their skin, the ability of tanning waters to deliver cosmetic results alongside dermatological benefits is becoming a strong purchase driver.

The market is also benefiting from a shift in beauty marketing that emphasizes skin health and radiance over artificial or deep bronzing, especially in urban and wellness-focused consumer segments. As brands continue to highlight their formulas’ hydration and skin-conditioning properties, skincare-tanning hybrids are expected to dominate product development pipelines.

Surge in DTC and Social-First Brand Strategies

The growth of direct-to-consumer (DTC) and social-first strategies has transformed the go-to-market model for tanning waters, allowing newer brands to bypass traditional retail gatekeepers and engage directly with niche consumer communities. Brands such as Isle of Paradise, Tan-Luxe, and Bali Body have successfully leveraged Instagram, TikTok, and YouTube to build cult followings through influencer campaigns, real-time product tutorials, and unfiltered reviews.

These platforms allow for viral education on proper application, before-and-after visuals, and benefit demonstrations, which have been critical in introducing consumers to the unique clear format of tanning waters. Moreover, the social-first branding appeals to younger audiences who value authenticity, user-generated content, and immediate product gratification. DTC models also enable brands to launch limited-edition drops, subscription-based refills, and bundle strategies that encourage repeat purchasing and personalization.

Without relying on legacy retailers, DTC players can experiment with branding, packaging, and formulations tailored to specific micro-segments such as vegan skincare, fragrance-free formats, or shade-specific solutions. As a result, the tanning waters category is seeing faster product innovation cycles and more agile marketing strategies compared to traditional self-tanning formats. This ecosystem, enabled by digital-native brand building and e-commerce scalability, is significantly driving category penetration and revenue growth.

Limited Consumer Awareness in Emerging Markets

One of the major restraints for the tanning waters market is the limited consumer awareness and low market penetration across emerging economies in regions such as Latin America, Southeast Asia, Africa, and parts of Eastern Europe. In these markets, cultural norms often do not prioritize sunless tanning, and there is a stronger inclination toward either natural sun exposure or traditional cosmetic routines. Furthermore, consumers may not be familiar with the concept of a clear, water-based tanning product, leading to confusion about its benefits or efficacy compared to more well-known self-tanning creams and sprays.

Another challenge is the relatively low offline visibility of tanning waters in these regions, where modern trade channels and DTC brands may not yet be as developed. As a result, product discovery remains limited to digitally savvy consumers, often concentrated in urban centers. In addition, higher price points for premium, ingredient-rich tanning waters can be a deterrent in price-sensitive markets. While awareness is slowly building through influencer spillover and global brand expansions, the lack of culturally contextual marketing, limited shelf presence, and minimal education on usage continue to restrict broader consumer adoption in these regions, ultimately constraining global market growth potential.

Shift Toward Clean, Transparent Formulations

The tanning waters market is undergoing a significant shift toward clean beauty, with consumers increasingly demanding transparency in ingredients, ethical sourcing, and minimalist, skin-safe formulations. As part of this trend, tanning water brands are moving away from synthetic fragrances, harsh alcohols, and parabens, replacing them with naturally derived actives, plant-based humectants, and skin-calming botanicals.

Formulations that feature coconut water, chamomile, aloe vera, and green tea are gaining traction due to their perceived gentleness and added skincare benefits. Brands are also actively communicating their cruelty-free, vegan, and dermatologically tested certifications on packaging and digital platforms to reinforce consumer trust. Regulatory pressures and consumer pushback against greenwashing have made clean formulation claims a differentiator, especially in the DTC space. This transparency extends to product labeling, where simplified ingredient lists, sustainability indicators, and pH-balanced formulas are now emphasized as core value propositions.

As tanning waters are often used on sensitive facial skin, safety and purity are becoming primary purchase criteria. With beauty consumers increasingly aligning their purchases with personal values and wellness priorities, the clean beauty trend is not only elevating product formulation standards in the tanning waters segment but also redefining what constitutes premium value and long-term brand loyalty.
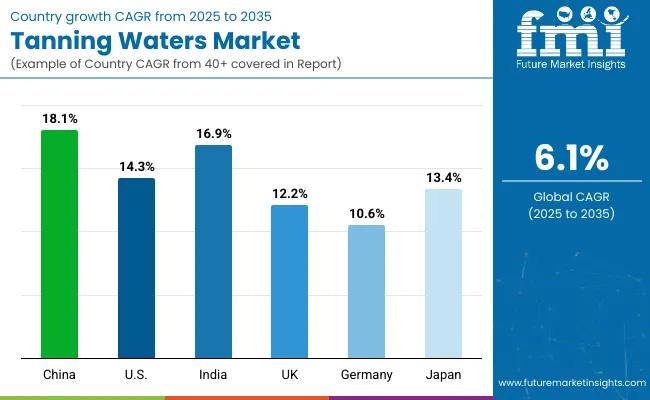
Analysis of Tanning Waters Market By Key Countries

Tanning Waters Market Country

Countries CAGR (2025 to 2035)
China 18.1%
USA 14.3%
India 16.9%
UK 12.2%
Germany 10.6%
Japan 13.4%

The tanning waters market is experiencing robust global growth, with China leading at a CAGR of 18.1% between 2025 and 2035, driven by rising awareness of skincare-integrated tanning solutions, the expansion of e-commerce, and shifting beauty ideals among Gen Z consumers. India follows closely with a 16.9% CAGR, supported by growing urban demand for multifunctional, natural ingredient-based beauty products like coconut and aloe vera-infused waters. The USA market, growing at 14.3%, remains a key revenue driver due to high product familiarity, dominance of DTC brands, and strong consumer preference for clean-label, hydration-focused tanning waters.

Japan’s 13.4% CAGR reflects a maturing market aligned with skincare-first routines and minimalistic aesthetics that favor lightweight, streak-free tanning formats. In the UK, a 12.2% CAGR is driven by innovation in facial tanning waters and sustained consumer engagement with influencer-led beauty trends. Germany, while posting a more modest 10.6% CAGR, continues to expand gradually through the demand for organic-certified and dermatologically tested formulations. Across these countries, the market’s growth is being shaped by digital-first marketing, demand for skincare hybrids, and the increasing alignment of tanning waters with clean beauty standards and wellness-oriented personal care.

Sales Outlook for 3D Scanning in the United States

Year USA Tanning Water Market (USD Million)
2025 41.44
2026 43.29
2027 45.23
2028 47.25
2029 49.37
2030 51.58
2031 53.88
2032 56.29
2033 58.81
2034 61.44
2035 64.19

The Tanning Waters Market in the United States is projected to grow at a CAGR of 4.5%, driven by the expanding demand for skincare-integrated self-tanning solutions and a shift toward clean, hydration-focused beauty routines. Gradual tanning waters and face-specific formulations are gaining popularity due to their natural finish and ease of daily use, particularly among Gen Z and millennial consumers. The strong presence of direct-to-consumer brands has accelerated awareness and accessibility, with influencer-driven marketing playing a significant role in category expansion.

Growth is also supported by increasing shelf space in beauty retail chains and pharmacies, where clear-label, non-comedogenic tanning waters are positioned as safe alternatives to traditional bronzers and lotions. As consumers seek multifunctional products that align with their skincare goals, brands are responding with hybrid formulations that hydrate, tan, and nourish the skin simultaneously. Additionally, refillable formats and travel-size options are gaining momentum due to consumer interest in sustainable and on-the-go beauty.

  • Face tanning waters are seeing strong growth among daily skincare users seeking streak-free, lightweight options.
  • DTC brands are capturing younger demographics through targeted influencer and TikTok campaigns.
  • Hydration-based hybrid formulations are driving premium product adoption in both online and retail channels.

Growth and Expansion Outlook for Tanning Waters Market in the United Kingdom

The Tanning Waters Market in the United Kingdom is expected to grow at a CAGR of 12.2%, driven by increasing consumer preference for natural-looking tans, the rise of clean beauty movements, and strong market penetration of facial-specific tanning waters. British consumers, particularly millennials and Gen Z, are gravitating toward clear, non-transfer formulations that align with minimalist skincare routines and sensitive skin needs.

The UK market has seen a surge in demand for gradual tanning waters and hybrid products enriched with botanicals, hyaluronic acid, and vitamin-infused ingredients. Premium brands have capitalized on this by offering tailored face and body products that combine self-tanning with skincare benefits. Additionally, the UK’s established beauty retail ecosystemranging from Boots and Superdrug to online platforms like Cult Beautyprovides strong visibility and accessibility. The category is further expanding through influencer marketing, seasonal promotions, and high engagement on TikTokand Instagram. While self-tan mists and serums are gaining popularity, facial tanning waters remain a leading format, especially within wellness and skincare-focused consumer groups.

  • Facial tanning waters are widely adopted for their clean, buildable finish suited to sensitive skin.
  • Influencer-driven promotions and seasonal campaigns drive rapid product turnover and interest.
  • Multi-use skincare-tanning hybrids are gaining shelf space across premium and pharmacy retailers.

Growth and Expansion Outlook for Tanning Waters Market in India

The Tanning Waters Market in India is forecast to expand at a strong CAGR of 16.9% through 2035, driven by rising awareness of skincare-integrated beauty routines, increasing internet penetration, and growing exposure to global clean beauty trends. While India has traditionally not been a core market for sunless tanning, urban millennials and Gen Z consumersparticularly in tier-1 and emerging tier-2 citiesare increasingly seeking lightweight, non-greasy products that enhance skin radiance without UV exposure.

Influencer marketing, Korean and Western beauty content, and dermatologist-backed recommendations are helping shift perceptions around self-tanning from artificial bronzing to skin-enhancing hydration. The market is also seeing traction through e-commerce-first product launches and DTC platforms offering plant-based tanning waters featuring ingredients like aloe vera, coconut water, and botanical extracts. With skincare literacy improving and disposable income rising, beauty consumers are experimenting with facial tanning waters, especially as part of travel kits or summer skincare bundles. Domestic startups and regional wellness brands are expected to localize tanning water positioning by integrating Ayurveda-aligned ingredients and catering to diverse Indian skin tones.

  • E-commerce channels are fueling adoption in tier-1 and tier-2 cities via influencer and dermatologist content.
  • Natural ingredient-based tanning waters are resonating with skincare-conscious Indian consumers.
  • Local players are exploring Ayurveda-inspired self-tanning products tailored to Indian skin profiles.

Sales Outlook for Tanning Waters in China

The Tanning Waters Market in China is expected to grow at a CAGR of 18.1%, the highest among leading economies, as evolving beauty standards and cross-border trends fuel demand for sunless tanning solutions. Traditionally, tanning has held limited appeal in China, where fair skin is culturally valued. However, younger consumers are now embracing a more globalized beauty perspective that prioritizes healthy glow and skincare functionality over deep pigmentation.

The rise of wellness-centered beauty, K-beauty influence, and hydration-driven skincare is reshaping demand for clear, light-textured tanning waters. Domestic DTC brands and cross-border e-commerce platforms such as Tmall Global and Xiaohongshu are rapidly expanding the market by promoting hybrid products enriched with ingredients like coconut water, niacinamide, and green tea extract.

Influencer-driven product discovery and growing acceptance of natural tan enhancers are pushing facial tanning waters into the spotlight, particularly in urban centers like Shanghai, Shenzhen, and Beijing. Additionally, competitively priced formulations by emerging Chinese beauty tech startups are democratizing access to tanning waters across mid-tier cities and college-going youth.

  • Skincare-first beauty trends are driving adoption of tanning waters among Gen Z and young millennials.
  • E-commerce platforms are enabling rapid product access and beauty education across metro markets.
  • Domestic startups are launching clean, affordable tanning waters tailored to local preferences.

In-depth Analysis of Tanning Waters in Germany

Countries 2025 Share (%)
USA 32.4%
China 11.2%
Japan 8.3%
Germany 9.6%
UK 13.9%
India 5.4%
Countries 2035 Share (%)
USA 27.8%
China 18.9%
Japan 9.1%
Germany 8.3%
UK 11.6%
India 10.3%

The Tanning Waters Market in Germany is anticipated to expand at a CAGR of 10.6% between 2025 and 2035, reaching a more mature growth trajectory compared to emerging markets. While Germany’s share of global sales is expected to decline from 9.6% in 2025 to 8.3% by 2035, the market continues to exhibit resilience in niche and premium skincare segments. High consumer awareness about UV-related skin damage has reinforced the preference for self-tanning solutions, especially among women aged 30-55.

Dermatologically tested formulations with clean-label claims are being prioritized, aligning with Germany’s longstanding demand for skin-safe, allergy-friendly products. Hydration-rich tanning waters are gaining attention due to their streak-free, lightweight nature and integration of skincare ingredients like hyaluronic acid, glycerin, and aloe vera. Pharmacy chains and organic beauty retailers remain the dominant sales channels, although growth in online platforms is picking up due to demand for international niche brands.

Younger German consumers are exploring sunless glow routines, often pairing tanning waters with facial serums and mist applications for a subtler finish. However, regulatory scrutiny on DHA (dihydroxyacetone) and consumer concerns about artificial fragrance and preservatives continue to influence product reformulation. Domestic brands are responding with short-ingredient-list SKUs and bio-certified tanning mists. Cross-border imports from France, the UK, and South Korea are also enriching product variety.

  • Premium skincare preferences and UV-conscious beauty culture are driving sustained demand for tanning waters.
  • Dermatological validation, fragrance-free labels, and bio-certification are shaping consumer choice.
  • Germany’s clean beauty ecosystem is favoring minimalist, hydrating tanning waters over traditional tanners.

Growth Outlook for Tanning Waters Market in USA

USA By Product Type Value Share% 2025
Gradual Tanning Water 32.50%
Others 67.5%

The tanning waters market in the USA is projected to grow from USD 41.44 million in 2025 to USD 64.19 million by 2035, registering a CAGR of 4.5% during the forecast period. Gradual tanning water is estimated to account for 32.5% of the product-type value share in 2025, while the remaining 67.5% is captured by instant or hybrid formats such as fast-developing sprays and skincare-infused tanning waters. Growth is being driven by shifting consumer preference away from UV-based tanning toward clean-label, sunless alternatives that offer safer bronzing effects.

The appeal of mess-free application, quick absorption, and transparent formulation has allowed tanning waters to outperform traditional lotions and mousses in urban markets. With product positioning now focused on hydration, skincare actives, and streak-free finishes, multifunctionality is being prioritized in new launches. Online retail is accelerating category visibility through influencer-led content and DTC-exclusive releases.

Innovations such as custom tone matching, fragrance-free variants, and sensitive skin-focused formulas are further expanding appeal among Gen Z and dermatologically conscious users. As awareness of skin cancer risks from sunbeds and tanning booths increases, tanning waters are expected to become a staple in the USA beauty routines across gender and age segments.

Opportunity Analysis of ChinaTanning Waters Market

China By Ingredient Base Value Share% 2025
Natural/Organic-Based 61.5%
Others 39.0%

China is positioned as a major growth engine in the global tanning waters market, capturing USD 14.32

million of total market value in 2025. The demand surge is being powered by the expanding middle-class consumer base prioritizing safe, skin-friendly alternatives to sun-based tanning. Natural and organic-based formulations are commanding a dominant 61.5% share in the Chinese market, as ingredient transparency and clean beauty become decisive purchase drivers. Consumers are showing greater sensitivity toward chemical-free, hydrating formulations infused with botanicals, antioxidants, and soothing agents like aloe vera or green tea.

This preference shift is being reinforced by stringent local regulations and social media amplification of wellness-centric beauty routines. Moreover, premium brands are positioning natural tanning waters as skincare hybrids, offering gradual bronzing effects alongside moisturizing and anti-aging benefits. The rising influence of Gen Z and millennials in Tier 1 and Tier 2 cities, coupled with their inclination toward vegan and cruelty-free cosmetics, is enhancing product uptake. As a result, companies focusing on eco-friendly packaging, clean ingredient labels, and skin-nourishing actives are expected to tap into significant white spaces in this fast-evolving market.
  • China accounts for 11.2% of global market value in 2025
  • Natural/organic-based tanning waters dominate with 61.5% share
  • Growth supported by rising eco-conscious beauty preferences and premiumization of sunless tanning.

Competitive Landscape of Tanning Waters Market

Tanning Waters Market By Company

The Tanning Waters Market remains moderately fragmented, shaped by global personal care majors, mid-sized innovators, and niche disruptors competing across clean, skincare-infused, and sprayable water-based formats. Key players like L'Oréal Paris, St. Tropez, and Bondi Sands hold strong positions due to broad distribution, multifunctional claims, and dermatologist-backed actives such as hyaluronic acid and niacinamide. Mid-sized brands including Tan-Luxe, Vita Liberata, and MineTan are gaining traction with clean-label, skin-adaptive tanning waters tailored for premium consumers in North America and Europe.

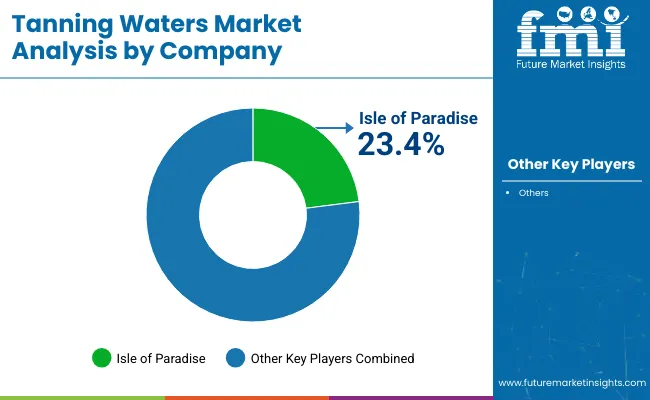
Niche players like Isle of Paradise, which holds the highest global value share at 23.4% in 2025, alongside James Read, Bali Body, and Three Warriors, are building loyalty among Gen Z and millennial audiences through vegan formulations, sustainable sourcing, and influencer-led campaigns. These brands differentiate through innovations in color-correcting mists, natural DHA, and biodegradable packaging. As the market evolves, value is increasingly tied to wellness-aligned positioning, microbiome-friendly ingredients, and tech-enabled engagement, with players shifting toward hybrid tanning-skincare formats and digitally enhanced consumer journeys.

Key Developments in Tanning Waters Market

  • In March 2025, Isle of Paradise unveiled its newly reformulated Self‑Tan Drops, engineered to blend seamlessly with moisturizers while delivering an even, hydrating tan. These dermatologist-approved drops prioritize skin health by combining color-correcting actives with plant oils known for nourishing and smoothing the skin. This expansion reflects the brand’s strategic shift toward skincare-first sunless tanning formats, reinforcing its leadership in clear, zero-transfer tanning water product innovation.
  • In early March 2025, St. Tropez launched a hybrid product combining bronzing drops with fake tan, designed to provide instant glow while gradually deepening the tan over four hours. This new offering meets growing consumer demand for quick, buildable results and flexible application methods. It extends St. Tropez’s tanning water portfolio into face-adaptable and drop-based formats, reinforcing its premium positioning and innovation in the skincare-integrated self-tanning space.

Scope of the Report

Item Value
Quantitative Units USD 127.8 Million
Product Type Gradual Tanning Water, Instant Tanning Water, Face Tanning Water, Body Tanning Water, Tanning Mists, Self-Tan Sprays, Tanning Water Serums, Tanning Water Lotions
Ingredient Base Hydrating Tanning Waters, Fragrance-Infused Tanning Waters, Tanning Waters with SPF, Anti-Aging Tanning Waters, Transfer-Resistant/Streak-Free Tanning Waters
Packaging Format Spray Bottles, Pump Bottles, Mist Cans, Dropper Bottles, Travel-size Packs
Distribution Channel Beauty Retail Chains, E-commerce Platforms, Specialty Cosmetic Stores, Pharmacies & Drugstores, Supermarkets & Hypermarkets, Salon & Spa Retail, Direct-to-Consumer (DTC) Brands
Regions Covered North America, Europe, Asia-Pacific, Latin America, Middle East & Africa
Country Covered United States, Canada, Germany, France, United Kingdom, China, Japan, India, Brazil, South Africa
Key Companies Profiled Isle of Paradise, St. Tropez, Tan-Luxe, Bondi Sands, Vita Liberata , James Read, Bali Body, MineTan , L'Oréal Paris, Three Warriors
Additional Attributes Dollar sales by product format and skin type compatibility, segmentation by gender-neutral and vegan-certified formulations, adoption trends in dermatologically tested and fragrance-free variants, growth in hybrid skincare-tanning innovations, packaging preferences in recyclable and travel-friendly formats, seasonal demand spikes influenced by tourism and festival calendars, e-commerce acceleration through influencer-led product discovery, regional trends shaped by sunless tanning regulations and UV awareness campaigns, and formulation innovations using natural DHA alternatives, vitamin-enriched bases, and hydrating actives like hyaluronic acid and glycerin.

Table of Content

  1. Executive Summary
    • Global Market Outlook
    • Demand-side Trends
    • Supply-side Trends
    • Technology Roadmap Analysis
    • Analysis and Recommendations
  2. Market Overview
    • Market Coverage / Taxonomy
    • Market Definition / Scope / Limitations
  3. Market Background
    • Market Dynamics
      • Drivers
      • Restraints
      • Opportunity
      • Trends
    • Scenario Forecast
      • Demand in Optimistic Scenario
      • Demand in Likely Scenario
      • Demand in Conservative Scenario
    • Opportunity Map Analysis
    • Product Life Cycle Analysis
    • Supply Chain Analysis
      • Supply Side Participants and their Roles
        • Producers
        • Mid-Level Participants (Traders/ Agents/ Brokers)
        • Wholesalers and Distributors
      • Value Added and Value Created at Node in the Supply Chain
      • List of Raw Material Suppliers
      • List of Existing and Potential Buyer’s
    • Investment Feasibility Matrix
    • Value Chain Analysis
      • Profit Margin Analysis
      • Wholesalers and Distributors
      • Retailers
    • PESTLE and Porter’s Analysis
    • Regulatory Landscape
      • By Key Regions
      • By Key Countries
    • Regional Parent Market Outlook
    • Production and Consumption Statistics
    • Import and Export Statistics
  4. Global Market Analysis 2020 to 2024 and Forecast, 2025 to 2035
    • Historical Market Size Value (USD Million) & Volume (Units) Analysis, 2020 to 2024
    • Current and Future Market Size Value (USD Million) & Volume (Units) Projections, 2025 to 2035
      • Y-o-Y Growth Trend Analysis
      • Absolute $ Opportunity Analysis
  5. Global Market Analysis 2020 to 2024 and Forecast 2025 to 2035, By Product Type
    • Introduction / Key Findings
    • Historical Market Size Value (USD Million) & Volume (Units) Analysis By Product Type, 2020 to 2024
    • Current and Future Market Size Value (USD Million) & Volume (Units) Analysis and Forecast By Product Type, 2025 to 2035
      • Gradual Tanning Water
      • Face Tanning Water
      • Instant Tanning Water
      • Body Tanning Water
      • Tanning Mists
      • Self-Tan Sprays
      • Serums
      • Lotions
    • Y-o-Y Growth Trend Analysis By Product Type, 2020 to 2024
    • Absolute $ Opportunity Analysis By Product Type, 2025 to 2035
  6. Global Market Analysis 2020 to 2024 and Forecast 2025 to 2035, By Ingredient Base
    • Introduction / Key Findings
    • Historical Market Size Value (USD Million) & Volume (Units) Analysis By Ingredient Base, 2020 to 2024
    • Current and Future Market Size Value (USD Million) & Volume (Units) Analysis and Forecast By Ingredient Base, 2025 to 2035
      • Natural/Organic-Based
        • Coconut Water
        • Aloe Vera
        • Botanical Extracts (e.g., Green Tea, Chamomile)
      • Synthetic/Chemical-Based
        • Dihydroxyacetone (DHA)
        • Erythrulose
        • Glycerin
        • Alcohol-based Formulas
    • Y-o-Y Growth Trend Analysis By Ingredient Base, 2020 to 2024
    • Absolute $ Opportunity Analysis By Ingredient Base, 2025 to 2035
  7. Global Market Analysis 2020 to 2024 and Forecast 2025 to 2035, By Functionality
    • Introduction / Key Findings
    • Historical Market Size Value (USD Million) & Volume (Units) Analysis By Functionality, 2020 to 2024
    • Current and Future Market Size Value (USD Million) & Volume (Units) Analysis and Forecast By Functionality, 2025 to 2035
      • Hydrating Tanning Waters
      • Fragrance-Infused Tanning Waters
      • Tanning Waters with SPF
      • Anti-Aging Tanning Waters
      • Transfer-Resistant/Streak-Free Tanning Waters
    • Y-o-Y Growth Trend Analysis By Functionality, 2020 to 2024
    • Absolute $ Opportunity Analysis By Functionality, 2025 to 2035
  8. Global Market Analysis 2020 to 2024 and Forecast 2025 to 2035, By Packaging Format
    • Introduction / Key Findings
    • Historical Market Size Value (USD Million) & Volume (Units) Analysis By Packaging Format, 2020 to 2024
    • Current and Future Market Size Value (USD Million) & Volume (Units) Analysis and Forecast By Packaging Format, 2025 to 2035
      • Spray Bottles
      • Pump Bottles
      • Mist Cans
      • Dropper Bottles
      • Travel-size Packs
    • Y-o-Y Growth Trend Analysis By Packaging Format, 2020 to 2024
    • Absolute $ Opportunity Analysis By Packaging Format, 2025 to 2035
  9. Global Market Analysis 2020 to 2024 and Forecast 2025 to 2035, By Distribution Channel
    • Introduction / Key Findings
    • Historical Market Size Value (USD Million) & Volume (Units) Analysis By Distribution Channel, 2020 to 2024
    • Current and Future Market Size Value (USD Million) & Volume (Units) Analysis and Forecast By Distribution Channel, 2025 to 2035
      • Beauty Retail Chains
      • E-commerce Platforms
      • Specialty Cosmetic Stores
      • Pharmacies & Drugstores
      • Supermarkets & Hypermarkets
      • Salon & Spa Retail
      • Direct-to-Consumer (DTC) Brands
    • Y-o-Y Growth Trend Analysis By Distribution Channel, 2020 to 2024
    • Absolute $ Opportunity Analysis By Distribution Channel, 2025 to 2035
  10. Global Market Analysis 2020 to 2024 and Forecast 2025 to 2035, By Region
    • Introduction
    • Historical Market Size Value (USD Million) & Volume (Units) Analysis By Region, 2020 to 2024
    • Current Market Size Value (USD Million) & Volume (Units) Analysis and Forecast By Region, 2025 to 2035
      • North America
      • Latin America
      • Europe
      • East Asia
      • South Asia & Pacific
      • Middle East and Africa
    • Market Attractiveness Analysis By Region
  11. North America Market Analysis 2020 to 2024 and Forecast 2025 to 2035, By Country
    • Historical Market Size Value (USD Million) & Volume (Units) Trend Analysis By Market Taxonomy, 2020 to 2024
    • Market Size Value (USD Million) & Volume (Units) Forecast By Market Taxonomy, 2025 to 2035
      • By Country
        • USA
        • Canada
      • By Product Type
      • By Ingredient Base
      • By Functionality
      • By Packaging Format
      • By Distribution Channel
    • Market Attractiveness Analysis
      • By Country
      • By Product Type
      • By Ingredient Base
      • By Functionality
      • By Packaging Format
      • By Distribution Channel
    • Key Takeaways
  12. Latin America Market Analysis 2020 to 2024 and Forecast 2025 to 2035, By Country
    • Historical Market Size Value (USD Million) & Volume (Units) Trend Analysis By Market Taxonomy, 2020 to 2024
    • Market Size Value (USD Million) & Volume (Units) Forecast By Market Taxonomy, 2025 to 2035
      • By Country
        • Brazil
        • Mexico
        • Colombia
        • Rest of Latin America
      • By Product Type
      • By Ingredient Base
      • By Functionality
      • By Packaging Format
      • By Distribution Channel
    • Market Attractiveness Analysis
      • By Country
      • By Product Type
      • By Ingredient Base
      • By Functionality
      • By Packaging Format
      • By Distribution Channel
    • Key Takeaways
  13. Europe Market Analysis 2020 to 2024 and Forecast 2025 to 2035, By Country
    • Historical Market Size Value (USD Million) & Volume (Units) Trend Analysis By Market Taxonomy, 2020 to 2024
    • Market Size Value (USD Million) & Volume (Units) Forecast By Market Taxonomy, 2025 to 2035
      • By Country
        • Germany
        • UK
        • France
        • Italy
        • Spain
        • Belgium
        • Netherlands
        • Nordic
        • Switzerland
        • Russia
        • Poland
        • Rest of Europe
      • By Product Type
      • By Ingredient Base
      • By Functionality
      • By Packaging Format
      • By Distribution Channel
    • Market Attractiveness Analysis
      • By Country
      • By Product Type
      • By Ingredient Base
      • By Functionality
      • By Packaging Format
      • By Distribution Channel
    • Key Takeaways
  14. East Asia Market Analysis 2020 to 2024 and Forecast 2025 to 2035, By Country
    • Historical Market Size Value (USD Million) & Volume (Units) Trend Analysis By Market Taxonomy, 2020 to 2024
    • Market Size Value (USD Million) & Volume (Units) Forecast By Market Taxonomy, 2025 to 2035
      • By Country
        • China
        • Japan
        • South Korea
      • By Product Type
      • By Ingredient Base
      • By Functionality
      • By Packaging Format
      • By Distribution Channel
    • Market Attractiveness Analysis
      • By Country
      • By Product Type
      • By Ingredient Base
      • By Functionality
      • By Packaging Format
      • By Distribution Channel
    • Key Takeaways
  15. South Asia & Pacific Market Analysis 2020 to 2024 and Forecast 2025 to 2035, By Country
    • Historical Market Size Value (USD Million) & Volume (Units) Trend Analysis By Market Taxonomy, 2020 to 2024
    • Market Size Value (USD Million) & Volume (Units) Forecast By Market Taxonomy, 2025 to 2035
      • By Country
        • India
        • Thailand
        • Malaysia
        • Indonesia
        • Singapore
        • Vietnam
        • Australia
        • New Zealand
        • Rest of South Asia
      • By Product Type
      • By Ingredient Base
      • By Functionality
      • By Packaging Format
      • By Distribution Channel
    • Market Attractiveness Analysis
      • By Country
      • By Product Type
      • By Ingredient Base
      • By Functionality
      • By Packaging Format
      • By Distribution Channel
    • Key Takeaways
  16. Middle East and Africa Market Analysis 2020 to 2024 and Forecast 2025 to 2035, By Country
    • Historical Market Size Value (USD Million) & Volume (Units) Trend Analysis By Market Taxonomy, 2020 to 2024
    • Market Size Value (USD Million) & Volume (Units) Forecast By Market Taxonomy, 2025 to 2035
      • By Country
        • Turkey
        • UAE
        • Saudi Arabia
        • Israel
        • Other GCC Countries
        • North Africa
        • South Africa
      • By Product Type
      • By Ingredient Base
      • By Functionality
      • By Packaging Format
      • By Distribution Channel
    • Market Attractiveness Analysis
      • By Country
      • By Product Type
      • By Ingredient Base
      • By Functionality
      • By Packaging Format
      • By Distribution Channel
    • Key Takeaways
  17. Key Countries Market Analysis
    • USA
      • Pricing Analysis
      • Market Share Analysis, 2024
        • By Product Type
        • By Ingredient Base
        • By Functionality
        • By Packaging Format
        • By Distribution Channel
    • Canada
      • Pricing Analysis
      • Market Share Analysis, 2024
        • By Product Type
        • By Ingredient Base
        • By Functionality
        • By Packaging Format
        • By Distribution Channel
    • Brazil
      • Pricing Analysis
      • Market Share Analysis, 2024
        • By Product Type
        • By Ingredient Base
        • By Functionality
        • By Packaging Format
        • By Distribution Channel
    • Mexico
      • Pricing Analysis
      • Market Share Analysis, 2024
        • By Product Type
        • By Ingredient Base
        • By Functionality
        • By Packaging Format
        • By Distribution Channel
    • Colombia
      • Pricing Analysis
      • Market Share Analysis, 2024
        • By Product Type
        • By Ingredient Base
        • By Functionality
        • By Packaging Format
        • By Distribution Channel
    • Germany
      • Pricing Analysis
      • Market Share Analysis, 2024
        • By Product Type
        • By Ingredient Base
        • By Functionality
        • By Packaging Format
        • By Distribution Channel
    • UK
      • Pricing Analysis
      • Market Share Analysis, 2024
        • By Product Type
        • By Ingredient Base
        • By Functionality
        • By Packaging Format
        • By Distribution Channel
    • France
      • Pricing Analysis
      • Market Share Analysis, 2024
        • By Product Type
        • By Ingredient Base
        • By Functionality
        • By Packaging Format
        • By Distribution Channel
    • Italy
      • Pricing Analysis
      • Market Share Analysis, 2024
        • By Product Type
        • By Ingredient Base
        • By Functionality
        • By Packaging Format
        • By Distribution Channel
    • Spain
      • Pricing Analysis
      • Market Share Analysis, 2024
        • By Product Type
        • By Ingredient Base
        • By Functionality
        • By Packaging Format
        • By Distribution Channel
    • Belgium
      • Pricing Analysis
      • Market Share Analysis, 2024
        • By Product Type
        • By Ingredient Base
        • By Functionality
        • By Packaging Format
        • By Distribution Channel
    • Netherlands
      • Pricing Analysis
      • Market Share Analysis, 2024
        • By Product Type
        • By Ingredient Base
        • By Functionality
        • By Packaging Format
        • By Distribution Channel
    • Nordic
      • Pricing Analysis
      • Market Share Analysis, 2024
        • By Product Type
        • By Ingredient Base
        • By Functionality
        • By Packaging Format
        • By Distribution Channel
    • Switzerland
      • Pricing Analysis
      • Market Share Analysis, 2024
        • By Product Type
        • By Ingredient Base
        • By Functionality
        • By Packaging Format
        • By Distribution Channel
    • Russia
      • Pricing Analysis
      • Market Share Analysis, 2024
        • By Product Type
        • By Ingredient Base
        • By Functionality
        • By Packaging Format
        • By Distribution Channel
    • Poland
      • Pricing Analysis
      • Market Share Analysis, 2024
        • By Product Type
        • By Ingredient Base
        • By Functionality
        • By Packaging Format
        • By Distribution Channel
    • China
      • Pricing Analysis
      • Market Share Analysis, 2024
        • By Product Type
        • By Ingredient Base
        • By Functionality
        • By Packaging Format
        • By Distribution Channel
    • Japan
      • Pricing Analysis
      • Market Share Analysis, 2024
        • By Product Type
        • By Ingredient Base
        • By Functionality
        • By Packaging Format
        • By Distribution Channel
    • South Korea
      • Pricing Analysis
      • Market Share Analysis, 2024
        • By Product Type
        • By Ingredient Base
        • By Functionality
        • By Packaging Format
        • By Distribution Channel
    • India
      • Pricing Analysis
      • Market Share Analysis, 2024
        • By Product Type
        • By Ingredient Base
        • By Functionality
        • By Packaging Format
        • By Distribution Channel
    • Thailand
      • Pricing Analysis
      • Market Share Analysis, 2024
        • By Product Type
        • By Ingredient Base
        • By Functionality
        • By Packaging Format
        • By Distribution Channel
    • Indonesia
      • Pricing Analysis
      • Market Share Analysis, 2024
        • By Product Type
        • By Ingredient Base
        • By Functionality
        • By Packaging Format
        • By Distribution Channel
    • Australia
      • Pricing Analysis
      • Market Share Analysis, 2024
        • By Product Type
        • By Ingredient Base
        • By Functionality
        • By Packaging Format
        • By Distribution Channel
    • New Zealand
      • Pricing Analysis
      • Market Share Analysis, 2024
        • By Product Type
        • By Ingredient Base
        • By Functionality
        • By Packaging Format
        • By Distribution Channel
    • Turkey
      • Pricing Analysis
      • Market Share Analysis, 2024
        • By Product Type
        • By Ingredient Base
        • By Functionality
        • By Packaging Format
        • By Distribution Channel
    • UAE
      • Pricing Analysis
      • Market Share Analysis, 2024
        • By Product Type
        • By Ingredient Base
        • By Functionality
        • By Packaging Format
        • By Distribution Channel
    • Saudi Arabia
      • Pricing Analysis
      • Market Share Analysis, 2024
        • By Product Type
        • By Ingredient Base
        • By Functionality
        • By Packaging Format
        • By Distribution Channel
    • Israel
      • Pricing Analysis
      • Market Share Analysis, 2024
        • By Product Type
        • By Ingredient Base
        • By Functionality
        • By Packaging Format
        • By Distribution Channel
    • North Africa
      • Pricing Analysis
      • Market Share Analysis, 2024
        • By Product Type
        • By Ingredient Base
        • By Functionality
        • By Packaging Format
        • By Distribution Channel
    • South Africa
      • Pricing Analysis
      • Market Share Analysis, 2024
        • By Product Type
        • By Ingredient Base
        • By Functionality
        • By Packaging Format
        • By Distribution Channel
  18. Market Structure Analysis
    • Competition Dashboard
    • Competition Benchmarking
    • Market Share Analysis of Top Players
      • By Regional
      • By Product Type
      • By Ingredient Base
      • By Functionality
      • By Packaging Format
      • By Distribution Channel
  19. Competition Analysis
    • Competition Deep Dive
      • Isle of Paradise
        • Overview
        • Product Portfolio
        • Profitability by Market Segments (Product/Age /Sales Channel/Region)
        • Sales Footprint
        • Strategy Overview
          • Marketing Strategy
          • Product Strategy
          • Channel Strategy
      • St. Tropez
        • Overview
        • Product Portfolio
        • Profitability by Market Segments (Product/Age /Sales Channel/Region)
        • Sales Footprint
        • Strategy Overview
          • Marketing Strategy
          • Product Strategy
          • Channel Strategy
      • Tan-Luxe
        • Overview
        • Product Portfolio
        • Profitability by Market Segments (Product/Age /Sales Channel/Region)
        • Sales Footprint
        • Strategy Overview
          • Marketing Strategy
          • Product Strategy
          • Channel Strategy
      • Bondi Sands
        • Overview
        • Product Portfolio
        • Profitability by Market Segments (Product/Age /Sales Channel/Region)
        • Sales Footprint
        • Strategy Overview
          • Marketing Strategy
          • Product Strategy
          • Channel Strategy
      • Vita Liberata
        • Overview
        • Product Portfolio
        • Profitability by Market Segments (Product/Age /Sales Channel/Region)
        • Sales Footprint
        • Strategy Overview
          • Marketing Strategy
          • Product Strategy
          • Channel Strategy
      • James Read
        • Overview
        • Product Portfolio
        • Profitability by Market Segments (Product/Age /Sales Channel/Region)
        • Sales Footprint
        • Strategy Overview
          • Marketing Strategy
          • Product Strategy
          • Channel Strategy
      • Bali Body
        • Overview
        • Product Portfolio
        • Profitability by Market Segments (Product/Age /Sales Channel/Region)
        • Sales Footprint
        • Strategy Overview
          • Marketing Strategy
          • Product Strategy
          • Channel Strategy
      • MineTan
        • Overview
        • Product Portfolio
        • Profitability by Market Segments (Product/Age /Sales Channel/Region)
        • Sales Footprint
        • Strategy Overview
          • Marketing Strategy
          • Product Strategy
          • Channel Strategy
      • L'Oréal Paris
        • Overview
        • Product Portfolio
        • Profitability by Market Segments (Product/Age /Sales Channel/Region)
        • Sales Footprint
        • Strategy Overview
          • Marketing Strategy
          • Product Strategy
          • Channel Strategy
      • Three Warriors
        • Overview
        • Product Portfolio
        • Profitability by Market Segments (Product/Age /Sales Channel/Region)
        • Sales Footprint
        • Strategy Overview
          • Marketing Strategy
          • Product Strategy
          • Channel Strategy
      • Others
        • Overview
        • Product Portfolio
        • Profitability by Market Segments (Product/Age /Sales Channel/Region)
        • Sales Footprint
        • Strategy Overview
          • Marketing Strategy
          • Product Strategy
          • Channel Strategy
  20. Assumptions & Acronyms Used
  21. Research Methodology

List of Tables

  • Table 1: Global Market Value (USD Million) Forecast by Region, 2020-2035
  • Table 2: Global Market Volume (Units) Forecast by Region, 2020-2035
  • Table 3: Global Market Value (USD Million) Forecast by Product Type, 2020-2035
  • Table 4: Global Market Volume (Units) Forecast by Product Type, 2020-2035
  • Table 5: Global Market Value (USD Million) Forecast by Ingredient Base, 2020-2035
  • Table 6: Global Market Volume (Units) Forecast by Ingredient Base, 2020-2035
  • Table 7: Global Market Value (USD Million) Forecast by Functionality, 2020-2035
  • Table 8: Global Market Volume (Units) Forecast by Functionality, 2020-2035
  • Table 9: Global Market Value (USD Million) Forecast by Packaging Format, 2020-2035
  • Table 10: Global Market Volume (Units) Forecast by Packaging Format, 2020-2035
  • Table 11: Global Market Value (USD Million) Forecast by Distribution Channel, 2020-2035
  • Table 12: Global Market Volume (Units) Forecast by Distribution Channel, 2020-2035
  • Table 13: North America Market Value (USD Million) Forecast by Country, 2020-2035
  • Table 14: North America Market Volume (Units) Forecast by Country, 2020-2035
  • Table 15: North America Market Value (USD Million) Forecast by Product Type, 2020-2035
  • Table 16: North America Market Volume (Units) Forecast by Product Type, 2020-2035
  • Table 17: North America Market Value (USD Million) Forecast by Ingredient Base, 2020-2035
  • Table 18: North America Market Volume (Units) Forecast by Ingredient Base, 2020-2035
  • Table 19: North America Market Value (USD Million) Forecast by Functionality, 2020-2035
  • Table 20: North America Market Volume (Units) Forecast by Functionality, 2020-2035
  • Table 21: North America Market Value (USD Million) Forecast by Packaging Format, 2020-2035
  • Table 22: North America Market Volume (Units) Forecast by Packaging Format, 2020-2035
  • Table 23: North America Market Value (USD Million) Forecast by Distribution Channel, 2020-2035
  • Table 24: North America Market Volume (Units) Forecast by Distribution Channel, 2020-2035
  • Table 25: Latin America Market Value (USD Million) Forecast by Country, 2020-2035
  • Table 26: Latin America Market Volume (Units) Forecast by Country, 2020-2035
  • Table 27: Latin America Market Value (USD Million) Forecast by Product Type, 2020-2035
  • Table 28: Latin America Market Volume (Units) Forecast by Product Type, 2020-2035
  • Table 29: Latin America Market Value (USD Million) Forecast by Ingredient Base, 2020-2035
  • Table 30: Latin America Market Volume (Units) Forecast by Ingredient Base, 2020-2035
  • Table 31: Latin America Market Value (USD Million) Forecast by Functionality, 2020-2035
  • Table 32: Latin America Market Volume (Units) Forecast by Functionality, 2020-2035
  • Table 33: Latin America Market Value (USD Million) Forecast by Packaging Format, 2020-2035
  • Table 34: Latin America Market Volume (Units) Forecast by Packaging Format, 2020-2035
  • Table 35: Latin America Market Value (USD Million) Forecast by Distribution Channel, 2020-2035
  • Table 36: Latin America Market Volume (Units) Forecast by Distribution Channel, 2020-2035
  • Table 37: Europe Market Value (USD Million) Forecast by Country, 2020-2035
  • Table 38: Europe Market Volume (Units) Forecast by Country, 2020-2035
  • Table 39: Europe Market Value (USD Million) Forecast by Product Type, 2020-2035
  • Table 40: Europe Market Volume (Units) Forecast by Product Type, 2020-2035
  • Table 41: Europe Market Value (USD Million) Forecast by Ingredient Base, 2020-2035
  • Table 42: Europe Market Volume (Units) Forecast by Ingredient Base, 2020-2035
  • Table 43: Europe Market Value (USD Million) Forecast by Functionality, 2020-2035
  • Table 44: Europe Market Volume (Units) Forecast by Functionality, 2020-2035
  • Table 45: Europe Market Value (USD Million) Forecast by Packaging Format, 2020-2035
  • Table 46: Europe Market Volume (Units) Forecast by Packaging Format, 2020-2035
  • Table 47: Europe Market Value (USD Million) Forecast by Distribution Channel, 2020-2035
  • Table 48: Europe Market Volume (Units) Forecast by Distribution Channel, 2020-2035
  • Table 49: East Asia Market Value (USD Million) Forecast by Country, 2020-2035
  • Table 50: East Asia Market Volume (Units) Forecast by Country, 2020-2035
  • Table 51: East Asia Market Value (USD Million) Forecast by Product Type, 2020-2035
  • Table 52: East Asia Market Volume (Units) Forecast by Product Type, 2020-2035
  • Table 53: East Asia Market Value (USD Million) Forecast by Ingredient Base, 2020-2035
  • Table 54: East Asia Market Volume (Units) Forecast by Ingredient Base, 2020-2035
  • Table 55: East Asia Market Value (USD Million) Forecast by Functionality, 2020-2035
  • Table 56: East Asia Market Volume (Units) Forecast by Functionality, 2020-2035
  • Table 57: East Asia Market Value (USD Million) Forecast by Packaging Format, 2020-2035
  • Table 58: East Asia Market Volume (Units) Forecast by Packaging Format, 2020-2035
  • Table 59: East Asia Market Value (USD Million) Forecast by Distribution Channel, 2020-2035
  • Table 60: East Asia Market Volume (Units) Forecast by Distribution Channel, 2020-2035
  • Table 61: South Asia & Pacific Market Value (USD Million) Forecast by Country, 2020-2035
  • Table 62: South Asia & Pacific Market Volume (Units) Forecast by Country, 2020-2035
  • Table 63: South Asia & Pacific Market Value (USD Million) Forecast by Product Type, 2020-2035
  • Table 64: South Asia & Pacific Market Volume (Units) Forecast by Product Type, 2020-2035
  • Table 65: South Asia & Pacific Market Value (USD Million) Forecast by Ingredient Base, 2020-2035
  • Table 66: South Asia & Pacific Market Volume (Units) Forecast by Ingredient Base, 2020-2035
  • Table 67: South Asia & Pacific Market Value (USD Million) Forecast by Functionality, 2020-2035
  • Table 68: South Asia & Pacific Market Volume (Units) Forecast by Functionality, 2020-2035
  • Table 69: South Asia & Pacific Market Value (USD Million) Forecast by Packaging Format, 2020-2035
  • Table 70: South Asia & Pacific Market Volume (Units) Forecast by Packaging Format, 2020-2035
  • Table 71: South Asia & Pacific Market Value (USD Million) Forecast by Distribution Channel, 2020-2035
  • Table 72: South Asia & Pacific Market Volume (Units) Forecast by Distribution Channel, 2020-2035
  • Table 73: Middle East and Africa Market Value (USD Million) Forecast by Country, 2020-2035
  • Table 74: Middle East and Africa Market Volume (Units) Forecast by Country, 2020-2035
  • Table 75: Middle East and Africa Market Value (USD Million) Forecast by Product Type, 2020-2035
  • Table 76: Middle East and Africa Market Volume (Units) Forecast by Product Type, 2020-2035
  • Table 77: Middle East and Africa Market Value (USD Million) Forecast by Ingredient Base, 2020-2035
  • Table 78: Middle East and Africa Market Volume (Units) Forecast by Ingredient Base, 2020-2035
  • Table 79: Middle East and Africa Market Value (USD Million) Forecast by Functionality, 2020-2035
  • Table 80: Middle East and Africa Market Volume (Units) Forecast by Functionality, 2020-2035
  • Table 81: Middle East and Africa Market Value (USD Million) Forecast by Packaging Format, 2020-2035
  • Table 82: Middle East and Africa Market Volume (Units) Forecast by Packaging Format, 2020-2035
  • Table 83: Middle East and Africa Market Value (USD Million) Forecast by Distribution Channel, 2020-2035
  • Table 84: Middle East and Africa Market Volume (Units) Forecast by Distribution Channel, 2020-2035

List of Figures

  • Figure 1: Global Market Value (USD Million) by Product Type, 2025-2035
  • Figure 2: Global Market Value (USD Million) by Ingredient Base, 2025-2035
  • Figure 3: Global Market Value (USD Million) by Functionality, 2025-2035
  • Figure 4: Global Market Value (USD Million) by Packaging Format, 2025-2035
  • Figure 5: Global Market Value (USD Million) by Distribution Channel, 2025-2035
  • Figure 6: Global Market Value (USD Million) by Region, 2025-2035
  • Figure 7: Global Market Value (USD Million) Analysis by Region, 2020-2035
  • Figure 8: Global Market Volume (Units) Analysis by Region, 2020-2035
  • Figure 9: Global Market Value Share (%) and BPS Analysis by Region, 2025-2035
  • Figure 10: Global Market Y-o-Y Growth (%) Projections by Region, 2025-2035
  • Figure 11: Global Market Value (USD Million) Analysis by Product Type, 2020-2035
  • Figure 12: Global Market Volume (Units) Analysis by Product Type, 2020-2035
  • Figure 13: Global Market Value Share (%) and BPS Analysis by Product Type, 2025-2035
  • Figure 14: Global Market Y-o-Y Growth (%) Projections by Product Type, 2025-2035
  • Figure 15: Global Market Value (USD Million) Analysis by Ingredient Base, 2020-2035
  • Figure 16: Global Market Volume (Units) Analysis by Ingredient Base, 2020-2035
  • Figure 17: Global Market Value Share (%) and BPS Analysis by Ingredient Base, 2025-2035
  • Figure 18: Global Market Y-o-Y Growth (%) Projections by Ingredient Base, 2025-2035
  • Figure 19: Global Market Value (USD Million) Analysis by Functionality, 2020-2035
  • Figure 20: Global Market Volume (Units) Analysis by Functionality, 2020-2035
  • Figure 21: Global Market Value Share (%) and BPS Analysis by Functionality, 2025-2035
  • Figure 22: Global Market Y-o-Y Growth (%) Projections by Functionality, 2025-2035
  • Figure 23: Global Market Value (USD Million) Analysis by Packaging Format, 2020-2035
  • Figure 24: Global Market Volume (Units) Analysis by Packaging Format, 2020-2035
  • Figure 25: Global Market Value Share (%) and BPS Analysis by Packaging Format, 2025-2035
  • Figure 26: Global Market Y-o-Y Growth (%) Projections by Packaging Format, 2025-2035
  • Figure 27: Global Market Value (USD Million) Analysis by Distribution Channel, 2020-2035
  • Figure 28: Global Market Volume (Units) Analysis by Distribution Channel, 2020-2035
  • Figure 29: Global Market Value Share (%) and BPS Analysis by Distribution Channel, 2025-2035
  • Figure 30: Global Market Y-o-Y Growth (%) Projections by Distribution Channel, 2025-2035
  • Figure 31: Global Market Attractiveness by Product Type, 2025-2035
  • Figure 32: Global Market Attractiveness by Ingredient Base, 2025-2035
  • Figure 33: Global Market Attractiveness by Functionality, 2025-2035
  • Figure 34: Global Market Attractiveness by Packaging Format, 2025-2035
  • Figure 35: Global Market Attractiveness by Distribution Channel, 2025-2035
  • Figure 36: Global Market Attractiveness by Region, 2025-2035
  • Figure 37: North America Market Value (USD Million) by Product Type, 2025-2035
  • Figure 38: North America Market Value (USD Million) by Ingredient Base, 2025-2035
  • Figure 39: North America Market Value (USD Million) by Functionality, 2025-2035
  • Figure 40: North America Market Value (USD Million) by Packaging Format, 2025-2035
  • Figure 41: North America Market Value (USD Million) by Distribution Channel, 2025-2035
  • Figure 42: North America Market Value (USD Million) by Country, 2025-2035
  • Figure 43: North America Market Value (USD Million) Analysis by Country, 2020-2035
  • Figure 44: North America Market Volume (Units) Analysis by Country, 2020-2035
  • Figure 45: North America Market Value Share (%) and BPS Analysis by Country, 2025-2035
  • Figure 46: North America Market Y-o-Y Growth (%) Projections by Country, 2025-2035
  • Figure 47: North America Market Value (USD Million) Analysis by Product Type, 2020-2035
  • Figure 48: North America Market Volume (Units) Analysis by Product Type, 2020-2035
  • Figure 49: North America Market Value Share (%) and BPS Analysis by Product Type, 2025-2035
  • Figure 50: North America Market Y-o-Y Growth (%) Projections by Product Type, 2025-2035
  • Figure 51: North America Market Value (USD Million) Analysis by Ingredient Base, 2020-2035
  • Figure 52: North America Market Volume (Units) Analysis by Ingredient Base, 2020-2035
  • Figure 53: North America Market Value Share (%) and BPS Analysis by Ingredient Base, 2025-2035
  • Figure 54: North America Market Y-o-Y Growth (%) Projections by Ingredient Base, 2025-2035
  • Figure 55: North America Market Value (USD Million) Analysis by Functionality, 2020-2035
  • Figure 56: North America Market Volume (Units) Analysis by Functionality, 2020-2035
  • Figure 57: North America Market Value Share (%) and BPS Analysis by Functionality, 2025-2035
  • Figure 58: North America Market Y-o-Y Growth (%) Projections by Functionality, 2025-2035
  • Figure 59: North America Market Value (USD Million) Analysis by Packaging Format, 2020-2035
  • Figure 60: North America Market Volume (Units) Analysis by Packaging Format, 2020-2035
  • Figure 61: North America Market Value Share (%) and BPS Analysis by Packaging Format, 2025-2035
  • Figure 62: North America Market Y-o-Y Growth (%) Projections by Packaging Format, 2025-2035
  • Figure 63: North America Market Value (USD Million) Analysis by Distribution Channel, 2020-2035
  • Figure 64: North America Market Volume (Units) Analysis by Distribution Channel, 2020-2035
  • Figure 65: North America Market Value Share (%) and BPS Analysis by Distribution Channel, 2025-2035
  • Figure 66: North America Market Y-o-Y Growth (%) Projections by Distribution Channel, 2025-2035
  • Figure 67: North America Market Attractiveness by Product Type, 2025-2035
  • Figure 68: North America Market Attractiveness by Ingredient Base, 2025-2035
  • Figure 69: North America Market Attractiveness by Functionality, 2025-2035
  • Figure 70: North America Market Attractiveness by Packaging Format, 2025-2035
  • Figure 71: North America Market Attractiveness by Distribution Channel, 2025-2035
  • Figure 72: North America Market Attractiveness by Country, 2025-2035
  • Figure 73: Latin America Market Value (USD Million) by Product Type, 2025-2035
  • Figure 74: Latin America Market Value (USD Million) by Ingredient Base, 2025-2035
  • Figure 75: Latin America Market Value (USD Million) by Functionality, 2025-2035
  • Figure 76: Latin America Market Value (USD Million) by Packaging Format, 2025-2035
  • Figure 77: Latin America Market Value (USD Million) by Distribution Channel, 2025-2035
  • Figure 78: Latin America Market Value (USD Million) by Country, 2025-2035
  • Figure 79: Latin America Market Value (USD Million) Analysis by Country, 2020-2035
  • Figure 80: Latin America Market Volume (Units) Analysis by Country, 2020-2035
  • Figure 81: Latin America Market Value Share (%) and BPS Analysis by Country, 2025-2035
  • Figure 82: Latin America Market Y-o-Y Growth (%) Projections by Country, 2025-2035
  • Figure 83: Latin America Market Value (USD Million) Analysis by Product Type, 2020-2035
  • Figure 84: Latin America Market Volume (Units) Analysis by Product Type, 2020-2035
  • Figure 85: Latin America Market Value Share (%) and BPS Analysis by Product Type, 2025-2035
  • Figure 86: Latin America Market Y-o-Y Growth (%) Projections by Product Type, 2025-2035
  • Figure 87: Latin America Market Value (USD Million) Analysis by Ingredient Base, 2020-2035
  • Figure 88: Latin America Market Volume (Units) Analysis by Ingredient Base, 2020-2035
  • Figure 89: Latin America Market Value Share (%) and BPS Analysis by Ingredient Base, 2025-2035
  • Figure 90: Latin America Market Y-o-Y Growth (%) Projections by Ingredient Base, 2025-2035
  • Figure 91: Latin America Market Value (USD Million) Analysis by Functionality, 2020-2035
  • Figure 92: Latin America Market Volume (Units) Analysis by Functionality, 2020-2035
  • Figure 93: Latin America Market Value Share (%) and BPS Analysis by Functionality, 2025-2035
  • Figure 94: Latin America Market Y-o-Y Growth (%) Projections by Functionality, 2025-2035
  • Figure 95: Latin America Market Value (USD Million) Analysis by Packaging Format, 2020-2035
  • Figure 96: Latin America Market Volume (Units) Analysis by Packaging Format, 2020-2035
  • Figure 97: Latin America Market Value Share (%) and BPS Analysis by Packaging Format, 2025-2035
  • Figure 98: Latin America Market Y-o-Y Growth (%) Projections by Packaging Format, 2025-2035
  • Figure 99: Latin America Market Value (USD Million) Analysis by Distribution Channel, 2020-2035
  • Figure 100: Latin America Market Volume (Units) Analysis by Distribution Channel, 2020-2035
  • Figure 101: Latin America Market Value Share (%) and BPS Analysis by Distribution Channel, 2025-2035
  • Figure 102: Latin America Market Y-o-Y Growth (%) Projections by Distribution Channel, 2025-2035
  • Figure 103: Latin America Market Attractiveness by Product Type, 2025-2035
  • Figure 104: Latin America Market Attractiveness by Ingredient Base, 2025-2035
  • Figure 105: Latin America Market Attractiveness by Functionality, 2025-2035
  • Figure 106: Latin America Market Attractiveness by Packaging Format, 2025-2035
  • Figure 107: Latin America Market Attractiveness by Distribution Channel, 2025-2035
  • Figure 108: Latin America Market Attractiveness by Country, 2025-2035
  • Figure 109: Europe Market Value (USD Million) by Product Type, 2025-2035
  • Figure 110: Europe Market Value (USD Million) by Ingredient Base, 2025-2035
  • Figure 111: Europe Market Value (USD Million) by Functionality, 2025-2035
  • Figure 112: Europe Market Value (USD Million) by Packaging Format, 2025-2035
  • Figure 113: Europe Market Value (USD Million) by Distribution Channel, 2025-2035
  • Figure 114: Europe Market Value (USD Million) by Country, 2025-2035
  • Figure 115: Europe Market Value (USD Million) Analysis by Country, 2020-2035
  • Figure 116: Europe Market Volume (Units) Analysis by Country, 2020-2035
  • Figure 117: Europe Market Value Share (%) and BPS Analysis by Country, 2025-2035
  • Figure 118: Europe Market Y-o-Y Growth (%) Projections by Country, 2025-2035
  • Figure 119: Europe Market Value (USD Million) Analysis by Product Type, 2020-2035
  • Figure 120: Europe Market Volume (Units) Analysis by Product Type, 2020-2035
  • Figure 121: Europe Market Value Share (%) and BPS Analysis by Product Type, 2025-2035
  • Figure 122: Europe Market Y-o-Y Growth (%) Projections by Product Type, 2025-2035
  • Figure 123: Europe Market Value (USD Million) Analysis by Ingredient Base, 2020-2035
  • Figure 124: Europe Market Volume (Units) Analysis by Ingredient Base, 2020-2035
  • Figure 125: Europe Market Value Share (%) and BPS Analysis by Ingredient Base, 2025-2035
  • Figure 126: Europe Market Y-o-Y Growth (%) Projections by Ingredient Base, 2025-2035
  • Figure 127: Europe Market Value (USD Million) Analysis by Functionality, 2020-2035
  • Figure 128: Europe Market Volume (Units) Analysis by Functionality, 2020-2035
  • Figure 129: Europe Market Value Share (%) and BPS Analysis by Functionality, 2025-2035
  • Figure 130: Europe Market Y-o-Y Growth (%) Projections by Functionality, 2025-2035
  • Figure 131: Europe Market Value (USD Million) Analysis by Packaging Format, 2020-2035
  • Figure 132: Europe Market Volume (Units) Analysis by Packaging Format, 2020-2035
  • Figure 133: Europe Market Value Share (%) and BPS Analysis by Packaging Format, 2025-2035
  • Figure 134: Europe Market Y-o-Y Growth (%) Projections by Packaging Format, 2025-2035
  • Figure 135: Europe Market Value (USD Million) Analysis by Distribution Channel, 2020-2035
  • Figure 136: Europe Market Volume (Units) Analysis by Distribution Channel, 2020-2035
  • Figure 137: Europe Market Value Share (%) and BPS Analysis by Distribution Channel, 2025-2035
  • Figure 138: Europe Market Y-o-Y Growth (%) Projections by Distribution Channel, 2025-2035
  • Figure 139: Europe Market Attractiveness by Product Type, 2025-2035
  • Figure 140: Europe Market Attractiveness by Ingredient Base, 2025-2035
  • Figure 141: Europe Market Attractiveness by Functionality, 2025-2035
  • Figure 142: Europe Market Attractiveness by Packaging Format, 2025-2035
  • Figure 143: Europe Market Attractiveness by Distribution Channel, 2025-2035
  • Figure 144: Europe Market Attractiveness by Country, 2025-2035
  • Figure 145: East Asia Market Value (USD Million) by Product Type, 2025-2035
  • Figure 146: East Asia Market Value (USD Million) by Ingredient Base, 2025-2035
  • Figure 147: East Asia Market Value (USD Million) by Functionality, 2025-2035
  • Figure 148: East Asia Market Value (USD Million) by Packaging Format, 2025-2035
  • Figure 149: East Asia Market Value (USD Million) by Distribution Channel, 2025-2035
  • Figure 150: East Asia Market Value (USD Million) by Country, 2025-2035
  • Figure 151: East Asia Market Value (USD Million) Analysis by Country, 2020-2035
  • Figure 152: East Asia Market Volume (Units) Analysis by Country, 2020-2035
  • Figure 153: East Asia Market Value Share (%) and BPS Analysis by Country, 2025-2035
  • Figure 154: East Asia Market Y-o-Y Growth (%) Projections by Country, 2025-2035
  • Figure 155: East Asia Market Value (USD Million) Analysis by Product Type, 2020-2035
  • Figure 156: East Asia Market Volume (Units) Analysis by Product Type, 2020-2035
  • Figure 157: East Asia Market Value Share (%) and BPS Analysis by Product Type, 2025-2035
  • Figure 158: East Asia Market Y-o-Y Growth (%) Projections by Product Type, 2025-2035
  • Figure 159: East Asia Market Value (USD Million) Analysis by Ingredient Base, 2020-2035
  • Figure 160: East Asia Market Volume (Units) Analysis by Ingredient Base, 2020-2035
  • Figure 161: East Asia Market Value Share (%) and BPS Analysis by Ingredient Base, 2025-2035
  • Figure 162: East Asia Market Y-o-Y Growth (%) Projections by Ingredient Base, 2025-2035
  • Figure 163: East Asia Market Value (USD Million) Analysis by Functionality, 2020-2035
  • Figure 164: East Asia Market Volume (Units) Analysis by Functionality, 2020-2035
  • Figure 165: East Asia Market Value Share (%) and BPS Analysis by Functionality, 2025-2035
  • Figure 166: East Asia Market Y-o-Y Growth (%) Projections by Functionality, 2025-2035
  • Figure 167: East Asia Market Value (USD Million) Analysis by Packaging Format, 2020-2035
  • Figure 168: East Asia Market Volume (Units) Analysis by Packaging Format, 2020-2035
  • Figure 169: East Asia Market Value Share (%) and BPS Analysis by Packaging Format, 2025-2035
  • Figure 170: East Asia Market Y-o-Y Growth (%) Projections by Packaging Format, 2025-2035
  • Figure 171: East Asia Market Value (USD Million) Analysis by Distribution Channel, 2020-2035
  • Figure 172: East Asia Market Volume (Units) Analysis by Distribution Channel, 2020-2035
  • Figure 173: East Asia Market Value Share (%) and BPS Analysis by Distribution Channel, 2025-2035
  • Figure 174: East Asia Market Y-o-Y Growth (%) Projections by Distribution Channel, 2025-2035
  • Figure 175: East Asia Market Attractiveness by Product Type, 2025-2035
  • Figure 176: East Asia Market Attractiveness by Ingredient Base, 2025-2035
  • Figure 177: East Asia Market Attractiveness by Functionality, 2025-2035
  • Figure 178: East Asia Market Attractiveness by Packaging Format, 2025-2035
  • Figure 179: East Asia Market Attractiveness by Distribution Channel, 2025-2035
  • Figure 180: East Asia Market Attractiveness by Country, 2025-2035
  • Figure 181: South Asia & Pacific Market Value (USD Million) by Product Type, 2025-2035
  • Figure 182: South Asia & Pacific Market Value (USD Million) by Ingredient Base, 2025-2035
  • Figure 183: South Asia & Pacific Market Value (USD Million) by Functionality, 2025-2035
  • Figure 184: South Asia & Pacific Market Value (USD Million) by Packaging Format, 2025-2035
  • Figure 185: South Asia & Pacific Market Value (USD Million) by Distribution Channel, 2025-2035
  • Figure 186: South Asia & Pacific Market Value (USD Million) by Country, 2025-2035
  • Figure 187: South Asia & Pacific Market Value (USD Million) Analysis by Country, 2020-2035
  • Figure 188: South Asia & Pacific Market Volume (Units) Analysis by Country, 2020-2035
  • Figure 189: South Asia & Pacific Market Value Share (%) and BPS Analysis by Country, 2025-2035
  • Figure 190: South Asia & Pacific Market Y-o-Y Growth (%) Projections by Country, 2025-2035
  • Figure 191: South Asia & Pacific Market Value (USD Million) Analysis by Product Type, 2020-2035
  • Figure 192: South Asia & Pacific Market Volume (Units) Analysis by Product Type, 2020-2035
  • Figure 193: South Asia & Pacific Market Value Share (%) and BPS Analysis by Product Type, 2025-2035
  • Figure 194: South Asia & Pacific Market Y-o-Y Growth (%) Projections by Product Type, 2025-2035
  • Figure 195: South Asia & Pacific Market Value (USD Million) Analysis by Ingredient Base, 2020-2035
  • Figure 196: South Asia & Pacific Market Volume (Units) Analysis by Ingredient Base, 2020-2035
  • Figure 197: South Asia & Pacific Market Value Share (%) and BPS Analysis by Ingredient Base, 2025-2035
  • Figure 198: South Asia & Pacific Market Y-o-Y Growth (%) Projections by Ingredient Base, 2025-2035
  • Figure 199: South Asia & Pacific Market Value (USD Million) Analysis by Functionality, 2020-2035
  • Figure 200: South Asia & Pacific Market Volume (Units) Analysis by Functionality, 2020-2035
  • Figure 201: South Asia & Pacific Market Value Share (%) and BPS Analysis by Functionality, 2025-2035
  • Figure 202: South Asia & Pacific Market Y-o-Y Growth (%) Projections by Functionality, 2025-2035
  • Figure 203: South Asia & Pacific Market Value (USD Million) Analysis by Packaging Format, 2020-2035
  • Figure 204: South Asia & Pacific Market Volume (Units) Analysis by Packaging Format, 2020-2035
  • Figure 205: South Asia & Pacific Market Value Share (%) and BPS Analysis by Packaging Format, 2025-2035
  • Figure 206: South Asia & Pacific Market Y-o-Y Growth (%) Projections by Packaging Format, 2025-2035
  • Figure 207: South Asia & Pacific Market Value (USD Million) Analysis by Distribution Channel, 2020-2035
  • Figure 208: South Asia & Pacific Market Volume (Units) Analysis by Distribution Channel, 2020-2035
  • Figure 209: South Asia & Pacific Market Value Share (%) and BPS Analysis by Distribution Channel, 2025-2035
  • Figure 210: South Asia & Pacific Market Y-o-Y Growth (%) Projections by Distribution Channel, 2025-2035
  • Figure 211: South Asia & Pacific Market Attractiveness by Product Type, 2025-2035
  • Figure 212: South Asia & Pacific Market Attractiveness by Ingredient Base, 2025-2035
  • Figure 213: South Asia & Pacific Market Attractiveness by Functionality, 2025-2035
  • Figure 214: South Asia & Pacific Market Attractiveness by Packaging Format, 2025-2035
  • Figure 215: South Asia & Pacific Market Attractiveness by Distribution Channel, 2025-2035
  • Figure 216: South Asia & Pacific Market Attractiveness by Country, 2025-2035
  • Figure 217: Middle East and Africa Market Value (USD Million) by Product Type, 2025-2035
  • Figure 218: Middle East and Africa Market Value (USD Million) by Ingredient Base, 2025-2035
  • Figure 219: Middle East and Africa Market Value (USD Million) by Functionality, 2025-2035
  • Figure 220: Middle East and Africa Market Value (USD Million) by Packaging Format, 2025-2035
  • Figure 221: Middle East and Africa Market Value (USD Million) by Distribution Channel, 2025-2035
  • Figure 222: Middle East and Africa Market Value (USD Million) by Country, 2025-2035
  • Figure 223: Middle East and Africa Market Value (USD Million) Analysis by Country, 2020-2035
  • Figure 224: Middle East and Africa Market Volume (Units) Analysis by Country, 2020-2035
  • Figure 225: Middle East and Africa Market Value Share (%) and BPS Analysis by Country, 2025-2035
  • Figure 226: Middle East and Africa Market Y-o-Y Growth (%) Projections by Country, 2025-2035
  • Figure 227: Middle East and Africa Market Value (USD Million) Analysis by Product Type, 2020-2035
  • Figure 228: Middle East and Africa Market Volume (Units) Analysis by Product Type, 2020-2035
  • Figure 229: Middle East and Africa Market Value Share (%) and BPS Analysis by Product Type, 2025-2035
  • Figure 230: Middle East and Africa Market Y-o-Y Growth (%) Projections by Product Type, 2025-2035
  • Figure 231: Middle East and Africa Market Value (USD Million) Analysis by Ingredient Base, 2020-2035
  • Figure 232: Middle East and Africa Market Volume (Units) Analysis by Ingredient Base, 2020-2035
  • Figure 233: Middle East and Africa Market Value Share (%) and BPS Analysis by Ingredient Base, 2025-2035
  • Figure 234: Middle East and Africa Market Y-o-Y Growth (%) Projections by Ingredient Base, 2025-2035
  • Figure 235: Middle East and Africa Market Value (USD Million) Analysis by Functionality, 2020-2035
  • Figure 236: Middle East and Africa Market Volume (Units) Analysis by Functionality, 2020-2035
  • Figure 237: Middle East and Africa Market Value Share (%) and BPS Analysis by Functionality, 2025-2035
  • Figure 238: Middle East and Africa Market Y-o-Y Growth (%) Projections by Functionality, 2025-2035
  • Figure 239: Middle East and Africa Market Value (USD Million) Analysis by Packaging Format, 2020-2035
  • Figure 240: Middle East and Africa Market Volume (Units) Analysis by Packaging Format, 2020-2035
  • Figure 241: Middle East and Africa Market Value Share (%) and BPS Analysis by Packaging Format, 2025-2035
  • Figure 242: Middle East and Africa Market Y-o-Y Growth (%) Projections by Packaging Format, 2025-2035
  • Figure 243: Middle East and Africa Market Value (USD Million) Analysis by Distribution Channel, 2020-2035
  • Figure 244: Middle East and Africa Market Volume (Units) Analysis by Distribution Channel, 2020-2035
  • Figure 245: Middle East and Africa Market Value Share (%) and BPS Analysis by Distribution Channel, 2025-2035
  • Figure 246: Middle East and Africa Market Y-o-Y Growth (%) Projections by Distribution Channel, 2025-2035
  • Figure 247: Middle East and Africa Market Attractiveness by Product Type, 2025-2035
  • Figure 248: Middle East and Africa Market Attractiveness by Ingredient Base, 2025-2035
  • Figure 249: Middle East and Africa Market Attractiveness by Functionality, 2025-2035
  • Figure 250: Middle East and Africa Market Attractiveness by Packaging Format, 2025-2035
  • Figure 251: Middle East and Africa Market Attractiveness by Distribution Channel, 2025-2035
  • Figure 252: Middle East and Africa Market Attractiveness by Country, 2025-2035

Frequently Asked Questions

How big is the Tanning Waters Market in 2025?

The global Tanning Waters Market is estimated to be valued at USD 127.8 million in 2025.

What will be the size of Tanning Waters Market in 2035?

The market size for the Tanning Waters Market is projected to reach USD 230.9 million by 2035.

How much will be the Tanning Waters Market growth between 2025 and 2035?

The Tanning Waters Market is expected to grow at a 6.1% CAGR between 2025 and 2035.

What are the key product types in the Tanning Waters Market?

The key product types in the Tanning Waters Market include Spray Bottles, Mists, and Pump Dispensers, designed for even and mess-free application.

Which segment will contribute significant share in the Tanning Waters Market in 2025?

In terms of functionality, Hydration-Boosting Tanning Waters are projected to command a 32.4% share in the Tanning Waters Market in 2025.

Explore Similar Insights

Future Market Insights

Tanning Waters Market