Tapping Sleeves Market Size and Share Forecast Outlook 2025 to 2035

The global tapping sleeves market is valued at USD 2.8 billion in 2025 and is slated to reach USD 4.3 billion by 2035, which shows a CAGR of 4.5%.
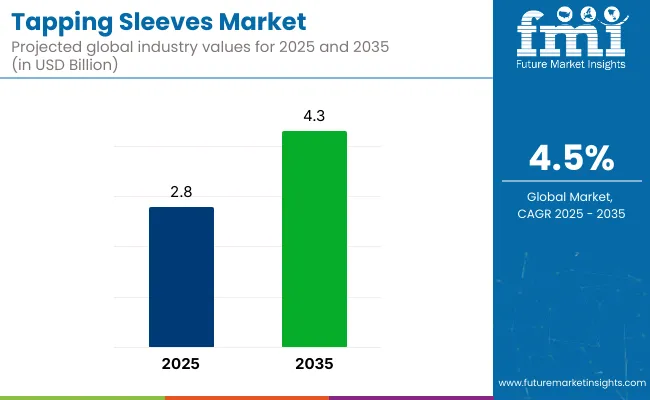
Quick Stats for Tapping Sleeves Market

  • Market Value (2025): USD 2.8 billion
  • Forecast Value (2035): USD 4.3 billion
  • Forecast CAGR: 4.5%
  • Fluid Motion Leader in 2025:Liquid (45% Market Share)
  • Top Application Segment: Drinking Water (40% Market Share in 2025)
  • Key Growth Region:North America (USA is the fastest-growing market with 4.6% CAGR)

Tapping Sleeves Market

Metric Value
Market Size 2025 USD 2.8 billion
Market Size 2035 USD 4.3 billion
CAGR 2025 to 2035 4.5%

Growth is being driven by increasing investments in pipeline infrastructure, stringent leakage prevention mandates, and the adoption of smart monitoring solutions. Additionally, the rising replacement of aging pipelines in major economies, along with rapid urbanization and industrialization in emerging countries, is further supporting market expansion.

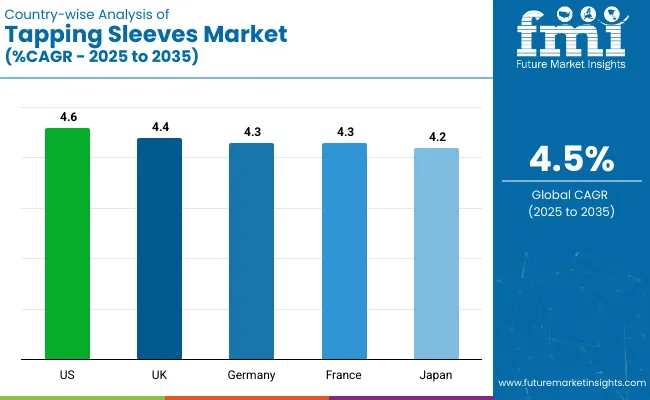
The USA holds the highest CAGR of 4.6% in the market, driven by its extensive infrastructure refurbishment initiatives and rapid technological adoption. The UK follows with a 4.4% CAGR, supported by investments in intelligent water management and leak prevention systems.

Germany is expected to record a 4.3% CAGR during the forecast period, due to the focus of the nation on sustainable water conservation and infrastructure. The steel segment continues to dominate the material category with a 35% share, while the drinking water segment maintains its leadership with a 40% share in 2025.

The tapping sleeves market holds a relatively small but essential share within its parent markets. In the global pipeline equipment market, tapping sleeves account for approximately 3-5% due to their niche application in branch connections and repairs. Within the industrial fittings market, they hold around 2-4%, as this market also includes valves, couplings, and flanges.

In the broader water infrastructure market, tapping sleeves contribute roughly 1-2% since the category spans treatment plants, pumps, and distribution systems. Similarly, tapping sleeves represent about 1-3% of the oil and gas infrastructure market and 2-4% of the utilities and distribution infrastructure market due to their specialised yet critical role.

Analyzing Tapping Sleeves Market by Top Investment Segments

The tapping sleeves market is segmented by material, inches, fluid motion, application, and region. By material, the market is categorized into steel(including fabricated carbon and stainless), ductile iron, and cast iron. Based on inches, the market is segmented into 1-10, 11-20, 21-30, 31-40, and above 40.

By fluid motion, the market is classified into liquid, gas, and oil. Based on application, the market is segmented into drinking water, waste water system, gas solution, and petroleum. Regionally, the market is segmented into North America, Latin America, Western Europe, Eastern Europe, Central Asia, Russia & Belarus, Balkan & Baltic Countries, Middle East and Africa (MEA), East Asia, and South Asia and Pacific.

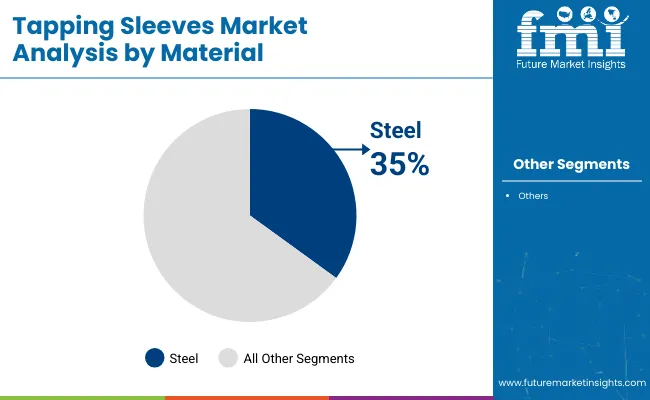
Steel to Lead the Material Segment with Over 35% Market Share in 2025

Steel remains the most lucrative material segment in the tapping sleeves market, accounting for a 35% market share in 2025.
  • Fabricated carbon tapping sleeves are witnessing steady growth as they offer an affordable alternative with sufficient tensile strength for moderate-pressure pipelines, particularly in developing regions.
  • Stainless steel continues to gain traction due to its superior corrosion resistance, ensuring extended product life, especially in drinking water applications.

Tapping Sleeves Market Analysis By Material

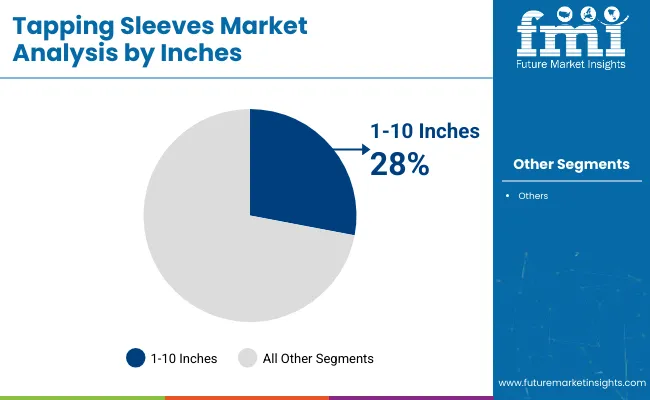
1-10 to Lead the Inches Segment with Over 28% Market Share in 2025

The 1-10 inch segment includes tapping sleeves used for pipelines within this diameter range, serving residential and light commercial applications. This segment holds a 28% market share in 2025, making it the largest within the industry.
  • Its dominance is attributed to extensive use in residential water distribution systems, small-scale commercial buildings, and utility pipelines that require compact connections.
  • These tapping sleeves are favored for their ease of installation, lower cost, and compatibility with municipal water supply upgrades and maintenance activities.

Tapping Sleeves Market Analysis By Inches

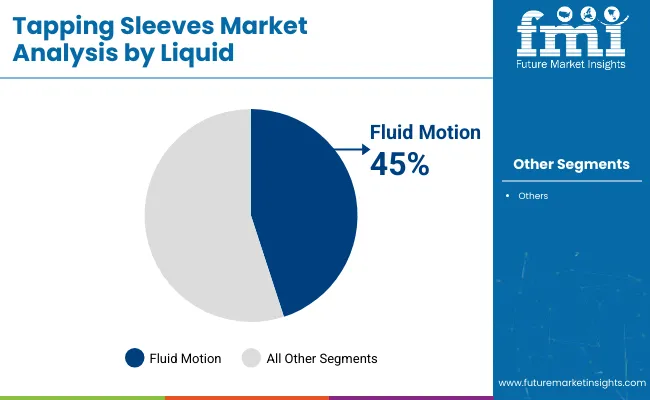
Liquid to Lead the Fluid Motion Segment with Over 45% Market Share in 2025

The liquid segment dominates the tapping sleeves market, holding a 45% market share in 2025.
  • Gas remains a significant segment as urbanization and industrial expansion continue to drive demand for leak-proof and high-pressure tapping sleeves for city gas distribution pipelines and industrial gas supply systems.
  • The oil segment also contributes steadily, as tapping sleeves are critical for pipeline maintenance, expansion, and emergency repairs within petroleum transport networks.

Tapping Sleeves Market Analysis By Liquid

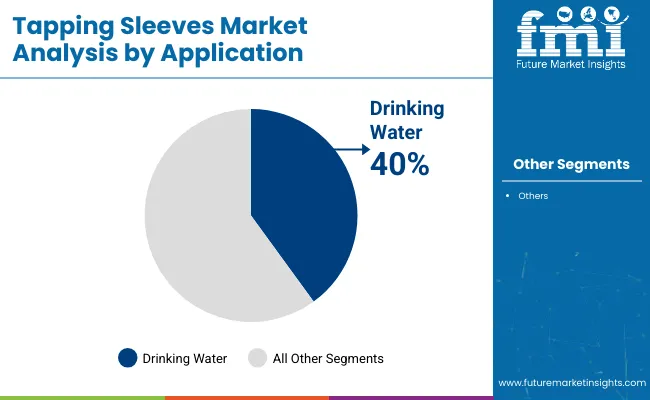
Drinking Water to Lead the Application Segment with Over 40% Market Share in 2025

The drinking water segment leads the tapping sleeves market, accounting for a 40% market share in 2025.
  • The wastewater system segment continues to see steady demand as municipalities invest in durable pipeline solutions for urban sanitation and industrial waste management to comply with environmental regulations.
  • The petroleum segment maintains its relevance as tapping sleeves are essential for pipeline expansion, repair, and maintenance in oil and gas transmission networks.

Tapping Sleeves Market Analysis By Application

Top Tapping Sleeves Market Dynamics

The global tapping sleeves market is growing steadily, driven by increasing investments in pipeline infrastructure, rising demand for leak-proof and durable pipeline connections, and advancements in corrosion-resistant materials and smart monitoring technologies.

Recent Trends in the Tapping Sleeves Market

  • Adoption of IoT-enabled tapping sleeves for real-time pipeline leak detection is increasing globally.
  • Manufacturers are developing corrosion-resistant alloys and composite materials for enhanced durability.
  • Companies are increasing investments in smart water infrastructure and automated pipeline monitoring systems.
  • Sustainable coatings and low-carbon steel tapping sleeves are gaining popularity to meet environmental standards.

Challenges in the Tapping Sleeves Market
  • Fluctuating raw material prices, especially for steel and ductile iron, are impacting manufacturing costs.
  • Geopolitical uncertainties and trade barriers are disrupting supply chains and increasing procurement risks.
  • The rapid adoption of advanced smart infrastructure solutions is increasing the risk of technological obsolescence for traditional tapping sleeves.
  • High initial investment costs for smart-enabled tapping sleeves are limiting adoption in cost-sensitive regions.

Analyzing Top Countries Manufacturing and Supplying Tapping Sleeves

Country Wise Analysis Of Tapping Sleeves Market Cagr 2025 To 2035

Between 2025 and 2035, the USA is expected to lead tapping sleeves market growth with a CAGR of 4.6%, driven by major infrastructure upgrades and smart water management investments. The UK follows with a 4.4% CAGR, supported by intelligent water management and carbon reduction initiatives.

Germany and France are projected to grow at 4.3% CAGR each, with Germany focusing on hydrogen infrastructure and France driven by EU water conservation regulations. Japan records the lowest among these at 4.2% CAGR, due to its focus on seismic-resistant pipelines and modernization efforts. Overall, all five countries show steady, infrastructure-driven growth trends.

The report covers in-depth analysis of 40+ countries; five top-performing OECD countries are highlighted below.

USA Tapping Sleeves Market Analysis

The USA tapping sleeves revenue is projected to grow at a CAGR of 4.6% from 2025 to 2035. Growth is driven by massive infrastructure refurbishment initiatives and rising investments in smart water management systems.

  • Extensive infrastructure upgrade projects are underway across states.
  • Growing adoption of IoT-enabled tapping sleeves in municipal water systems.
  • Leading companies such as Mueller Water Products dominate the market.
  • Strict EPA regulations drive compliance-focused product innovation.

Tapping Sleeves Sales Analysis in the UK

The tapping sleeves revenue in the UK is projected to grow at a CAGR of 4.4% from 2025 to 2035. Growth is supported by rising investments in intelligent water management, leak prevention technologies, and regulatory focus on carbon emission reduction.

  • Increasing upgrades of outdated urban water pipeline networks.
  • High adoption of smart monitoring and leak detection systems.
  • Collaborative projects between manufacturers and government agencies.
  • Sustainability goals fuel demand for low-carbon steel sleeves.

Tapping Sleeves Demand Analysis in Germany

Germany’s tapping sleeve demand is projected to grow at a CAGR of 4.3% from 2025 to 2035.

  • High focus on corrosion-resistant materials for pipeline longevity.
  • Strong demand from energy and chemical industries for durable sleeves.
  • Adoption of DVGW-certified products to meet compliance standards.
  • Increasing investments in hydrogen pipeline networks fuel market growth.

Tapping Sleeves Demand Analysis in France

France’s tapping sleeves revenues are projected to grow at a CAGR of 4.3% from 2025 to 2035. Growth is driven by tough EU water conservation regulations and investments in sustainable pipeline infrastructure.

  • ACS certification requirements drive high-quality product manufacturing.
  • Rising investments in green hydrogen pipeline infrastructure.
  • Public-private partnerships accelerate pipeline rehabilitation projects.
  • Focus on lead-free, corrosion-resistant materials aligns with EU policies.

Japan Tapping Sleeves Market Analysis

Sales of tapping sleeves in Japan are projected to grow at a CAGR of 4.2% from 2025 to 2035. Growth is driven by efforts to modernize infrastructure, enhance disaster resistance, and upgrade aging water distribution systems.

  • High demand for earthquake-resistant pipeline solutions.
  • Gas distribution networks are driving consistent market demand.
  • Preference for compact, rapid-install tapping sleeves in urban areas.
  • Traditional reliance on manual inspections limits smart tech adoption.

Leading Tapping Sleeve Manufacturers and Suppliers

The market is moderately consolidated, with dominant tier-one players such as Mueller Water Products, Smith-Blair, Inc., and The Ford Meter Box Company, Inc. These leading companies maintain their market position through continuous product innovation, strategic acquisitions, and expansion of smart-enabled tapping sleeve portfolios.

Mueller Water Products leads with its strong municipal water system offerings, while Smith-Blair focuses on corrosion-resistant and IoT-integrated solutions to cater to the rising demand for smart water infrastructure. Their strategies include investing in R&D for advanced materials, entering strategic partnerships with EPC companies and distributors to strengthen market reach, and launching products that comply with evolving regulatory standards for pipeline safety and water conservation.

Recent Tapping Sleeves Industry News

  • In January 2025, American Cast Iron Pipe Company announced the acquisition of C&B Piping, Inc., a manufacturing leader to boost its product portfolio.
  • In April 2024, Everett J. Prescott, Inc. (Team EJP) expanded its exclusive partnership with Kamstrup to include 13 USA states, making Team EJP Kamstrup’s largest distributor in those regions.

Tapping Sleeves Market Report Scope

Report Attributes Details
Current Total Market Size (2025) USD 2.8 billion
Projected Market Size (2035) USD 4.3 billion
CAGR (2025 to 2035) 4.5%
Base Year for Estimation 2024
Historical Period 2020 to 2024
Projections Period 2025 to 2035
Market Analysis Parameters Revenue in USD billion/Volume in units
By Material Steel (Fabricated Carbon, Stainless), Ductile Iron, and Cast Iron
By Inches 1-10, 11-20, 21-30, 31-40, and Above 40
By Fluid Motion Liquid, Gas, and Oil
By Application Drinking Water, Waste Water System, Gas Solution, and Petroleum
Regions Covered North America, Latin America, Western Europe, Eastern Europe, East Asia, South Asia & Pacific, Middle East & Africa
Countries Covered United States, Canada, United Kingdom, Germany, France, China, Japan, South Korea, Brazil, Australia
Key Players AMERICAN (American Cast Iron Pipe Company), Everett J. Prescott, Inc., JCM Industries Inc., Mueller Water Products (Market leader), Petersen Products Co., Power Seal Corporation, Robar Industries Ltd., Romac Industries, Inc., The Ford Meter Box Company, Inc., UTS Engineering, Seipasa , Smith-Blair, Inc., JM Eagle, McWane , Inc., Kupferle Foundry
Additional Attributes Dollar sales by value, market share by country and region, competitive landscape

Key Segmentation

By Material:

Steel(Fabricated Carbon, Stainless), Ductile Iron, Cast Iron

By Inches:

1-10, 11-20, 21-30, 31-40, Above 40

By Fluid Motion:

Liquid, Gas, Oil

By Application:

Drinking Water, Waste Water System, Gas Solution, Petroleum

By Region:

North America, Latin America, Western Europe, Eastern Europe, Central Asia, Russia & Belarus, Balkan & Baltic Countries, East and Africa (MEA), East Asia, South Asia and Pacific

Table of Content

  1. Executive Summary
    • Global Market Outlook
    • Demand-side Trends
    • Supply-side Trends
    • Technology Roadmap Analysis
    • Analysis and Recommendations
  2. Market Overview
    • Market Coverage / Taxonomy
    • Market Definition / Scope / Limitations
  3. Market Background
    • Market Dynamics
      • Drivers
      • Restraints
      • Opportunity
      • Trends
    • Scenario Forecast
      • Demand in Optimistic Scenario
      • Demand in Likely Scenario
      • Demand in Conservative Scenario
    • Opportunity Map Analysis
    • Product Life Cycle Analysis
    • Supply Chain Analysis
      • Supply Side Participants and their Roles
        • Producers
        • Mid-Level Participants (Traders/ Agents/ Brokers)
        • Wholesalers and Distributors
      • Value Added and Value Created at Node in the Supply Chain
      • List of Raw Material Suppliers
      • List of Existing and Potential Buyer’s
    • Investment Feasibility Matrix
    • Value Chain Analysis
      • Profit Margin Analysis
      • Wholesalers and Distributors
      • Retailers
    • PESTLE and Porter’s Analysis
    • Regulatory Landscape
      • By Key Regions
      • By Key Countries
    • Regional Parent Market Outlook
    • Production and Consumption Statistics
    • Import and Export Statistics
  4. Global Market Analysis 2020 to 2024 and Forecast, 2025 to 2035
    • Historical Market Size Value (USD Billion) & Volume (Units) Analysis, 2020 to 2024
    • Current and Future Market Size Value (USD Billion) & Volume (Units) Projections, 2025 to 2035
      • Y-o-Y Growth Trend Analysis
      • Absolute $ Opportunity Analysis
  5. Global Market Pricing Analysis 2020 to 2024 and Forecast 2025 to 2035
  6. Global Market Analysis 2020 to 2024 and Forecast 2025 to 2035, By Material
    • Introduction / Key Findings
    • Historical Market Size Value (USD Billion) & Volume (Units) Analysis By Material, 2020 to 2024
    • Current and Future Market Size Value (USD Billion) & Volume (Units) Analysis and Forecast By Material, 2025 to 2035
      • Steel
        • Fabricated Carbon
        • Stainless
      • Ductile Iron
      • Cast Iron
    • Y-o-Y Growth Trend Analysis By Material, 2020 to 2024
    • Absolute $ Opportunity Analysis By Material, 2025 to 2035
  7. Global Market Analysis 2020 to 2024 and Forecast 2025 to 2035, By Inches
    • Introduction / Key Findings
    • Historical Market Size Value (USD Billion) & Volume (Units) Analysis By Inches, 2020 to 2024
    • Current and Future Market Size Value (USD Billion) & Volume (Units) Analysis and Forecast By Inches, 2025 to 2035
      • 1 to 10
      • 11 to 20
      • 21 to 30
      • 31 to 40
      • Above 40
    • Y-o-Y Growth Trend Analysis By Inches, 2020 to 2024
    • Absolute $ Opportunity Analysis By Inches, 2025 to 2035
  8. Global Market Analysis 2020 to 2024 and Forecast 2025 to 2035, By Fluid Motion
    • Introduction / Key Findings
    • Historical Market Size Value (USD Billion) & Volume (Units) Analysis By Fluid Motion, 2020 to 2024
    • Current and Future Market Size Value (USD Billion) & Volume (Units) Analysis and Forecast By Fluid Motion, 2025 to 2035
      • Liquid
      • Gas
      • Oil
    • Y-o-Y Growth Trend Analysis By Fluid Motion, 2020 to 2024
    • Absolute $ Opportunity Analysis By Fluid Motion, 2025 to 2035
  9. Global Market Analysis 2020 to 2024 and Forecast 2025 to 2035, By Application
    • Introduction / Key Findings
    • Historical Market Size Value (USD Billion) & Volume (Units) Analysis By Application, 2020 to 2024
    • Current and Future Market Size Value (USD Billion) & Volume (Units) Analysis and Forecast By Application, 2025 to 2035
      • Drinking Water
      • Waste Water System
      • Gas Solution
      • Petroleum
    • Y-o-Y Growth Trend Analysis By Application, 2020 to 2024
    • Absolute $ Opportunity Analysis By Application, 2025 to 2035
  10. Global Market Analysis 2020 to 2024 and Forecast 2025 to 2035, By Region
    • Introduction
    • Historical Market Size Value (USD Billion) & Volume (Units) Analysis By Region, 2020 to 2024
    • Current Market Size Value (USD Billion) & Volume (Units) Analysis and Forecast By Region, 2025 to 2035
      • USA
      • Latin America
      • Western Europe
      • Eastern Europe
      • East Asia
      • South Asia & Pacific
      • Middle East and Africa
    • Market Attractiveness Analysis By Region
  11. USA Market Analysis 2020 to 2024 and Forecast 2025 to 2035, By Country
    • Historical Market Size Value (USD Billion) & Volume (Units) Trend Analysis By Market Taxonomy, 2020 to 2024
    • Market Size Value (USD Billion) & Volume (Units) Forecast By Market Taxonomy, 2025 to 2035
      • By Country
        • Canada
        • Brazil
        • Mexico
        • Argentina
      • By Material
      • By Inches
      • By Fluid Motion
      • By Application
    • Market Attractiveness Analysis
      • By Country
      • By Material
      • By Inches
      • By Fluid Motion
      • By Application
    • Key Takeaways
  12. Latin America Market Analysis 2020 to 2024 and Forecast 2025 to 2035, By Country
    • Historical Market Size Value (USD Billion) & Volume (Units) Trend Analysis By Market Taxonomy, 2020 to 2024
    • Market Size Value (USD Billion) & Volume (Units) Forecast By Market Taxonomy, 2025 to 2035
      • By Country
        • Brazil
        • Argentina
        • Rest of LATAM
      • By Material
      • By Inches
      • By Fluid Motion
      • By Application
    • Market Attractiveness Analysis
      • By Country
      • By Material
      • By Inches
      • By Fluid Motion
      • By Application
    • Key Takeaways
  13. Western Europe Market Analysis 2020 to 2024 and Forecast 2025 to 2035, By Country
    • Historical Market Size Value (USD Billion) & Volume (Units) Trend Analysis By Market Taxonomy, 2020 to 2024
    • Market Size Value (USD Billion) & Volume (Units) Forecast By Market Taxonomy, 2025 to 2035
      • By Country
        • Germany
        • Italy
        • France
        • UK
        • Spain
        • BENELUX
        • Nordic
        • Rest of W.Europe
      • By Material
      • By Inches
      • By Fluid Motion
      • By Application
    • Market Attractiveness Analysis
      • By Country
      • By Material
      • By Inches
      • By Fluid Motion
      • By Application
    • Key Takeaways
  14. Eastern Europe Market Analysis 2020 to 2024 and Forecast 2025 to 2035, By Country
    • Historical Market Size Value (USD Billion) & Volume (Units) Trend Analysis By Market Taxonomy, 2020 to 2024
    • Market Size Value (USD Billion) & Volume (Units) Forecast By Market Taxonomy, 2025 to 2035
      • By Country
        • Russia
        • Hungary
        • Poland
        • Balkan & Baltics
        • Rest of E. Europe
      • By Material
      • By Inches
      • By Fluid Motion
      • By Application
    • Market Attractiveness Analysis
      • By Country
      • By Material
      • By Inches
      • By Fluid Motion
      • By Application
    • Key Takeaways
  15. East Asia Market Analysis 2020 to 2024 and Forecast 2025 to 2035, By Country
    • Historical Market Size Value (USD Billion) & Volume (Units) Trend Analysis By Market Taxonomy, 2020 to 2024
    • Market Size Value (USD Billion) & Volume (Units) Forecast By Market Taxonomy, 2025 to 2035
      • By Country
        • China
        • Japan
        • South Korea
      • By Material
      • By Inches
      • By Fluid Motion
      • By Application
    • Market Attractiveness Analysis
      • By Country
      • By Material
      • By Inches
      • By Fluid Motion
      • By Application
    • Key Takeaways
  16. South Asia & Pacific Market Analysis 2020 to 2024 and Forecast 2025 to 2035, By Country
    • Historical Market Size Value (USD Billion) & Volume (Units) Trend Analysis By Market Taxonomy, 2020 to 2024
    • Market Size Value (USD Billion) & Volume (Units) Forecast By Market Taxonomy, 2025 to 2035
      • By Country
        • India
        • Australia & New Zealand
        • ASEAN
        • Rest of SAP
      • By Material
      • By Inches
      • By Fluid Motion
      • By Application
    • Market Attractiveness Analysis
      • By Country
      • By Material
      • By Inches
      • By Fluid Motion
      • By Application
    • Key Takeaways
  17. Middle East and Africa Market Analysis 2020 to 2024 and Forecast 2025 to 2035, By Country
    • Historical Market Size Value (USD Billion) & Volume (Units) Trend Analysis By Market Taxonomy, 2020 to 2024
    • Market Size Value (USD Billion) & Volume (Units) Forecast By Market Taxonomy, 2025 to 2035
      • By Country
        • GCC Countries
        • Northern Africa
        • South Africa
        • Turkiye
        • Rest of MEA
      • By Material
      • By Inches
      • By Fluid Motion
      • By Application
    • Market Attractiveness Analysis
      • By Country
      • By Material
      • By Inches
      • By Fluid Motion
      • By Application
    • Key Takeaways
  18. Key Countries Market Analysis
    • USA
      • Pricing Analysis
      • Market Share Analysis, 2024
        • By Material
        • By Inches
        • By Fluid Motion
        • By Application
    • Canada
      • Pricing Analysis
      • Market Share Analysis, 2024
        • By Material
        • By Inches
        • By Fluid Motion
        • By Application
    • Brazil
      • Pricing Analysis
      • Market Share Analysis, 2024
        • By Material
        • By Inches
        • By Fluid Motion
        • By Application
    • Mexico
      • Pricing Analysis
      • Market Share Analysis, 2024
        • By Material
        • By Inches
        • By Fluid Motion
        • By Application
    • Argentina
      • Pricing Analysis
      • Market Share Analysis, 2024
        • By Material
        • By Inches
        • By Fluid Motion
        • By Application
  19. Market Structure Analysis
    • Competition Dashboard
    • Competition Benchmarking
    • Market Share Analysis of Top Players
      • By Regional
      • By Material
      • By Inches
      • By Fluid Motion
      • By Application
  20. Competition Analysis
    • Competition Deep Dive
      • AMERICAN (American Cast Iron Pipe Company)
        • Overview
        • Product Portfolio
        • Profitability by Market Segments (Product/Age /Sales Channel/Region)
        • Sales Footprint
        • Strategy Overview
          • Marketing Strategy
          • Product Strategy
          • Channel Strategy
      • Everett J. Prescott, Inc.
        • Overview
        • Product Portfolio
        • Profitability by Market Segments (Product/Age /Sales Channel/Region)
        • Sales Footprint
        • Strategy Overview
          • Marketing Strategy
          • Product Strategy
          • Channel Strategy
      • JCM Industries Inc.
        • Overview
        • Product Portfolio
        • Profitability by Market Segments (Product/Age /Sales Channel/Region)
        • Sales Footprint
        • Strategy Overview
          • Marketing Strategy
          • Product Strategy
          • Channel Strategy
      • Mueller Water Products (Market leader)
        • Overview
        • Product Portfolio
        • Profitability by Market Segments (Product/Age /Sales Channel/Region)
        • Sales Footprint
        • Strategy Overview
          • Marketing Strategy
          • Product Strategy
          • Channel Strategy
      • Petersen Products Co.
        • Overview
        • Product Portfolio
        • Profitability by Market Segments (Product/Age /Sales Channel/Region)
        • Sales Footprint
        • Strategy Overview
          • Marketing Strategy
          • Product Strategy
          • Channel Strategy
      • Power Seal Corporation
        • Overview
        • Product Portfolio
        • Profitability by Market Segments (Product/Age /Sales Channel/Region)
        • Sales Footprint
        • Strategy Overview
          • Marketing Strategy
          • Product Strategy
          • Channel Strategy
      • Robar Industries Ltd.
        • Overview
        • Product Portfolio
        • Profitability by Market Segments (Product/Age /Sales Channel/Region)
        • Sales Footprint
        • Strategy Overview
          • Marketing Strategy
          • Product Strategy
          • Channel Strategy
      • Romac Industries, Inc.
        • Overview
        • Product Portfolio
        • Profitability by Market Segments (Product/Age /Sales Channel/Region)
        • Sales Footprint
        • Strategy Overview
          • Marketing Strategy
          • Product Strategy
          • Channel Strategy
      • The Ford Meter Box Company, Inc.
        • Overview
        • Product Portfolio
        • Profitability by Market Segments (Product/Age /Sales Channel/Region)
        • Sales Footprint
        • Strategy Overview
          • Marketing Strategy
          • Product Strategy
          • Channel Strategy
      • UTS Engineering
        • Overview
        • Product Portfolio
        • Profitability by Market Segments (Product/Age /Sales Channel/Region)
        • Sales Footprint
        • Strategy Overview
          • Marketing Strategy
          • Product Strategy
          • Channel Strategy
      • Seipasa
        • Overview
        • Product Portfolio
        • Profitability by Market Segments (Product/Age /Sales Channel/Region)
        • Sales Footprint
        • Strategy Overview
          • Marketing Strategy
          • Product Strategy
          • Channel Strategy
      • Smith-Blair, Inc. (Top 3 player)
        • Overview
        • Product Portfolio
        • Profitability by Market Segments (Product/Age /Sales Channel/Region)
        • Sales Footprint
        • Strategy Overview
          • Marketing Strategy
          • Product Strategy
          • Channel Strategy
      • JM Eagle
        • Overview
        • Product Portfolio
        • Profitability by Market Segments (Product/Age /Sales Channel/Region)
        • Sales Footprint
        • Strategy Overview
          • Marketing Strategy
          • Product Strategy
          • Channel Strategy
      • McWane, Inc.
        • Overview
        • Product Portfolio
        • Profitability by Market Segments (Product/Age /Sales Channel/Region)
        • Sales Footprint
        • Strategy Overview
          • Marketing Strategy
          • Product Strategy
          • Channel Strategy
      • Kupferle Foundry
        • Overview
        • Product Portfolio
        • Profitability by Market Segments (Product/Age /Sales Channel/Region)
        • Sales Footprint
        • Strategy Overview
          • Marketing Strategy
          • Product Strategy
          • Channel Strategy
  21. Assumptions & Acronyms Used
  22. Research Methodology

List of Tables

  • Table 1: Global Market Value (USD Billion) Forecast by Region, 2020-2035
  • Table 2: Global Market Volume (Units) Forecast by Region, 2020-2035
  • Table 3: Global Market Value (USD Billion) Forecast by Material, 2020-2035
  • Table 4: Global Market Volume (Units) Forecast by Material, 2020-2035
  • Table 5: Global Market Value (USD Billion) Forecast by Inches, 2020-2035
  • Table 6: Global Market Volume (Units) Forecast by Inches, 2020-2035
  • Table 7: Global Market Value (USD Billion) Forecast by Fluid Motion, 2020-2035
  • Table 8: Global Market Volume (Units) Forecast by Fluid Motion, 2020-2035
  • Table 9: Global Market Value (USD Billion) Forecast by Application, 2020-2035
  • Table 10: Global Market Volume (Units) Forecast by Application, 2020-2035
  • Table 11: USA Market Value (USD Billion) Forecast by Country, 2020-2035
  • Table 12: USA Market Volume (Units) Forecast by Country, 2020-2035
  • Table 13: USA Market Value (USD Billion) Forecast by Material, 2020-2035
  • Table 14: USA Market Volume (Units) Forecast by Material, 2020-2035
  • Table 15: USA Market Value (USD Billion) Forecast by Inches, 2020-2035
  • Table 16: USA Market Volume (Units) Forecast by Inches, 2020-2035
  • Table 17: USA Market Value (USD Billion) Forecast by Fluid Motion, 2020-2035
  • Table 18: USA Market Volume (Units) Forecast by Fluid Motion, 2020-2035
  • Table 19: USA Market Value (USD Billion) Forecast by Application, 2020-2035
  • Table 20: USA Market Volume (Units) Forecast by Application, 2020-2035
  • Table 21: Latin America Market Value (USD Billion) Forecast by Country, 2020-2035
  • Table 22: Latin America Market Volume (Units) Forecast by Country, 2020-2035
  • Table 23: Latin America Market Value (USD Billion) Forecast by Material, 2020-2035
  • Table 24: Latin America Market Volume (Units) Forecast by Material, 2020-2035
  • Table 25: Latin America Market Value (USD Billion) Forecast by Inches, 2020-2035
  • Table 26: Latin America Market Volume (Units) Forecast by Inches, 2020-2035
  • Table 27: Latin America Market Value (USD Billion) Forecast by Fluid Motion, 2020-2035
  • Table 28: Latin America Market Volume (Units) Forecast by Fluid Motion, 2020-2035
  • Table 29: Latin America Market Value (USD Billion) Forecast by Application, 2020-2035
  • Table 30: Latin America Market Volume (Units) Forecast by Application, 2020-2035
  • Table 31: Western Europe Market Value (USD Billion) Forecast by Country, 2020-2035
  • Table 32: Western Europe Market Volume (Units) Forecast by Country, 2020-2035
  • Table 33: Western Europe Market Value (USD Billion) Forecast by Material, 2020-2035
  • Table 34: Western Europe Market Volume (Units) Forecast by Material, 2020-2035
  • Table 35: Western Europe Market Value (USD Billion) Forecast by Inches, 2020-2035
  • Table 36: Western Europe Market Volume (Units) Forecast by Inches, 2020-2035
  • Table 37: Western Europe Market Value (USD Billion) Forecast by Fluid Motion, 2020-2035
  • Table 38: Western Europe Market Volume (Units) Forecast by Fluid Motion, 2020-2035
  • Table 39: Western Europe Market Value (USD Billion) Forecast by Application, 2020-2035
  • Table 40: Western Europe Market Volume (Units) Forecast by Application, 2020-2035
  • Table 41: Eastern Europe Market Value (USD Billion) Forecast by Country, 2020-2035
  • Table 42: Eastern Europe Market Volume (Units) Forecast by Country, 2020-2035
  • Table 43: Eastern Europe Market Value (USD Billion) Forecast by Material, 2020-2035
  • Table 44: Eastern Europe Market Volume (Units) Forecast by Material, 2020-2035
  • Table 45: Eastern Europe Market Value (USD Billion) Forecast by Inches, 2020-2035
  • Table 46: Eastern Europe Market Volume (Units) Forecast by Inches, 2020-2035
  • Table 47: Eastern Europe Market Value (USD Billion) Forecast by Fluid Motion, 2020-2035
  • Table 48: Eastern Europe Market Volume (Units) Forecast by Fluid Motion, 2020-2035
  • Table 49: Eastern Europe Market Value (USD Billion) Forecast by Application, 2020-2035
  • Table 50: Eastern Europe Market Volume (Units) Forecast by Application, 2020-2035
  • Table 51: East Asia Market Value (USD Billion) Forecast by Country, 2020-2035
  • Table 52: East Asia Market Volume (Units) Forecast by Country, 2020-2035
  • Table 53: East Asia Market Value (USD Billion) Forecast by Material, 2020-2035
  • Table 54: East Asia Market Volume (Units) Forecast by Material, 2020-2035
  • Table 55: East Asia Market Value (USD Billion) Forecast by Inches, 2020-2035
  • Table 56: East Asia Market Volume (Units) Forecast by Inches, 2020-2035
  • Table 57: East Asia Market Value (USD Billion) Forecast by Fluid Motion, 2020-2035
  • Table 58: East Asia Market Volume (Units) Forecast by Fluid Motion, 2020-2035
  • Table 59: East Asia Market Value (USD Billion) Forecast by Application, 2020-2035
  • Table 60: East Asia Market Volume (Units) Forecast by Application, 2020-2035
  • Table 61: South Asia & Pacific Market Value (USD Billion) Forecast by Country, 2020-2035
  • Table 62: South Asia & Pacific Market Volume (Units) Forecast by Country, 2020-2035
  • Table 63: South Asia & Pacific Market Value (USD Billion) Forecast by Material, 2020-2035
  • Table 64: South Asia & Pacific Market Volume (Units) Forecast by Material, 2020-2035
  • Table 65: South Asia & Pacific Market Value (USD Billion) Forecast by Inches, 2020-2035
  • Table 66: South Asia & Pacific Market Volume (Units) Forecast by Inches, 2020-2035
  • Table 67: South Asia & Pacific Market Value (USD Billion) Forecast by Fluid Motion, 2020-2035
  • Table 68: South Asia & Pacific Market Volume (Units) Forecast by Fluid Motion, 2020-2035
  • Table 69: South Asia & Pacific Market Value (USD Billion) Forecast by Application, 2020-2035
  • Table 70: South Asia & Pacific Market Volume (Units) Forecast by Application, 2020-2035
  • Table 71: Middle East and Africa Market Value (USD Billion) Forecast by Country, 2020-2035
  • Table 72: Middle East and Africa Market Volume (Units) Forecast by Country, 2020-2035
  • Table 73: Middle East and Africa Market Value (USD Billion) Forecast by Material, 2020-2035
  • Table 74: Middle East and Africa Market Volume (Units) Forecast by Material, 2020-2035
  • Table 75: Middle East and Africa Market Value (USD Billion) Forecast by Inches, 2020-2035
  • Table 76: Middle East and Africa Market Volume (Units) Forecast by Inches, 2020-2035
  • Table 77: Middle East and Africa Market Value (USD Billion) Forecast by Fluid Motion, 2020-2035
  • Table 78: Middle East and Africa Market Volume (Units) Forecast by Fluid Motion, 2020-2035
  • Table 79: Middle East and Africa Market Value (USD Billion) Forecast by Application, 2020-2035
  • Table 80: Middle East and Africa Market Volume (Units) Forecast by Application, 2020-2035

List of Figures

  • Figure 1: Global Market Volume (Units) Forecast 2020-2035
  • Figure 2: Global Market Pricing Analysis
  • Figure 3: Global Market Value (USD Billion) Forecast 2020-2035
  • Figure 4: Global Market Value Share and BPS Analysis by Material, 2025 and 2035
  • Figure 5: Global Market Y-o-Y Growth Comparison by Material, 2025-2035
  • Figure 6: Global Market Attractiveness Analysis by Material
  • Figure 7: Global Market Value Share and BPS Analysis by Inches, 2025 and 2035
  • Figure 8: Global Market Y-o-Y Growth Comparison by Inches, 2025-2035
  • Figure 9: Global Market Attractiveness Analysis by Inches
  • Figure 10: Global Market Value Share and BPS Analysis by Fluid Motion, 2025 and 2035
  • Figure 11: Global Market Y-o-Y Growth Comparison by Fluid Motion, 2025-2035
  • Figure 12: Global Market Attractiveness Analysis by Fluid Motion
  • Figure 13: Global Market Value Share and BPS Analysis by Application, 2025 and 2035
  • Figure 14: Global Market Y-o-Y Growth Comparison by Application, 2025-2035
  • Figure 15: Global Market Attractiveness Analysis by Application
  • Figure 16: Global Market Value (USD Billion) Share and BPS Analysis by Region, 2025 and 2035
  • Figure 17: Global Market Y-o-Y Growth Comparison by Region, 2025-2035
  • Figure 18: Global Market Attractiveness Analysis by Region
  • Figure 19: USA Market Incremental $ Opportunity, 2025-2035
  • Figure 20: Latin America Market Incremental $ Opportunity, 2025-2035
  • Figure 21: Western Europe Market Incremental $ Opportunity, 2025-2035
  • Figure 22: Eastern Europe Market Incremental $ Opportunity, 2025-2035
  • Figure 23: East Asia Market Incremental $ Opportunity, 2025-2035
  • Figure 24: South Asia & Pacific Market Incremental $ Opportunity, 2025-2035
  • Figure 25: Middle East and Africa Market Incremental $ Opportunity, 2025-2035
  • Figure 26: USA Market Value Share and BPS Analysis by Country, 2025 and 2035
  • Figure 27: USA Market Value Share and BPS Analysis by Material, 2025 and 2035
  • Figure 28: USA Market Y-o-Y Growth Comparison by Material, 2025-2035
  • Figure 29: USA Market Attractiveness Analysis by Material
  • Figure 30: USA Market Value Share and BPS Analysis by Inches, 2025 and 2035
  • Figure 31: USA Market Y-o-Y Growth Comparison by Inches, 2025-2035
  • Figure 32: USA Market Attractiveness Analysis by Inches
  • Figure 33: USA Market Value Share and BPS Analysis by Fluid Motion, 2025 and 2035
  • Figure 34: USA Market Y-o-Y Growth Comparison by Fluid Motion, 2025-2035
  • Figure 35: USA Market Attractiveness Analysis by Fluid Motion
  • Figure 36: USA Market Value Share and BPS Analysis by Application, 2025 and 2035
  • Figure 37: USA Market Y-o-Y Growth Comparison by Application, 2025-2035
  • Figure 38: USA Market Attractiveness Analysis by Application
  • Figure 39: Latin America Market Value Share and BPS Analysis by Country, 2025 and 2035
  • Figure 40: Latin America Market Value Share and BPS Analysis by Material, 2025 and 2035
  • Figure 41: Latin America Market Y-o-Y Growth Comparison by Material, 2025-2035
  • Figure 42: Latin America Market Attractiveness Analysis by Material
  • Figure 43: Latin America Market Value Share and BPS Analysis by Inches, 2025 and 2035
  • Figure 44: Latin America Market Y-o-Y Growth Comparison by Inches, 2025-2035
  • Figure 45: Latin America Market Attractiveness Analysis by Inches
  • Figure 46: Latin America Market Value Share and BPS Analysis by Fluid Motion, 2025 and 2035
  • Figure 47: Latin America Market Y-o-Y Growth Comparison by Fluid Motion, 2025-2035
  • Figure 48: Latin America Market Attractiveness Analysis by Fluid Motion
  • Figure 49: Latin America Market Value Share and BPS Analysis by Application, 2025 and 2035
  • Figure 50: Latin America Market Y-o-Y Growth Comparison by Application, 2025-2035
  • Figure 51: Latin America Market Attractiveness Analysis by Application
  • Figure 52: Western Europe Market Value Share and BPS Analysis by Country, 2025 and 2035
  • Figure 53: Western Europe Market Value Share and BPS Analysis by Material, 2025 and 2035
  • Figure 54: Western Europe Market Y-o-Y Growth Comparison by Material, 2025-2035
  • Figure 55: Western Europe Market Attractiveness Analysis by Material
  • Figure 56: Western Europe Market Value Share and BPS Analysis by Inches, 2025 and 2035
  • Figure 57: Western Europe Market Y-o-Y Growth Comparison by Inches, 2025-2035
  • Figure 58: Western Europe Market Attractiveness Analysis by Inches
  • Figure 59: Western Europe Market Value Share and BPS Analysis by Fluid Motion, 2025 and 2035
  • Figure 60: Western Europe Market Y-o-Y Growth Comparison by Fluid Motion, 2025-2035
  • Figure 61: Western Europe Market Attractiveness Analysis by Fluid Motion
  • Figure 62: Western Europe Market Value Share and BPS Analysis by Application, 2025 and 2035
  • Figure 63: Western Europe Market Y-o-Y Growth Comparison by Application, 2025-2035
  • Figure 64: Western Europe Market Attractiveness Analysis by Application
  • Figure 65: Eastern Europe Market Value Share and BPS Analysis by Country, 2025 and 2035
  • Figure 66: Eastern Europe Market Value Share and BPS Analysis by Material, 2025 and 2035
  • Figure 67: Eastern Europe Market Y-o-Y Growth Comparison by Material, 2025-2035
  • Figure 68: Eastern Europe Market Attractiveness Analysis by Material
  • Figure 69: Eastern Europe Market Value Share and BPS Analysis by Inches, 2025 and 2035
  • Figure 70: Eastern Europe Market Y-o-Y Growth Comparison by Inches, 2025-2035
  • Figure 71: Eastern Europe Market Attractiveness Analysis by Inches
  • Figure 72: Eastern Europe Market Value Share and BPS Analysis by Fluid Motion, 2025 and 2035
  • Figure 73: Eastern Europe Market Y-o-Y Growth Comparison by Fluid Motion, 2025-2035
  • Figure 74: Eastern Europe Market Attractiveness Analysis by Fluid Motion
  • Figure 75: Eastern Europe Market Value Share and BPS Analysis by Application, 2025 and 2035
  • Figure 76: Eastern Europe Market Y-o-Y Growth Comparison by Application, 2025-2035
  • Figure 77: Eastern Europe Market Attractiveness Analysis by Application
  • Figure 78: East Asia Market Value Share and BPS Analysis by Country, 2025 and 2035
  • Figure 79: East Asia Market Value Share and BPS Analysis by Material, 2025 and 2035
  • Figure 80: East Asia Market Y-o-Y Growth Comparison by Material, 2025-2035
  • Figure 81: East Asia Market Attractiveness Analysis by Material
  • Figure 82: East Asia Market Value Share and BPS Analysis by Inches, 2025 and 2035
  • Figure 83: East Asia Market Y-o-Y Growth Comparison by Inches, 2025-2035
  • Figure 84: East Asia Market Attractiveness Analysis by Inches
  • Figure 85: East Asia Market Value Share and BPS Analysis by Fluid Motion, 2025 and 2035
  • Figure 86: East Asia Market Y-o-Y Growth Comparison by Fluid Motion, 2025-2035
  • Figure 87: East Asia Market Attractiveness Analysis by Fluid Motion
  • Figure 88: East Asia Market Value Share and BPS Analysis by Application, 2025 and 2035
  • Figure 89: East Asia Market Y-o-Y Growth Comparison by Application, 2025-2035
  • Figure 90: East Asia Market Attractiveness Analysis by Application
  • Figure 91: South Asia & Pacific Market Value Share and BPS Analysis by Country, 2025 and 2035
  • Figure 92: South Asia & Pacific Market Value Share and BPS Analysis by Material, 2025 and 2035
  • Figure 93: South Asia & Pacific Market Y-o-Y Growth Comparison by Material, 2025-2035
  • Figure 94: South Asia & Pacific Market Attractiveness Analysis by Material
  • Figure 95: South Asia & Pacific Market Value Share and BPS Analysis by Inches, 2025 and 2035
  • Figure 96: South Asia & Pacific Market Y-o-Y Growth Comparison by Inches, 2025-2035
  • Figure 97: South Asia & Pacific Market Attractiveness Analysis by Inches
  • Figure 98: South Asia & Pacific Market Value Share and BPS Analysis by Fluid Motion, 2025 and 2035
  • Figure 99: South Asia & Pacific Market Y-o-Y Growth Comparison by Fluid Motion, 2025-2035
  • Figure 100: South Asia & Pacific Market Attractiveness Analysis by Fluid Motion
  • Figure 101: South Asia & Pacific Market Value Share and BPS Analysis by Application, 2025 and 2035
  • Figure 102: South Asia & Pacific Market Y-o-Y Growth Comparison by Application, 2025-2035
  • Figure 103: South Asia & Pacific Market Attractiveness Analysis by Application
  • Figure 104: Middle East and Africa Market Value Share and BPS Analysis by Country, 2025 and 2035
  • Figure 105: Middle East and Africa Market Value Share and BPS Analysis by Material, 2025 and 2035
  • Figure 106: Middle East and Africa Market Y-o-Y Growth Comparison by Material, 2025-2035
  • Figure 107: Middle East and Africa Market Attractiveness Analysis by Material
  • Figure 108: Middle East and Africa Market Value Share and BPS Analysis by Inches, 2025 and 2035
  • Figure 109: Middle East and Africa Market Y-o-Y Growth Comparison by Inches, 2025-2035
  • Figure 110: Middle East and Africa Market Attractiveness Analysis by Inches
  • Figure 111: Middle East and Africa Market Value Share and BPS Analysis by Fluid Motion, 2025 and 2035
  • Figure 112: Middle East and Africa Market Y-o-Y Growth Comparison by Fluid Motion, 2025-2035
  • Figure 113: Middle East and Africa Market Attractiveness Analysis by Fluid Motion
  • Figure 114: Middle East and Africa Market Value Share and BPS Analysis by Application, 2025 and 2035
  • Figure 115: Middle East and Africa Market Y-o-Y Growth Comparison by Application, 2025-2035
  • Figure 116: Middle East and Africa Market Attractiveness Analysis by Application
  • Figure 117: Global Market - Tier Structure Analysis
  • Figure 118: Global Market - Company Share Analysis

Frequently Asked Questions

What is the projected size of the tapping sleeves market in 2025?

The market is valued at USD 2.8 billion in 2025.

What will be the tapping sleeves market size by 2035?

The market is expected to reach USD 4.3 billion by 2035.

Which material segment holds the largest share in the tapping sleeves market?

Steel holds the largest market share of 35% in the segment.

What is the CAGR of the global tapping sleeves market from 2025 to 2035?

The global market is projected to grow at a CAGR of 4.5% over the forecast period.

What is the market share of the drinking water application segment in the tapping sleeves market?

The drinking water application segment holds a 40% market share in the market.

Explore Similar Insights

Future Market Insights

Tapping Sleeves Market