

- Market Size (2026)
- USD 2140.6 Mn
- Forecast (2036)
- USD 4578.8 Mn
- CAGR (2026 to 2036)
- 7.9%
How big is the Vacuum Isolation Valve Market?
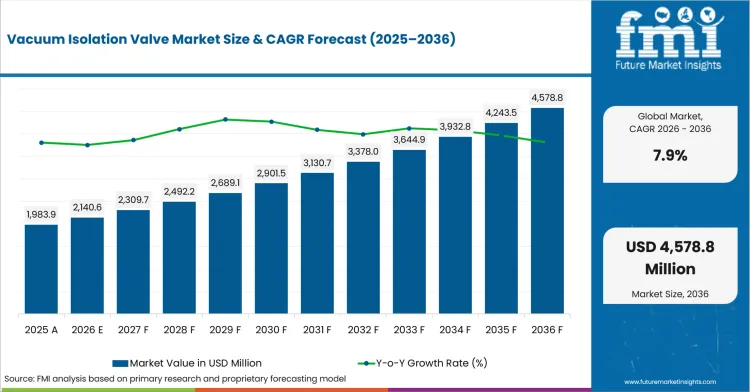
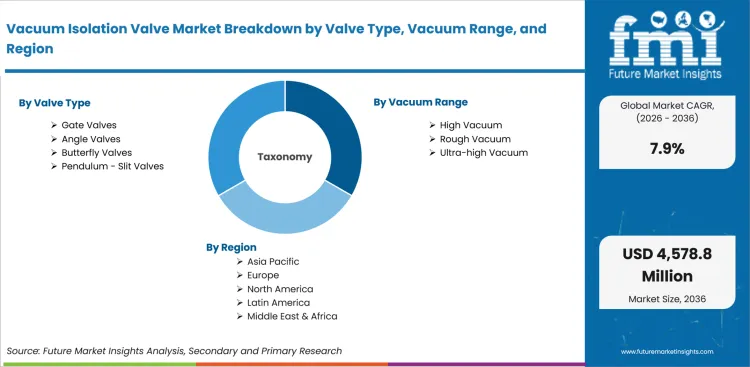
The Vacuum Isolation Valve Market is projected to grow from USD 2140.6 million in 2026 to USD 4578.8 million by 2036, at a CAGR of 7.9%.
The Vacuum Isolation Valve Market was valued at USD 1,983.87 million in 2025 and is expected to reach USD 2140.6 million in 2026. It is forecast to reach USD 4578.8 million by 2036 at a CAGR of 7.9%. Gate Valves are estimated to account for a 35.2% share by valve type in 2026. High Vacuum is expected to represent a 46.5% share by vacuum range in 2026.
In March 2026, VAT Group reported that semiconductor vacuum valve demand stayed tied to wafer fabrication equipment recovery. This reinforces the link between valve sales and fab tool cycles. In June 2024, MKS announced plans for a Super Center factory in Penang, Malaysia. The site supports regional wafer fabrication equipment supply.
The market is expanding as vacuum valves become process-critical parts inside etch, deposition, inspection, and load-lock tools used in semiconductor manufacturing equipment.
| Metric | Value |
|---|---|
| 2025 Market Size | USD 1,983.87 million |
| 2026 Market Size | USD 2,140.6 million |
| 2036 Market Size | USD 4,578.8 million |
| Forecast CAGR (2026-2036) | 7.9% |
| Leading Valve Type | Gate Valves |
| Gate Valves Share (2026) | 35.2% |
| Leading Vacuum Range | High Vacuum |
| High Vacuum Share (2026) | 46.5% |
| Fastest-growing Country | China |
| China CAGR by 2036 | 9.2% |
Summary of the Vacuum Isolation Valve Market
| Market Signal | Commercial Impact |
|---|---|
| Demand and Growth Drivers | Demand for semiconductor vacuum isolation valves is increasing as advanced wafer fabrication requires reliable chamber isolation, stable vacuum performance, and longer equipment uptime.
|
| Product and Segment View | Gate valves, high-vacuum systems, and pneumatic actuation continue to represent the leading commercial opportunities across the market.
|
| Geography and Growth Outlook | Asia continues to drive market expansion through semiconductor manufacturing investments, fab construction, and localization of equipment supply chains.
|
| Competitive Landscape | Competition increasingly focuses on sealing performance, particle control, OEM qualification, lifecycle reliability, and global service capabilities.
|
| Analyst Perspective | Semiconductor vacuum isolation valves are evolving from standard flow-control components into critical process-control technologies that directly influence chamber uptime and manufacturing yield.
- Sudip saha, Principal Consultant at Future Market Insights |
Why is the Vacuum Isolation Valve Market growing?
Front-end wafer processing adds more vacuum steps as etch and deposition tools require chamber isolation with low particle risk. High vacuum tools need stable pressure separation as advanced process windows leave less room for gas leakage or pressure drift.
- Front-end wafer processing adds more vacuum steps as etch and deposition tools require chamber isolation with low particle risk.
- High vacuum tools need stable pressure separation as advanced process windows leave less room for gas leakage or pressure drift.
- Service replacement demand expands when corrosive process byproducts shorten seals, bellows, and actuator component life.
Semiconductor process tools are increasing the number of vacuum interfaces that must open and close without disturbing chamber stability. SEMI reported that global 300mm fab equipment spending is expected to total USD 374 billion from 2026 to 2028, with spending forecast at USD 116 billion in 2026. This scale indicates how many new tools will need qualified valves before they ship. It also shifts supplier attention toward OEM platforms where a valve design can repeat across multiple tool families. Buyers benefit when one valve design reduces tool variation and simplifies maintenance planning. Service demand is rising as fab users focus on tool uptime after installation.
How is the Vacuum Isolation Valve Market segmented?
The Vacuum Isolation Valve Market is segmented by valve type, vacuum range, actuation, end use, sales channel, and region.
- Gate Valves are projected to hold a 35.2% share by valve type in 2026 as large chamber doors need clean shutoff with repeatable sealing.
- With an estimated 46.5% share in 2026, High Vacuum is expected to lead the vacuum range category because wafer tools operate below rough vacuum needs.
- Pneumatic units are anticipated to represent a 52.8% share by actuation in 2026 due to fast cycling and easy cleanroom maintenance.
How does Gate Valves contribute to the valve type category?
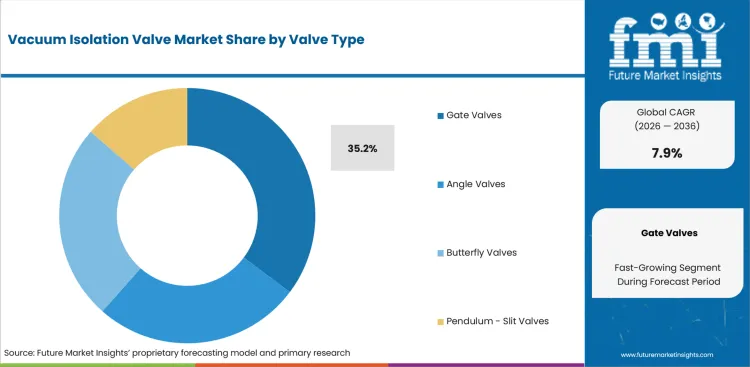
- Gate Valves are projected to account for a 35.2% share in 2026 as fabs need large-port isolation between process chambers and transfer modules.
- VAT describes gate valves as devices that seal ports or openings in high vacuum and ultra-high vacuum systems. This makes them central to chamber isolation.
What supports demand for High Vacuum?
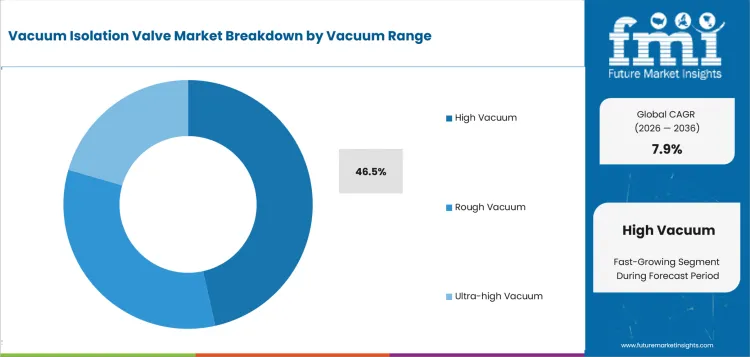
- High Vacuum is estimated to represent a 46.5% share in 2026 as etch and deposition tools require pressure control below rough vacuum levels.
- VAT lists high vacuum pendulum valves for semiconductor and display processes. The fit is notable where downstream tools face particles and process byproducts.
How do buyers evaluate Pneumatic within the actuation category?
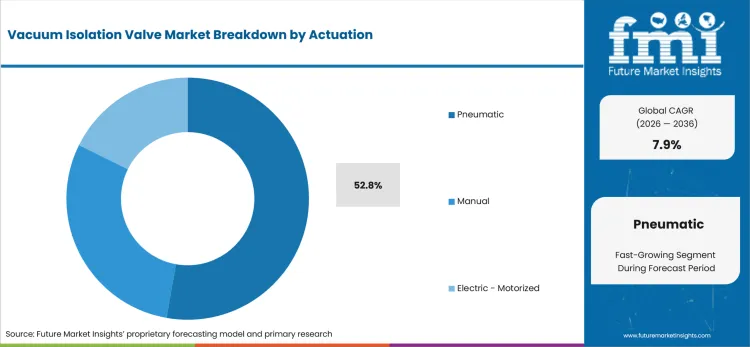
- Pneumatic actuation is anticipated to hold a 52.8% share in 2026 because fast stroke control suits high-cycle chamber isolation.
- Pneumatic units stay common in cleanrooms since service teams understand air-driven actuators and can replace seals without changing tool controls.
What market factors influence demand for Semiconductor?
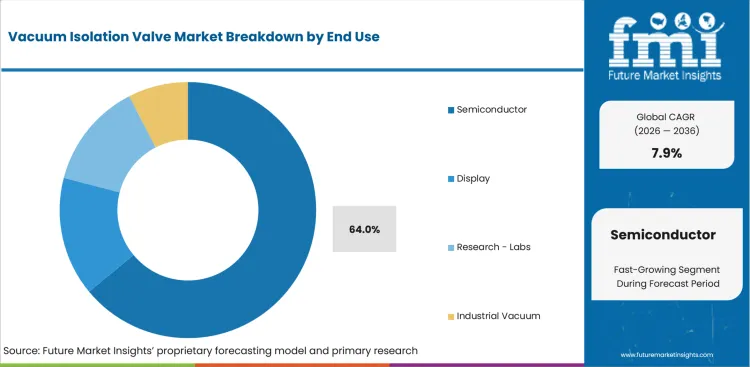
- Semiconductor is expected to account for a 64.0% share in 2026 as wafer tools use isolation valves across load locks and process chambers.
- SEMI reported front-end wafer processing equipment sales rose 12% in 2025. That keeps valve demand tied closely to tool shipments.
How does Direct OEM affect the sales channel outlook?
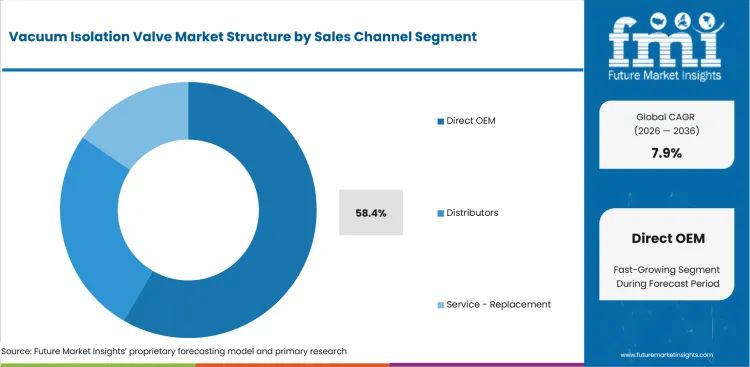
- Direct OEM is projected to represent a 58.4% share in 2026 as tool builders qualify valves before volume equipment shipments begin.
- Replacing an OEM-qualified valve can trigger process checks and maintenance changes. This keeps direct supply stronger than spot distributor buying.
What drives and restrains the market?
Driver: Advanced wafer tools drive demand for cleaner valve motion as particles can affect yield in high-value process chambers; restraint: support-time risk restrains smaller buyers when qualified valve suppliers prioritize large OEM programs and Asian fab customers; opportunity: electric and motorized actuation creates an opportunity where tools need tighter position control and recipe-based pressure behavior.
The market reflects a balance between the identified demand driver, adoption constraints, and the supplier opportunity outlined below.
- Driver: Advanced wafer tools drive demand for cleaner valve motion as particles can affect yield in high-value process chambers.
- Restraint: support-time risk restrains smaller buyers when qualified valve suppliers prioritize large OEM programs and Asian fab customers.
- Opportunity: electric and motorized actuation creates an opportunity where tools need tighter position control and recipe-based pressure behavior.
Chamber Isolation Density Vacuum isolation valves gain demand when tool designs add more controlled spaces inside a fab module. Load locks, transfer paths, and process chambers each need isolation points that protect pressure stability. SEMI reported that logic and micro equipment spending is expected to reach USD 175 billion from 2026 to 2028. This spending pool is important because logic tools use complex vacuum stacks and repeatable chamber cycling. Suppliers win when they provide valves that hold leak performance without adding particle risk.
Qualification Bottlenecks: The main restraint is not product awareness, but qualification time inside process equipment platforms. A valve must match vacuum performance, particle behavior, actuation response, and service access before an OEM can standardize it. VAT states that high-performance vacuum valves must meet precision, durability, and ultra-clean requirements across high vacuum and ultra-high vacuum environments. That requirement raises barriers for smaller suppliers that lack test data or cleanroom manufacturing depth. The opportunity sits with suppliers that shorten validation cycles and support local service after qualification.
Which factors support expansion?
Commercial expansion is reinforced by the value, workflow, and recurring-demand factors below.
- The market value is rising as front-end wafer tools require more chamber isolation steps across etch and deposition flows.
- Vacuum isolation valves gain value when buyers specify cycle life and leak performance before price negotiation starts.
- Replacement demand increases as corrosive gases and film deposits shorten seal life in high-use fab processes.
Which country markets are included in the CAGR comparison?
The selected CAGR comparison covers China (9.2%), South Korea (8.6%), India (8.1%), Japan (7.7%), and United States (7.4%) through 2036.
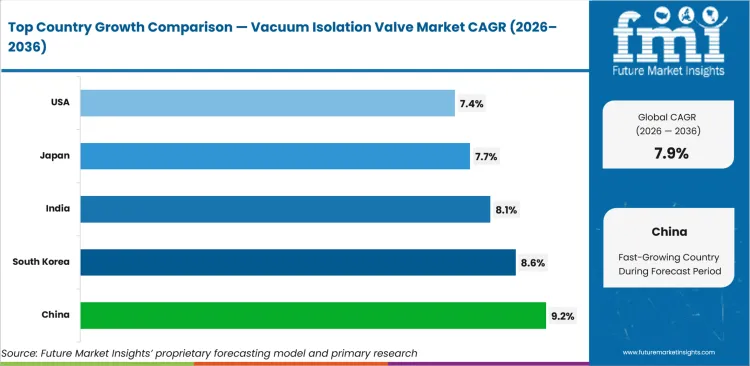
| Country | CAGR |
|---|---|
| China | 9.2% |
| South Korea | 8.6% |
| India | 8.1% |
| Japan | 7.7% |
| United States | 7.4% |
Source: Future Market Insights analysis.
How do country-level CAGRs compare?
- China (CAGR: 9.2%): China is a large semiconductor equipment spending country in the current cycle.
- South Korea (CAGR: 8.6%): South Korea’s demand is tied to memory fabs and semiconductor materials supply chains.
- India (CAGR: 8.1%): India is moving from electronics assembly toward semiconductor manufacturing projects.
- Japan (CAGR: 7.7%): Japan combines domestic semiconductor investment with established vacuum equipment suppliers.
- United States (CAGR: 7.4%): USA buyers connect valve selection to wafer tool uptime and process qualification.
The global Vacuum Isolation Valve Market is forecast to record a CAGR of 7.9% from 2026 to 2036. The study covers 30+ countries across the report regions.
How is the Vacuum Isolation Valve Market developing in China?
China is projected to record a CAGR of 9.2% through 2036. The country outlook identifies this demand signal: China is a large semiconductor equipment spending country in the current cycle.
Country Market Snapshot
| Country | China |
|---|---|
| Forecast CAGR | 9.2% |
| Demand anchor | China is a large semiconductor equipment spending country in the current cycle. |
| Local proof point | China semiconductor equipment sales reached USD 49.3 billion in 2025. |
| Channel signal | Local fab projects favor suppliers with in-country sales and service support. |
| Application mix | Logic, memory, power, and display tools all use vacuum isolation valves. |
| Restraint | Export controls and localization targets can complicate imported valve supply. |
| Primary demand signal | China is a large semiconductor equipment spending country in the current cycle. |
| Company context | Companies active in or serving this market include VAT Group, MKS Inc., ULVAC, CKD, and Fujikin. |
Market Outlook
China is forecast to grow at a CAGR of 9.2% through 2036 as its fab investment creates a notable growth route for vacuum isolation valves. SEMI reported that China equipment sales reached USD 49.3 billion in 2025, making it a large equipment market by country. This volume supports both OEM-installed valves and service replacement demand. Suppliers must handle local lead times, service access, and qualification demands in a policy-sensitive market. Buying behavior in China is shaped by scale and localization.
Key Growth Drivers
- Large fab equipment spending supports high valve volumes.
- Local tool makers increase demand for qualified vacuum components.
- Display and power semiconductor capacity broaden the valve use pool.
- China is a large semiconductor equipment spending country in the current cycle.
Key Restraints
- Export controls can affect access to advanced vacuum components.
- Local price pressure can reduce margins on distributor-led sales.
- Export controls and localization targets can complicate imported valve supply.
Country Market FAQs
What should C-suite teams prioritize in China?
C-suite teams should prioritize qualification requirements, procurement routes, local service coverage, and implementation economics before committing capital or supplier volume.
How should suppliers approach the China market?
Suppliers should align technical evidence, local channel support, and account-specific commercial terms with the buying process used by major customers in China.
What can weaken the business case in China?
Export controls and localization targets can complicate imported valve supply. Executives should test this exposure during supplier, investment, and rollout reviews.
How is the Vacuum Isolation Valve Market developing in South Korea?
South Korea is projected to record a CAGR of 8.6% through 2036. The country outlook identifies this demand signal: South Korea’s demand is tied to memory fabs and semiconductor materials supply chains.
Country Market Snapshot
| Country | South Korea |
|---|---|
| Forecast CAGR | 8.6% |
| Demand anchor | South Korea’s demand is tied to memory fabs and semiconductor materials supply chains. |
| Local proof point | South Korea exported USD 141.9 billion of semiconductors in 2024. |
| Supply signal | Invest Korea states that South Korea held 17.4% of the global semiconductor equipment segment in 2024. |
| Application mix | DRAM, NAND, and advanced packaging support high vacuum tool demand. |
| Restraint | Cyclical memory spending can delay equipment and valve orders. |
| Primary demand signal | South Korea’s demand is tied to memory fabs and semiconductor materials supply chains. |
| Company context | Companies active in or serving this market include VAT Group, MKS Inc., ULVAC, CKD, and Fujikin. |
Market Outlook
South Korea is expected to record a CAGR of 8.6% through 2036 as memory and advanced chip production keep vacuum equipment demand high. Invest Korea reported that semiconductor exports reached USD 141.9 billion in 2024 and represented 20.8% of national exports. This export exposure makes tool uptime and service continuity strategic for fabs. Vacuum isolation valve suppliers need to support high-cycle production environments and fast replacement routes. South Korea’s demand behavior is more concentrated than many markets.
Key Growth Drivers
- Memory fab intensity supports repeated vacuum process tool demand.
- Advanced packaging increases demand for precise chamber control.
- Local supplier ecosystems improve service access for qualified components.
- South Korea’s demand is tied to memory fabs and semiconductor materials supply chains.
Key Restraints
- Memory cycles can cause sharp order timing changes.
- Major fab buyers hold strong pricing power over component suppliers.
- Cyclical memory spending can delay equipment and valve orders.
Country Market FAQs
What should C-suite teams prioritize in South Korea?
C-suite teams should prioritize qualification requirements, procurement routes, local service coverage, and implementation economics before committing capital or supplier volume.
How should suppliers approach the South Korea market?
Suppliers should align technical evidence, local channel support, and account-specific commercial terms with the buying process used by major customers in South Korea.
What can weaken the business case in South Korea?
Cyclical memory spending can delay equipment and valve orders. Executives should test this exposure during supplier, investment, and rollout reviews.
How is the Vacuum Isolation Valve Market developing in India?
India is projected to record a CAGR of 8.1% through 2036. The country outlook identifies this demand signal: India is moving from electronics assembly toward semiconductor manufacturing projects.
Country Market Snapshot
| Country | India |
|---|---|
| Forecast CAGR | 8.1% |
| Demand anchor | India is moving from electronics assembly toward semiconductor manufacturing projects. |
| Local proof point | India approved 10 semiconductor projects worth INR 1.60 lakh crore by December 2025. |
| Policy context | Fiscal support covers up to 50% of eligible project cost under India’s semiconductor framework. |
| Channel signal | Early demand will flow through global OEMs and project integrators. |
| Restraint | Local valve qualification depth is still developing. |
| Primary demand signal | India is moving from electronics assembly toward semiconductor manufacturing projects. |
| Company context | Companies active in or serving this market include VAT Group, MKS Inc., Pfeiffer Vacuum+Fab Solutions, ULVAC, and Kurt J. Lesker Company. |
Market Outlook
India is expected to grow at a CAGR of 8.1% through 2036 as new semiconductor projects create a smaller but faster-growing valve opportunity. India’s government reported that 10 semiconductor projects with total investment of INR 1.60 lakh crore had been approved across six states by December 2025. This supports demand for fab equipment, cleanroom systems, and vacuum components tied to new project timelines. Valve suppliers should prioritize OEM routes and early project engagement.
Key Growth Drivers
- New semiconductor projects create first-wave vacuum component demand.
- Fiscal support improves fab project economics.
- Global vacuum suppliers are building visibility with Indian semiconductor buyers.
- India is moving from electronics assembly toward semiconductor manufacturing projects.
Key Restraints
- Domestic service depth for niche valves remains limited.
- Project delays can shift the timing of tool and component orders.
- Local valve qualification depth is still developing.
Country Market FAQs
What should C-suite teams prioritize in India?
C-suite teams should prioritize qualification requirements, procurement routes, local service coverage, and implementation economics before committing capital or supplier volume.
How should suppliers approach the India market?
Suppliers should align technical evidence, local channel support, and account-specific commercial terms with the buying process used by major customers in India.
What can weaken the business case in India?
Local valve qualification depth is still developing. Executives should test this exposure during supplier, investment, and rollout reviews.
How is the Vacuum Isolation Valve Market developing in Japan?
Japan is projected to record a CAGR of 7.7% through 2036. The country outlook identifies this demand signal: Japan combines domestic semiconductor investment with established vacuum equipment suppliers.
Country Market Snapshot
| Country | Japan |
|---|---|
| Forecast CAGR | 7.7% |
| Demand anchor | Japan combines domestic semiconductor investment with established vacuum equipment suppliers. |
| Local proof point | METI confirmed JASM Factory No. 1 entered mass production in December 2024. |
| Supply structure | ULVAC is a direct local vacuum valve supplier with products across pressure ranges. |
| Application mix | Semiconductor, display, and research vacuum systems support varied valve demand. |
| Restraint | Buyers expect long validation history and conservative change control. |
| Primary demand signal | Japan combines domestic semiconductor investment with established vacuum equipment suppliers. |
| Company context | Companies active in or serving this market include ULVAC, CKD, Fujikin, VAT Group, and MKS Inc. |
Market Outlook
Japan is projected to grow at a CAGR of 7.7% through 2036 as domestic fabs and equipment suppliers support vacuum component demand. Japan’s economy ministry confirmed that JASM Factory No. 1 entered mass production in December 2024, with continued public attention on Kumamoto semiconductor investment. That creates local demand for qualified fab equipment and service support. Valve suppliers benefit when they can serve both tool makers and fab maintenance teams.
Key Growth Drivers
- Kumamoto fab activity supports process equipment demand.
- Domestic vacuum suppliers shorten engineering and service response.
- Display and research vacuum applications extend demand beyond fabs.
- Japan combines domestic semiconductor investment with established vacuum equipment suppliers.
Key Restraints
- Conservative buyer validation slows new supplier entry.
- High-spec domestic competition pressures imported suppliers.
- Buyers expect long validation history and conservative change control.
Country Market FAQs
What should C-suite teams prioritize in Japan?
C-suite teams should prioritize qualification requirements, procurement routes, local service coverage, and implementation economics before committing capital or supplier volume.
How should suppliers approach the Japan market?
Suppliers should align technical evidence, local channel support, and account-specific commercial terms with the buying process used by major customers in Japan.
What can weaken the business case in Japan?
Buyers expect long validation history and conservative change control. Executives should test this exposure during supplier, investment, and rollout reviews.
How is the Vacuum Isolation Valve Market developing in the United States?
The United States is projected to record a CAGR of 7.4% through 2036. The country outlook identifies this demand signal: USA buyers connect valve selection to wafer tool uptime and process qualification.
Country Market Snapshot
| Country | United States |
|---|---|
| Forecast CAGR | 7.4% |
| Demand anchor | USA buyers connect valve selection to wafer tool uptime and process qualification. |
| Supply structure | MKS Inc., Agilent Technologies, and Kurt J. Lesker Company provide relevant USA vacuum component depth. |
| Application mix | Semiconductor fabs, national labs, and thin-film tool users form the main demand pool. |
| Channel signal | Direct OEM sales dominate high-value tools while distributors serve labs and replacement demand. |
| Restraint | Long qualification cycles slow supplier switching after a valve is embedded in a tool platform. |
| Primary demand signal | USA buyers connect valve selection to wafer tool uptime and process qualification. |
| Company context | Companies active in or serving this market include MKS Inc., VAT Group, Kurt J. Lesker Company, MDC Vacuum, and HVA. |
Market Outlook
The United States is projected to record a CAGR of 7.4% through 2036 as advanced manufacturing and research vacuum systems support steady valve demand. North America semiconductor equipment sales were USD 10.9 billion in 2025, although SEMI reported a 20% decline from 2024. This means USA valve growth depends less on one-year equipment swings and more on tool qualification in high-value process lines. Suppliers need strong engineering support and documented service behavior.
Key Growth Drivers
- Advanced wafer tools support demand for qualified gate and angle valves.
- Research laboratories use high vacuum and ultra-high vacuum valve systems.
- Local service networks raise buyer confidence for rebuild and replacement work.
- USA buyers connect valve selection to wafer tool uptime and process qualification.
Key Restraints
- OEM qualification cycles restrict quick substitution between valve suppliers.
- High-spec valves face cost pressure when fab spending pauses.
- Long qualification cycles slow supplier switching after a valve is embedded in a tool platform.
Country Market FAQs
What should C-suite teams prioritize in the United States?
C-suite teams should prioritize qualification requirements, procurement routes, local service coverage, and implementation economics before committing capital or supplier volume.
How should suppliers approach the United States market?
Suppliers should align technical evidence, local channel support, and account-specific commercial terms with the buying process used by major customers in the United States.
What can weaken the business case in the United States?
Long qualification cycles slow supplier switching after a valve is embedded in a tool platform. Executives should test this exposure during supplier, investment, and rollout reviews.
Which companies are discussed in the Vacuum Isolation Valve Market?
The preview discusses VAT Group, MKS Inc, Pfeiffer Vacuum+Fab Solutions, ULVAC, and Kurt J. Lesker Company among the companies active in this market.
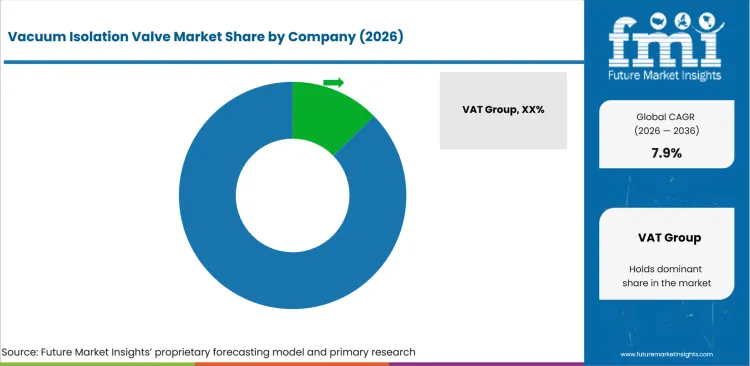
The market is moderately concentrated because high-spec valve qualification limits the number of suppliers accepted by established OEMs. VAT Group holds a strong position in semiconductor vacuum valves due to portfolio depth and process-specific engineering. Smaller suppliers compete in research, industrial vacuum, and replacement channels where buyer qualification barriers are lower.
Entry barriers include leak testing, cleanroom production, long cycle-life proof, and regional service capability. Service capability affects supplier strength as rebuild kits can reduce downtime without replacing full valve bodies. Competition is shaped by process fit before commercial negotiation starts.
How is competition structured?
Competition reflects differences in specialization, portfolio scope, geographic reach, evidence, and customer access.
The supplier field is best understood by role because buyers separate process-qualified valve makers from broad vacuum system providers.
- Process-Qualified Valve Specialists: VAT Group and ULVAC compete with broad vacuum valve portfolios covering gate, angle, butterfly, pendulum, high vacuum, and ultra-high vacuum uses. Their advantage comes from cleanroom manufacturing, low-leak engineering, and experience in semiconductor process tools.
- Vacuum System and Service Providers: MKS Inc., Pfeiffer Vacuum+Fab Solutions, and Agilent Technologies compete through vacuum system knowledge, service access, and adjacent products used around chambers.
- Specialist and Channel-Driven Suppliers: Kurt J. Lesker Company and selected regional distributors compete in research, industrial vacuum, and replacement channels. Their strength comes from catalog breadth, chamber accessories, and engineering support for custom vacuum assemblies.
How do selected companies compare?
The selected companies differ in portfolio focus, geographic reach, evidence depth, and channel strength.
| Company | Competitive position |
|---|---|
| VAT Group | VAT Group is assessed for fab qualification, process capability, field service, and regional semiconductor customer support. |
| MKS Inc. | MKS Inc. is assessed for fab qualification, process capability, field service, and regional semiconductor customer support. |
| Pfeiffer Vacuum+Fab Solutions | Pfeiffer Vacuum+Fab Solutions is assessed for fab qualification, process capability, field service, and regional semiconductor customer support. |
| ULVAC | ULVAC is assessed for fab qualification, process capability, field service, and regional semiconductor customer support. |
| Kurt J. Lesker Company | Kurt J. Lesker Company is assessed for fab qualification, process capability, field service, and regional semiconductor customer support. |
What are the key developments in the Vacuum Isolation Valve Market?
- In March 2026, VAT Group reported that semiconductor vacuum valve demand stayed tied to wafer fabrication equipment recovery. This reinforces the link between valve sales and fab tool cycles.
- In June 2024, MKS announced plans for a Super Center factory in Penang, Malaysia. The site supports regional wafer fabrication equipment supply.
- In May 2025, MKS changed its corporate name from MKS Instruments to MKS Inc. The change reflects a broader identity across process technology offerings.
Selected Companies in the Vacuum Isolation Valve Market
Companies referenced in this preview
- VAT Group.
- MKS Inc.
- Pfeiffer Vacuum+Fab Solutions.
- ULVAC.
- Kurt J. Lesker Company.
- CKD.
- Fujikin.
- MDC Vacuum.
Market Scope & Definition
| Metric | Value |
|---|---|
| Market definition | The Vacuum Isolation Valve Market covers valves used to open, close, and isolate vacuum chambers or vacuum lines in controlled-pressure systems. |
| Functions covered | Gate Valves, Angle Valves, Butterfly Valves, Pendulum / Slit Valves |
| End-use industries | Semiconductor, Display, Research / Labs, Industrial Vacuum |
| Inclusions | Market scope covers gate valves, angle valves, butterfly valves, pendulum / slit valves, rough vacuum products, high vacuum products, ultra-high vacuum products, manual units, pneumatic units, electric / motorized units, semiconductor users, display users, research / labs users, industrial vacuum users, direct OEM channels, distributors, service / replacement channels, and the selected country coverage for 2026 to 2036. |
| Exclusions | Market scope excludes non-vacuum industrial valves, sanitary valves, water valves, hydraulic valves, pressure regulators, mass flow controllers, gas panels, pure gas delivery assemblies, and pump-only systems unless the product is sold as a vacuum isolation valve. |
Research Methodology
| Metric | Value |
|---|---|
| Primary Research | FMI analysts reviewed buying criteria used by semiconductor tool OEMs, fab maintenance teams, vacuum component distributors, and service providers. Interviews focused on valve qualification, cycle-life expectations, support-time risk, and replacement behavior. |
| Desk Research | The desk review used semiconductor equipment data, company product information, vacuum technology references, and official policy sources to define the addressable product pool. Product scope was checked against valve types used in high vacuum and ultra-high vacuum systems. |
| Market Sizing and Forecasting | The model combined installed chamber counts, wafer equipment spending, valve replacement rates, average selling price bands, and country-level tool investment patterns. The forecast was cross-checked against adjacent wafer processing equipment and vacuum system demand. |
| Data Validation | Forecasts were tested against semiconductor fab equipment cycles, display equipment trends, research vacuum spending, and supplier product portfolios. The final outlook was reviewed against company activity in consumable parts for semiconductor equipment and service replacement channels. |
What does the report cover?
The report covers valve type, vacuum range, actuation, end use, sales channel, and region across the 2026-2036 forecast period in 30+ countries.
| Metric | Value |
|---|---|
| Periods | Base year 2025; estimated year 2026; forecast period 2026-2036 |
| Segment axes | valve type, vacuum range, actuation, end use, sales channel, and region |
| Regions | North America, Western Europe, East Asia, South Asia and Pacific |
| Countries | United States, United Kingdom, Germany, France, Japan, China, South Korea, India and 30+ countries |
| Companies | VAT Group, MKS Inc., Pfeiffer Vacuum+Fab Solutions, ULVAC, Kurt J. Lesker Company, CKD, Fujikin, MDC Vacuum, and others |
| Approach | Hybrid bottom-up and top-down methodology using equipment spending, tool use rates, channel behavior, and replacement demand. |
Market Segmentation Analysis
Segmented by Valve Type
- Gate Valves.
- Angle Valves.
- Butterfly Valves.
- Pendulum / Slit Valves.
Segmented by Vacuum Range
- Rough Vacuum.
- High Vacuum.
- Ultra-high Vacuum.
Segmented by Actuation
- Manual.
- Pneumatic.
- Electric / Motorized.
Segmented by End Use
- Semiconductor.
- Display.
- Research / Labs.
- Industrial Vacuum.
Segmented by Sales Channel
- Direct OEM.
- Distributors.
- Service / Replacement.
By Region
- North America.
- United States.
- Western Europe.
- Germany.
- France.
- United Kingdom.
- East Asia.
- China.
- Japan.
- South Korea.
- South Asia and Pacific.
- India.
Research Sources and Bibliography
- SEMI. (2026, April 7). Global semiconductor manufacturing equipment sales increased 15% to $135.1 billion in 2025. SEMI.
- SEMI. (2025, October 8). Global 300mm fab equipment spending expected to reach $374 billion from 2026 to 2028. SEMI.
- Government of the United Kingdom. (2026). UK semiconductor sector study 2026. GOV.UK.
- UK Research and Innovation. (2024, September 27). £11.5 million boost for semiconductor manufacturing. UKRI.
- European Commission. (2024, August 20). Commission approves €5 billion German State aid measure to support ESMC semiconductor manufacturing facility. European Commission.
- European Investment Bank. (2024, January 25). Project Liberty. European Investment Bank.
- Ministry of Economy, Trade and Industry. (2025, January 21). Minister’s press conference. METI.
- Invest Korea. (2025, October 2). Semiconductor industry in Korea. KOTRA.
- Press Information Bureau. (2025, December). India Semiconductor Mission and semiconductor ecosystem update. Government of India.
- VAT Group. (2026). Vacuum valves for industrial applications. VAT Group.
- VAT Group. (2026). Control valves. VAT Group.
- MKS Inc. (2026). Isolation valve rebuild kits. MKS Inc.
- Kurt J. Lesker Company. (2026). Vacuum valves. Kurt J. Lesker Company.
- ULVAC. (2026). Vacuum valves. ULVAC.
- MKS Inc. (2024, June 10). MKS announces plans for super center factory in Penang, Malaysia. MKS Inc.
- MKS Inc. (2025, May 15). MKS Instruments announces corporate name change to MKS Inc. MKS Inc.
The bibliography is provided for reader reference and uses primary non-commercial government, regulatory, official trade body, and official company publications.
This Report Answers
- What is the projected value of the Vacuum Isolation Valve Market in 2026?
- What value is forecast for the Vacuum Isolation Valve Market by 2036?
- What CAGR is forecast for the Vacuum Isolation Valve Market from 2026 to 2036?
- What 2026 share is projected for Gate Valves within the valve type category?
- What 2026 share is projected for High Vacuum within the vacuum range category?
- Which demand factors support the Vacuum Isolation Valve Market outlook?
- Which restraints and opportunities affect adoption in the Vacuum Isolation Valve Market?
- How are country CAGR outlooks, including China at 9.2%, compared?
- Which companies and product developments are covered in the competitive analysis?
- What is included in the market scope, and how is the forecast validated?
Frequently Asked Questions
Why should executives track the Vacuum Isolation Valve Market?
Executives should track this market because it can affect capital allocation, supplier strategy, operating risk, and competitive positioning across commercial planning cycles.
What business problem does the Vacuum Isolation Valve Market address?
It helps executive teams judge where customer pain, supplier capability, compliance exposure, and implementation economics justify investment, procurement, or portfolio action.
What should procurement leaders evaluate before selecting suppliers?
Procurement leaders should assess evidence quality, integration fit, service coverage, compliance readiness, total cost of ownership, and supplier execution capability.
What can limit return on investment for buyers?
Return on investment can be limited by low utilization, integration delays, training gaps, unclear ownership, pricing pressure, or weak fit with existing workflows.
How can suppliers build executive confidence?
Suppliers can build confidence by proving implementation speed, risk reduction, support depth, reference use cases, and measurable outcomes for budget owners.
Preview the report firsthand - request a free sample
Get SampleGet the brochure for pricing and purchase details.
Get PDFTable of Content
- Key Takeaways
- Market Size and CAGR
- Top Growth Driver
- Fastest Growing Segment
- Leading Region
- Key Companies
- Emerging Opportunities
- Executive Summary
- Global Market Outlook
- Demand-side Trends
- Supply-side Trends
- Technology Roadmap Analysis
- Analysis and Recommendations
- Analyst Perspective (What is happening? Why now? What should investors know?)
- Key Questions Answered
- How large is the market?
- What is the CAGR?
- What are key trends?
- Which region dominates?
- Who are the leaders?
- Market Overview
- Market Coverage / Taxonomy
- Market Definition / Scope / Limitations
- Research Methodology
- Chapter Orientation
- Analytical Lens and Working Hypotheses
- Market Structure, Signals, and Trend Drivers
- Benchmarking and Cross-market Comparability
- Market Sizing, Forecasting, and Opportunity Mapping
- Research Design and Evidence Framework
- Desk Research Programme (Secondary Evidence)
- Expert Input and Fieldwork (Primary Evidence)
- Tooling, Models, and Reference Databases
- Data Engineering and Model Build
- Quality Assurance and Audit Trail
- Market Background
- Market Dynamics (Drivers, Restraints, Opportunity, Trends)
- Scenario Forecast (Optimistic, Likely, Conservative)
- Impact Analysis
- AI Impact
- Sustainability Impact
- Regulatory Impact
- Technology Impact
- Consumer / Buyer Analysis
- Purchase Drivers
- Adoption Barriers
- Buyer Journey
- Opportunity Map Analysis
- Product Life Cycle Analysis
- Supply Chain Analysis
- Investment Feasibility Matrix
- Value Chain Analysis
- PESTLE and Porter's Analysis
- Regulatory Landscape
- Regional Parent Market Outlook
- Production and Consumption Statistics
- Import and Export Statistics
- Global Market Analysis and Forecast, 2021 to 2036
- Historical Market Size Value (USD Billion) & Volume (Unit) Analysis, 2021 to 2025
- Current and Future Market Size Value (USD Billion) & Volume (Unit) Projections, 2026 to 2036
- Y-o-Y Growth Trend Analysis
- Absolute $ Opportunity Analysis
- Global Market Pricing Analysis, 2021 to 2036
- Global Market Analysis and Forecast, By Valve Type, 2021 to 2036
- Introduction / Key Findings
- Historical Market Size Value (USD Billion) & Volume (Unit) Analysis By Valve Type, 2021 to 2025
- Current and Future Market Size Value (USD Billion) & Volume (Unit) Analysis and Forecast By Valve Type, 2026 to 2036
- Gate Valves
- Angle Valves
- Butterfly Valves
- Pendulum - Slit Valves
- Gate Valves
- Y-o-Y Growth Trend Analysis By Valve Type, 2021 to 2025
- Absolute $ Opportunity Analysis By Valve Type, 2026 to 2036
- Global Market Analysis and Forecast, By Vacuum Range, 2021 to 2036
- Introduction / Key Findings
- Historical Market Size Value (USD Billion) & Volume (Unit) Analysis By Vacuum Range, 2021 to 2025
- Current and Future Market Size Value (USD Billion) & Volume (Unit) Analysis and Forecast By Vacuum Range, 2026 to 2036
- High Vacuum
- Rough Vacuum
- Ultra-high Vacuum
- High Vacuum
- Y-o-Y Growth Trend Analysis By Vacuum Range, 2021 to 2025
- Absolute $ Opportunity Analysis By Vacuum Range, 2026 to 2036
- Global Market Analysis and Forecast, By Actuation, 2021 to 2036
- Introduction / Key Findings
- Historical Market Size Value (USD Billion) & Volume (Unit) Analysis By Actuation, 2021 to 2025
- Current and Future Market Size Value (USD Billion) & Volume (Unit) Analysis and Forecast By Actuation, 2026 to 2036
- Pneumatic
- Manual
- Electric - Motorized
- Pneumatic
- Y-o-Y Growth Trend Analysis By Actuation, 2021 to 2025
- Absolute $ Opportunity Analysis By Actuation, 2026 to 2036
- Global Market Analysis and Forecast, By End Use, 2021 to 2036
- Introduction / Key Findings
- Historical Market Size Value (USD Billion) & Volume (Unit) Analysis By End Use, 2021 to 2025
- Current and Future Market Size Value (USD Billion) & Volume (Unit) Analysis and Forecast By End Use, 2026 to 2036
- Semiconductor
- Display
- Research - Labs
- Industrial Vacuum
- Semiconductor
- Y-o-Y Growth Trend Analysis By End Use, 2021 to 2025
- Absolute $ Opportunity Analysis By End Use, 2026 to 2036
- Global Market Analysis and Forecast, By Sales Channel, 2021 to 2036
- Introduction / Key Findings
- Historical Market Size Value (USD Billion) & Volume (Unit) Analysis By Sales Channel, 2021 to 2025
- Current and Future Market Size Value (USD Billion) & Volume (Unit) Analysis and Forecast By Sales Channel, 2026 to 2036
- Direct OEM
- Distributors
- Service - Replacement
- Direct OEM
- Y-o-Y Growth Trend Analysis By Sales Channel, 2021 to 2025
- Absolute $ Opportunity Analysis By Sales Channel, 2026 to 2036
- Global Market Analysis and Forecast, By Region, 2021 to 2036
- Introduction
- Historical Market Size Value (USD Billion) & Volume (Unit) Analysis By Region, 2021 to 2025
- Current Market Size Value (USD Billion) & Volume (Unit) Analysis and Forecast By Region, 2026 to 2036
- North America
- Latin America
- Western Europe
- Eastern Europe
- East Asia
- South Asia and Pacific
- Middle East & Africa
- Market Attractiveness Analysis By Region
- North America Market Analysis and Forecast, By Country, 2021 to 2036
- Historical Market Size Value (USD Billion) & Volume (Unit) Trend Analysis By Market Taxonomy, 2021 to 2025
- Market Size Value (USD Billion) & Volume (Unit) Forecast By Market Taxonomy, 2026 to 2036
- By Country
- USA
- Canada
- Mexico
- By Valve Type
- By Vacuum Range
- By Actuation
- By End Use
- By Sales Channel
- By Country
- Market Attractiveness Analysis
- By Country
- By Valve Type
- By Vacuum Range
- By Actuation
- By End Use
- By Sales Channel
- Key Takeaways
- Latin America Market Analysis and Forecast, By Country
- Historical Market Size Value (USD Billion) & Volume (Unit) Trend Analysis By Market Taxonomy, 2021 to 2025
- Market Size Value (USD Billion) & Volume (Unit) Forecast By Market Taxonomy, 2026 to 2036
- By Country
- Brazil
- Chile
- Rest of Latin America
- By Valve Type
- By Vacuum Range
- By Actuation
- By End Use
- By Sales Channel
- By Country
- Market Attractiveness Analysis
- By Country
- By Valve Type
- By Vacuum Range
- By Actuation
- By End Use
- By Sales Channel
- Key Takeaways
- Western Europe Market Analysis and Forecast, By Country
- Historical Market Size Value (USD Billion) & Volume (Unit) Trend Analysis By Market Taxonomy, 2021 to 2025
- Market Size Value (USD Billion) & Volume (Unit) Forecast By Market Taxonomy, 2026 to 2036
- By Country
- Germany
- UK
- Italy
- Spain
- France
- Nordic
- BENELUX
- Rest of Western Europe
- By Valve Type
- By Vacuum Range
- By Actuation
- By End Use
- By Sales Channel
- By Country
- Market Attractiveness Analysis
- By Country
- By Valve Type
- By Vacuum Range
- By Actuation
- By End Use
- By Sales Channel
- Key Takeaways
- Eastern Europe Market Analysis and Forecast, By Country
- Historical Market Size Value (USD Billion) & Volume (Unit) Trend Analysis By Market Taxonomy, 2021 to 2025
- Market Size Value (USD Billion) & Volume (Unit) Forecast By Market Taxonomy, 2026 to 2036
- By Country
- Russia
- Poland
- Hungary
- Balkan & Baltic
- Rest of Eastern Europe
- By Valve Type
- By Vacuum Range
- By Actuation
- By End Use
- By Sales Channel
- By Country
- Market Attractiveness Analysis
- By Country
- By Valve Type
- By Vacuum Range
- By Actuation
- By End Use
- By Sales Channel
- Key Takeaways
- East Asia Market Analysis and Forecast, By Country
- Historical Market Size Value (USD Billion) & Volume (Unit) Trend Analysis By Market Taxonomy, 2021 to 2025
- Market Size Value (USD Billion) & Volume (Unit) Forecast By Market Taxonomy, 2026 to 2036
- By Country
- China
- Japan
- South Korea
- By Valve Type
- By Vacuum Range
- By Actuation
- By End Use
- By Sales Channel
- By Country
- Market Attractiveness Analysis
- By Country
- By Valve Type
- By Vacuum Range
- By Actuation
- By End Use
- By Sales Channel
- Key Takeaways
- South Asia and Pacific Market Analysis and Forecast, By Country
- Historical Market Size Value (USD Billion) & Volume (Unit) Trend Analysis By Market Taxonomy, 2021 to 2025
- Market Size Value (USD Billion) & Volume (Unit) Forecast By Market Taxonomy, 2026 to 2036
- By Country
- India
- ASEAN
- Australia & New Zealand
- Rest of South Asia and Pacific
- By Valve Type
- By Vacuum Range
- By Actuation
- By End Use
- By Sales Channel
- By Country
- Market Attractiveness Analysis
- By Country
- By Valve Type
- By Vacuum Range
- By Actuation
- By End Use
- By Sales Channel
- Key Takeaways
- Middle East & Africa Market Analysis and Forecast, By Country
- Historical Market Size Value (USD Billion) & Volume (Unit) Trend Analysis By Market Taxonomy, 2021 to 2025
- Market Size Value (USD Billion) & Volume (Unit) Forecast By Market Taxonomy, 2026 to 2036
- By Country
- Kingdom of Saudi Arabia
- Other GCC Countries
- Türkiye
- South Africa
- Other African Union
- Rest of Middle East & Africa
- By Valve Type
- By Vacuum Range
- By Actuation
- By End Use
- By Sales Channel
- By Country
- Market Attractiveness Analysis
- By Country
- By Valve Type
- By Vacuum Range
- By Actuation
- By End Use
- By Sales Channel
- Key Takeaways
- Key Countries Market Analysis
- USA
- Pricing Analysis
- Market Share Analysis, 2025
- By Valve Type
- By Vacuum Range
- By Actuation
- By End Use
- By Sales Channel
- Canada
- Pricing Analysis
- Market Share Analysis, 2025
- By Valve Type
- By Vacuum Range
- By Actuation
- By End Use
- By Sales Channel
- Mexico
- Pricing Analysis
- Market Share Analysis, 2025
- By Valve Type
- By Vacuum Range
- By Actuation
- By End Use
- By Sales Channel
- Brazil
- Pricing Analysis
- Market Share Analysis, 2025
- By Valve Type
- By Vacuum Range
- By Actuation
- By End Use
- By Sales Channel
- Chile
- Pricing Analysis
- Market Share Analysis, 2025
- By Valve Type
- By Vacuum Range
- By Actuation
- By End Use
- By Sales Channel
- Germany
- Pricing Analysis
- Market Share Analysis, 2025
- By Valve Type
- By Vacuum Range
- By Actuation
- By End Use
- By Sales Channel
- UK
- Pricing Analysis
- Market Share Analysis, 2025
- By Valve Type
- By Vacuum Range
- By Actuation
- By End Use
- By Sales Channel
- Italy
- Pricing Analysis
- Market Share Analysis, 2025
- By Valve Type
- By Vacuum Range
- By Actuation
- By End Use
- By Sales Channel
- Spain
- Pricing Analysis
- Market Share Analysis, 2025
- By Valve Type
- By Vacuum Range
- By Actuation
- By End Use
- By Sales Channel
- France
- Pricing Analysis
- Market Share Analysis, 2025
- By Valve Type
- By Vacuum Range
- By Actuation
- By End Use
- By Sales Channel
- India
- Pricing Analysis
- Market Share Analysis, 2025
- By Valve Type
- By Vacuum Range
- By Actuation
- By End Use
- By Sales Channel
- ASEAN
- Pricing Analysis
- Market Share Analysis, 2025
- By Valve Type
- By Vacuum Range
- By Actuation
- By End Use
- By Sales Channel
- Australia & New Zealand
- Pricing Analysis
- Market Share Analysis, 2025
- By Valve Type
- By Vacuum Range
- By Actuation
- By End Use
- By Sales Channel
- China
- Pricing Analysis
- Market Share Analysis, 2025
- By Valve Type
- By Vacuum Range
- By Actuation
- By End Use
- By Sales Channel
- Japan
- Pricing Analysis
- Market Share Analysis, 2025
- By Valve Type
- By Vacuum Range
- By Actuation
- By End Use
- By Sales Channel
- South Korea
- Pricing Analysis
- Market Share Analysis, 2025
- By Valve Type
- By Vacuum Range
- By Actuation
- By End Use
- By Sales Channel
- Russia
- Pricing Analysis
- Market Share Analysis, 2025
- By Valve Type
- By Vacuum Range
- By Actuation
- By End Use
- By Sales Channel
- Poland
- Pricing Analysis
- Market Share Analysis, 2025
- By Valve Type
- By Vacuum Range
- By Actuation
- By End Use
- By Sales Channel
- Hungary
- Pricing Analysis
- Market Share Analysis, 2025
- By Valve Type
- By Vacuum Range
- By Actuation
- By End Use
- By Sales Channel
- Kingdom of Saudi Arabia
- Pricing Analysis
- Market Share Analysis, 2025
- By Valve Type
- By Vacuum Range
- By Actuation
- By End Use
- By Sales Channel
- Türkiye
- Pricing Analysis
- Market Share Analysis, 2025
- By Valve Type
- By Vacuum Range
- By Actuation
- By End Use
- By Sales Channel
- South Africa
- Pricing Analysis
- Market Share Analysis, 2025
- By Valve Type
- By Vacuum Range
- By Actuation
- By End Use
- By Sales Channel
- USA
- Market Structure Analysis
- Competition Dashboard
- Competition Benchmarking
- Market Share Analysis of Top Players
- By Regional
- By Valve Type
- By Vacuum Range
- By Actuation
- By End Use
- By Sales Channel
- Emerging Startups
- Innovation Benchmarking
- Competition Analysis
- Competition Deep Dive
- VAT Group
- Overview
- Product Portfolio
- Profitability by Market Segments (Product/Region/Sales Channel)
- Sales Footprint
- Strategy Overview
- Marketing Strategy
- Product Strategy
- Channel Strategy
- MKS Inc
- Pfeiffer Vacuum+Fab Solutions
- ULVAC
- Kurt J. Lesker Company
- CKD
- Fujikin
- MDC Vacuum
- VAT Group
- Case Studies
- Success Stories
- Recent Developments
- Competition Deep Dive
- Assumptions & Acronyms Used


