Viscosity Index Improver Market Size and Share Forecast Outlook 2025 to 2035

The Viscosity Index Improver Market is estimated to be valued at USD 4.2 billion in 2025 and is projected to reach USD 5.6 billion by 2035, registering a compound annual growth rate (CAGR) of 2.9% over the forecast period.
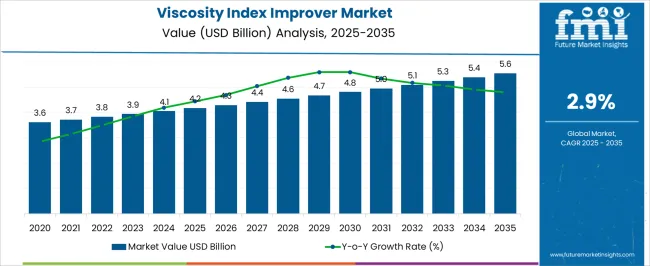
Quick Stats for Viscosity Index Improver Market

  • Viscosity Index Improver Market Industry Value (2025): USD 4.2 billion
  • Viscosity Index Improver Market Forecast Value (2035): USD 5.6 billion
  • Viscosity Index Improver Market Forecast CAGR: 2.9%
  • Leading Segment in Viscosity Index Improver Market in 2025: Ethylene Propylene Copolymer (OCP) (30.4%)
  • Key Growth Region in Viscosity Index Improver Market: North America, Asia-Pacific, Europe
  • Top Key Players in Viscosity Index Improver Market: The Lubrizol Corporation, Infineum International Limited, Chevron Oronite Company LLC, Evonik Industries AG, Afton Chemical Corporation, BASF SE, Sanyo Chemical Industries, Croda International Plc, Lanxess AG, Mitsui Chemicals, Inc., Shenyang Great Wall Lubricating Oil Manufacturing Co., Ltd.

Viscosity Index Improver Market Market Value Analysis

Metric Value
Viscosity Index Improver Market Estimated Value in (2025 E) USD 4.2 billion
Viscosity Index Improver Market Forecast Value in (2035 F) USD 5.6 billion
Forecast CAGR (2025 to 2035) 2.9%

Rationale for Segmental Growth in the Viscosity Index Improver Market

The viscosity index improver market is expanding steadily, driven by the rising demand for high-performance lubricants across automotive and industrial sectors. Industry updates and company disclosures have emphasized that modern engines and machinery require lubricants capable of maintaining stability under extreme temperature variations. Viscosity index improvers play a critical role in ensuring that lubricants retain optimal flow characteristics, supporting engine efficiency and extending component life.

Regulatory pressures to reduce emissions and improve fuel economy have accelerated the development and adoption of advanced lubricant formulations incorporating viscosity index improvers. Additionally, the growth of the automotive sector, particularly in emerging economies, alongside rapid industrialization, has amplified consumption volumes.

Innovations in polymer chemistry and R&D investments have resulted in improvers with enhanced shear stability and oxidative resistance, improving their effectiveness in long-drain interval oils. Looking ahead, market growth will continue to be supported by stricter environmental regulations, expansion of vehicle fleets, and the increasing shift toward synthetic and semi-synthetic lubricants in both transportation and industrial applications.
Segmental Analysis

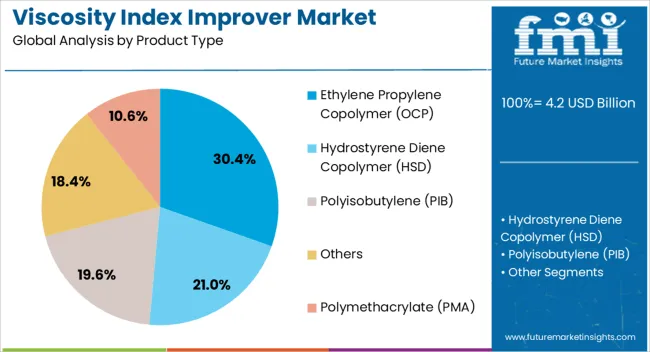
Insights into the Product Type Segment: Ethylene Propylene Copolymer (OCP)

Viscosity Index Improver Market Analysis By Product Type

The Ethylene Propylene Copolymer (OCP) segment is projected to contribute 30.4% of the viscosity index improver market revenue in 2025, securing its position as the leading product type. This segment’s growth has been supported by OCP’s strong performance in enhancing viscosity stability under wide temperature ranges. Its compatibility with a variety of base oils and high resistance to thermal degradation have made it a preferred choice for formulating durable and efficient lubricants.

Technical evaluations have highlighted that OCP offers superior shear stability, ensuring consistent performance in heavy-duty and passenger vehicle lubricants. Additionally, OCP-based improvers have been increasingly incorporated into synthetic and semi-synthetic oils due to their ability to meet demanding automotive specifications.

Producers have expanded capacity for OCP to address growing demand from both developed and emerging markets, reflecting its established role in lubricant formulations. With ongoing advancements in polymer synthesis improving efficiency and adaptability, the OCP segment is expected to maintain its growth trajectory.
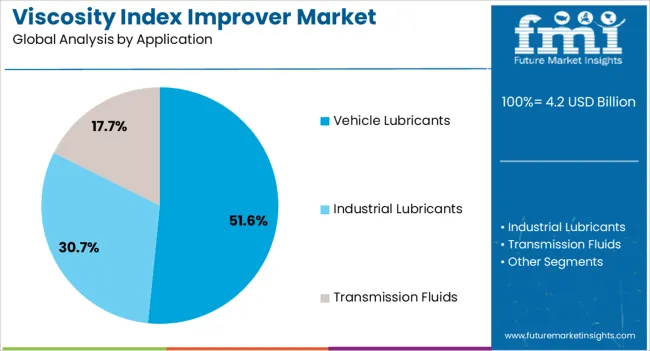
Insights into the Application Segment: Vehicle Lubricants

Viscosity Index Improver Market Analysis By Application

The Vehicle Lubricants segment is projected to account for 51.6% of the viscosity index improver market revenue in 2025, holding its place as the dominant application segment. Growth in this segment has been driven by the global expansion of automotive fleets and the rising need for high-quality lubricants that enhance fuel efficiency and reduce wear.

Industry reports and automotive standards have highlighted that modern engines operate under higher stress and temperature conditions, necessitating lubricants with advanced viscosity modifiers. Vehicle lubricants formulated with viscosity index improvers have been essential in meeting regulatory demands for reduced emissions and extended oil-drain intervals.

Furthermore, the popularity of synthetic lubricants in both passenger and commercial vehicles has reinforced demand for improvers that deliver superior thermal stability and long-term performance. With increasing consumer focus on vehicle reliability and efficiency, coupled with ongoing advancements in lubricant formulations, the Vehicle Lubricants segment is expected to sustain its leadership in driving the viscosity index improver market.

Historical Analysis and Forecast Projection for Viscosity Index Improvers

Demand has historically developed at a CAGR of 2.3%. However, sales have started to progress at a slightly better pace, displaying a CAGR of 2.9% from 2025 to 2035.

Attributes Details
Historical CAGR for 2020 to 2025 2.3%

The global pandemic has disrupted businesses, causing a drop in demand and lockdown regulations. However, the viscosity index improvers industry is anticipated to develop steadily due to increased consumption. As they have a direct impact on the entire lubricant cost structure, crude oil prices have a substantial effect on the cost of manufacturing base oils, especially viscosity index improvers.

The pricing strategies and manufacturing costs of viscosity index improvers are impacted by fluctuating crude oil prices, which also influence lubricant manufacturers and end users. Geopolitical factors and the state of the world economy also influence price volatility.

Business Opportunities for Viscosity Index Improver Manufacturers

The viscosity improver sector is helmed by the elevated demand for high-performance lubricants with proper viscosity, divined to provide prospects in the automotive and industrial sectors.

Manufacturers in the VII sector are extending their operations due to the increasing demand for high-quality lubricants that function at varied temperatures. This ensures proper machine operation and longevity.

Environmental consciousness encourages bio-based viscosity improvers, utilizing renewable sources like vegetable oils and esters to enhance lubricant performance and support eco-friendly initiatives.

Key Trends Influencing the Viscosity Index Improver Market

Widespread Electronic Automotive Industry Demand for Viscosity Improvers

The automotive industry compels the viscosity index improvers sector as global vehicle production demands high-quality lubricants with effective viscosity index improvers. The production of electric cars (EVs) necessitates the use of specialty lubricants containing VIIs, which are vital for components like bearings and gears in EVs.

Modern engines, designed for high-performance vehicles, use engine oils with viscosity improvers to maintain constant lubrication over a wide temperature range. For instance, multigrade oils like 5W-30 or 10W-40 to maintain the right viscosity at both high and low temperatures use VIIs, enhancing engine protection.

The automotive industry's focus on fuel efficiency, emission reduction, and advanced powertrain development is driving a rising demand for lubricants with efficient viscosity index improvers.

Industrialization to Boost Uptake of VIIs

The development of various sectors, a significant consumer of viscosity lubricants, is mainly propelled by the infrastructural improvements of emerging economies. On top of that, the widespread use of hydraulic fluid for heavy-load equipment lubrication supports this growth.

Industrial oil and grease manufacturers are eyeing promising revenue opportunities in the automotive and metalworking sectors. This is owing to the high durability, corrosion protection, and electrical resistance offered by their products.

The viscosity improver industry is poised for growth thanks to the increasing adoption of advanced technologies such as AI and automation in end-use industries like food processing and metal manufacturing. This trend is leading to enhanced machine usage, creating demand for viscosity improvers.

Nanoparticles and Copolymer Blends Intensify the Demand for Oil Additives

Manufacturers in the oil and lubricant industry are developing engine oils with nanoparticles to reduce cold-start engine damage, enhancing vehicle efficiency and performance in light-duty industries. Industry experts estimate that by 2035, the viscosity index improvers demand for automotive is anticipated to produce nearly 1,004 kilotons of engine oil.

Manufacturers are introducing Nano-lubricant oils containing MWCNT and ZnO nanoparticles. These significantly reduce viscosity, preventing damage during cold start conditions.

Automotive manufacturers are developing hydrogenated styrene-isoprene (HSD) copolymers to improve thermal oxidation stability in engines. This development is influencing the growing demand for HSD copolymers in long-span multistage internal combustion engine oil.

Category-wise Insights

Comprehensive assessments of segments of the viscosity index improver market are provided in the section that follows. While there is substantial demand for ethylene-propylene copolymer, there is projected to be an uptick in the requirement for vehicle lubricants in 2025.

Demand for Ethylene Propylene Copolymer Nurtures 30.4% of Industry Share

Attributes Details
Top Product Type Ethylene Propylene Copolymer (OCP)
Industry Share in 2025 30.4%

OCP is set to hold a 30.4% industry share in 2025 due to augmented applications in multiple industries. Ethylene propylene copolymers are gaining popularity in various industries, including automobile parts, industrial components, and elements, showcasing their versatility and adaptability.

The VII market is shifting towards bio-based OCPs due to sustainability and environmental regulations, corresponding with the increasing demand for eco-friendly materials across various industries. OCP production is being affected by supply chain disruptions, plant shutdowns, and fluctuating crude oil prices, necessitating effective management to maintain industry supply stability.

Manufacturers in Asia Pacific are experiencing significant economic growth, a growing middle-class population, and a thriving automotive industry. This is compelling the demand for ethylene propylene copolymers (OCP).

Vehicle Lubricants cater around 51.6% of VII Market

Demand for vehicle lubricants is augmenting, and it is leading the industry with a share of 51.6% in 2025. Although multi-grade vehicle lubricants may be created without VIIs, VIIs are polymer additives that help bring viscosity variances closer together.

Attributes Details
Top Application Vehicle Lubricants
Industry Share in 2025 51.6%

Vehicle lubricants, typically oil or grease, are essential for various applications, and understanding their functions and functions is vital for effective use. Vehicle lubricants reduce friction, eliminate wear, and transmit power. Common additives include viscosity index improvers, dispersants, and friction modifiers, improving performance and performance.

The automotive industry heavily relies on engine oil as a lubricant. This is leading to increased demand for vehicle lubricants due to rising production and fleet size. Such a trend is desired to boost growth in the future.
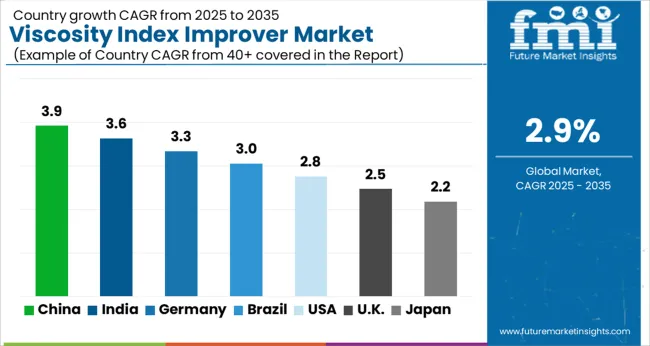
Country-wise Insights

Viscosity Index Improver Market Cagr Analysis By Country

Based on the statistical data, industries in the United States and the United Kingdom are set to develop at a relative pace in the upcoming decade. Simultaneously, the VII industry in China and India is on track to hit the roof. The viscosity improvers sector in Spain is anticipated to climb gradually in the upcoming decade.

United States Offers a Fertile Ground for the Development of Viscosity Improvers

A CAGR of 1.6% is anticipated for the United States viscosity index improver market as the auto sector has been growing steadily. The need for automotive lubricants is foreseen to rise as more people buy commercial vehicles, especially light trucks and pick-up trucks. Hence, the United States is likely to continue to lead the regional industry

The need for lubricant additives such as viscosity index improvers is predicted to rise in response to increasing industrial output, greater exports of chemicals and pharmaceuticals, and developed manufacture of these goods. Future growth in the automotive sector is anticipated to result in higher lubricant usage.
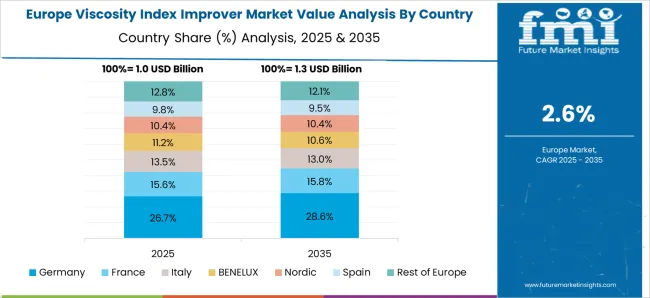
Spain’s Power Manufacturing Cultivates Demand for VII Applications

Viscosity Index Improver Market Europe Country Market Share Analysis, 2025 & 2035

Demand for viscosity improvers in Spain is estimated to develop at a CAGR of 2.2%, with auto manufacturers developing novel applications. VII additives are essential in power generation equipment, including hydraulic and turbine lubricants for specific oils, coal-fired power plants, and greases for wind and hydropower plants in Spain.

Spain's automobile sector is vital for economic growth, with OEMs prioritizing high-margin models like trucks to maintain profitability. This shift is influencing the use of high-performance lubricants in manufacturing processes.

Rising Adoption of Viscous Lubricants in China Boost Sales

China is on the brink of an expansion in the viscosity index improver market, with a projected CAGR of 3.2% from 2025 to 2035. Asia Pacific is experiencing a significant rise in VII industry share due to China's industrialization and infrastructure development. This has resulted in an increased demand for high-strength lubricants.

China dominates the demand for viscosity index improvers due to rising per capita disposable income and a large on-road vehicle fleet in developing economies. These factors make it a leading producer and consumer of these products.

China's urbanization of machinery is anticipated to compel lubricant demand. This is prompted by increased global consumption of viscosity improvers and the adoption of complex machinery.

The United Kingdom’s Manufacturers Fancies the Lubricants

The United Kingdom viscosity index improver market is projected to register a CAGR of 1.1% by 2035. This is due to its bolstering businesses and its demand for industrial lubricants. The country is predicted to experience significant growth in Europe’s industry due to the rise in high-performance engines. This necessitates the use of lubricants with appropriate viscosity, which impacts factors like wear, contamination tolerance, and energy consumption.

Lubricants are utilized in various industries like oil and gas, automotive, metal fabrication, power transmission, chemicals, and manufacturing. United Kingdom industrialization and new sectors are anticipated to compel the growth of viscosity improvers.

Viscosity Index Improvers Industry Prospers in India

Demand for viscosity index improvers in India is foreseen to experience a CAGR of 4.3% from 2025 to 2035. India's rapid economic development and disposable income make it a lucrative souk for the lubricating industry.

India's high lubricating oil consumption is primarily due to the growth of industrial production, commerce, and automobiles. Increasing investments in the industrial sector also contribute to the country's growing demand for lubricating oil.

Government regulations and environmental sustainability policies in India are influencing the industry for lubricating oil additives. This is anticipated to increase demand in the forthcoming decade.

Players Shaping the Outlook of the Viscosity Index Improver Market

New contestants in the industry are innovative disruptors, continuously investing in research and development to provide more convenient solutions to industry verticals despite being new players.

Manufacturers, in response to the increasing demand for viscosity improvers, have strategically shifted their focus to emerging regions in recent years. This move not only meets the demand but also opens up new growth opportunities. Several key players are also focusing on increasing their production capacities, new product launches, research and development, and mergers and acquisitions.

The industry is competitive, with some companies focusing on online sales. Small-scale companies are pivotal players, transforming inputs into outputs and adapting to industry uncertainties. Numerous start-ups are involved in manufacturing and providing related services, contributing to the industry's dynamism. They are also catalysts for growth and expansion in the lubricant additives industry.

Recent Developments in the Viscosity Index Improver Market
  • In July 2025, Chevron Phillips Chemical announced a capacity expansion of its VII productions to meet the increasing demand for VIIs in the automotive and industrial sectors.
  • In April 2025, Lubrizol introduced a new line of viscosity index improvers (VIIs) for automotive lubricants, claiming to offer enhanced performance, including improved oxidation and thermal stability.
  • In March 2025, ABB completed the Marunda 2.0 oil blending plant extension project, doubling production capacity despite challenges during the pandemic within three years.
  • In October 2025, LCY Chemical Corp., a Taiwanese material science company, showcased its thermoplastic elastomer portfolio at K 2025. It highlighted its innovative approach to material science for a sustainable future, backed by a global distribution network.
  • In August 2025, Evonik's Oil Additives division in CIS countries partnered with ADCO, enhancing energy productivity and effectiveness of industrial lubricants for construction, agriculture, mining, and manufacturing equipment.

Key Companies in the Viscosity Index Improver Market

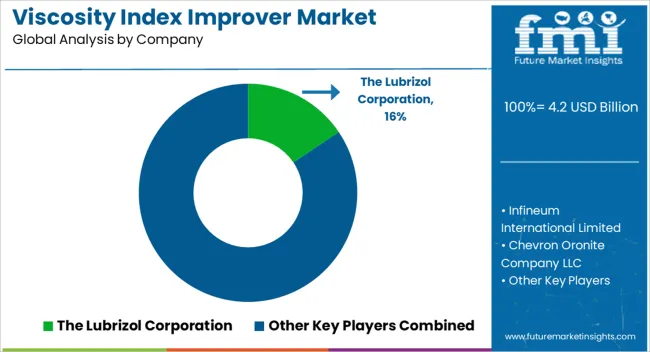
Viscosity Index Improver Market Analysis By Company

  • The Lubrizol Corporation
  • Infineum International Limited
  • Chevron Oronite Company LLC
  • Evonik Industries AG
  • Afton Chemical Corporation
  • BASF SE
  • Sanyo Chemical Industries
  • Croda International Plc
  • Lanxess AG
  • Mitsui Chemicals, Inc.
  • Shenyang Great Wall Lubricating Oil Manufacturing Co., Ltd.
  • BRB (Petronas)
  • BPT Chemicals
  • Nanjing Runyou Chemical Industry Additive Co., Ltd.
  • Jilin Xingyun Chemical Co., Ltd.
  • Jinzhou Kangtai Lubricant Additives Co., Ltd.
  • Paras Lubricants Ltd.
  • Versalis S.p.A.

Key Segments of the Viscosity Index Improver Market

By Product Type:

The industry can be classified into polymethacrylate (PMA), ethylene propylene copolymer (OCP), hydrostyrene diene copolymer (HSD), polyisobutylene (PIB), and others.

By Application:

Viscosity index improvers find applications as vehicle lubricants, industrial lubricants, and transmission fluids.

By Region:

The industry is examined throughout key regions, including North America, Latin America, Europe, East Asia, South Asia, and Oceania, as well as the Middle East and Africa.

Table of Content

  1. Executive Summary
    • Global Market Outlook
    • Demand-side Trends
    • Supply-side Trends
    • Technology Roadmap Analysis
    • Analysis and Recommendations
  2. Market Overview
    • Market Coverage / Taxonomy
    • Market Definition / Scope / Limitations
  3. Market Background
    • Market Dynamics
      • Drivers
      • Restraints
      • Opportunity
      • Trends
    • Scenario Forecast
      • Demand in Optimistic Scenario
      • Demand in Likely Scenario
      • Demand in Conservative Scenario
    • Opportunity Map Analysis
    • Product Life Cycle Analysis
    • Supply Chain Analysis
    • Investment Feasibility Matrix
    • Value Chain Analysis
    • PESTLE and Porter’s Analysis
    • Regulatory Landscape
    • Regional Parent Market Outlook
    • Production and Consumption Statistics
    • Import and Export Statistics
  4. Global Market Analysis 2020 to 2024 and Forecast, 2025 to 2035
    • Historical Market Size Value (USD Million) Analysis, 2020 to 2024
    • Current and Future Market Size Value (USD Million) Projections, 2025 to 2035
      • Y-o-Y Growth Trend Analysis
      • Absolute $ Opportunity Analysis
  5. Global Market Pricing Analysis 2020 to 2024 and Forecast 2025 to 2035
  6. Global Market Analysis 2020 to 2024 and Forecast 2025 to 2035, By Product Type
    • Introduction / Key Findings
    • Historical Market Size Value (USD Million) Analysis By Product Type , 2020 to 2024
    • Current and Future Market Size Value (USD Million) Analysis and Forecast By Product Type , 2025 to 2035
      • Ethylene Propylene Copolymer (OCP)
      • Hydrostyrene Diene Copolymer (HSD)
      • Polyisobutylene (PIB)
      • Others
      • Polymethacrylate (PMA)
    • Y-o-Y Growth Trend Analysis By Product Type , 2020 to 2024
    • Absolute $ Opportunity Analysis By Product Type , 2025 to 2035
  7. Global Market Analysis 2020 to 2024 and Forecast 2025 to 2035, By Application
    • Introduction / Key Findings
    • Historical Market Size Value (USD Million) Analysis By Application, 2020 to 2024
    • Current and Future Market Size Value (USD Million) Analysis and Forecast By Application, 2025 to 2035
      • Vehicle Lubricants
      • Industrial Lubricants
      • Transmission Fluids
    • Y-o-Y Growth Trend Analysis By Application, 2020 to 2024
    • Absolute $ Opportunity Analysis By Application, 2025 to 2035
  8. Global Market Analysis 2020 to 2024 and Forecast 2025 to 2035, By Region
    • Introduction
    • Historical Market Size Value (USD Million) Analysis By Region, 2020 to 2024
    • Current Market Size Value (USD Million) Analysis and Forecast By Region, 2025 to 2035
      • North America
      • Latin America
      • Western Europe
      • Eastern Europe
      • East Asia
      • South Asia and Pacific
      • Middle East & Africa
    • Market Attractiveness Analysis By Region
  9. North America Market Analysis 2020 to 2024 and Forecast 2025 to 2035, By Country
    • Historical Market Size Value (USD Million) Trend Analysis By Market Taxonomy, 2020 to 2024
    • Market Size Value (USD Million) Forecast By Market Taxonomy, 2025 to 2035
      • By Country
        • USA
        • Canada
        • Mexico
      • By Product Type
      • By Application
    • Market Attractiveness Analysis
      • By Country
      • By Product Type
      • By Application
    • Key Takeaways
  10. Latin America Market Analysis 2020 to 2024 and Forecast 2025 to 2035, By Country
    • Historical Market Size Value (USD Million) Trend Analysis By Market Taxonomy, 2020 to 2024
    • Market Size Value (USD Million) Forecast By Market Taxonomy, 2025 to 2035
      • By Country
        • Brazil
        • Chile
        • Rest of Latin America
      • By Product Type
      • By Application
    • Market Attractiveness Analysis
      • By Country
      • By Product Type
      • By Application
    • Key Takeaways
  11. Western Europe Market Analysis 2020 to 2024 and Forecast 2025 to 2035, By Country
    • Historical Market Size Value (USD Million) Trend Analysis By Market Taxonomy, 2020 to 2024
    • Market Size Value (USD Million) Forecast By Market Taxonomy, 2025 to 2035
      • By Country
        • Germany
        • UK
        • Italy
        • Spain
        • France
        • Nordic
        • BENELUX
        • Rest of Western Europe
      • By Product Type
      • By Application
    • Market Attractiveness Analysis
      • By Country
      • By Product Type
      • By Application
    • Key Takeaways
  12. Eastern Europe Market Analysis 2020 to 2024 and Forecast 2025 to 2035, By Country
    • Historical Market Size Value (USD Million) Trend Analysis By Market Taxonomy, 2020 to 2024
    • Market Size Value (USD Million) Forecast By Market Taxonomy, 2025 to 2035
      • By Country
        • Russia
        • Poland
        • Hungary
        • Balkan & Baltic
        • Rest of Eastern Europe
      • By Product Type
      • By Application
    • Market Attractiveness Analysis
      • By Country
      • By Product Type
      • By Application
    • Key Takeaways
  13. East Asia Market Analysis 2020 to 2024 and Forecast 2025 to 2035, By Country
    • Historical Market Size Value (USD Million) Trend Analysis By Market Taxonomy, 2020 to 2024
    • Market Size Value (USD Million) Forecast By Market Taxonomy, 2025 to 2035
      • By Country
        • China
        • Japan
        • South Korea
      • By Product Type
      • By Application
    • Market Attractiveness Analysis
      • By Country
      • By Product Type
      • By Application
    • Key Takeaways
  14. South Asia and Pacific Market Analysis 2020 to 2024 and Forecast 2025 to 2035, By Country
    • Historical Market Size Value (USD Million) Trend Analysis By Market Taxonomy, 2020 to 2024
    • Market Size Value (USD Million) Forecast By Market Taxonomy, 2025 to 2035
      • By Country
        • India
        • ASEAN
        • Australia & New Zealand
        • Rest of South Asia and Pacific
      • By Product Type
      • By Application
    • Market Attractiveness Analysis
      • By Country
      • By Product Type
      • By Application
    • Key Takeaways
  15. Middle East & Africa Market Analysis 2020 to 2024 and Forecast 2025 to 2035, By Country
    • Historical Market Size Value (USD Million) Trend Analysis By Market Taxonomy, 2020 to 2024
    • Market Size Value (USD Million) Forecast By Market Taxonomy, 2025 to 2035
      • By Country
        • Kingdom of Saudi Arabia
        • Other GCC Countries
        • Turkiye
        • South Africa
        • Other African Union
        • Rest of Middle East & Africa
      • By Product Type
      • By Application
    • Market Attractiveness Analysis
      • By Country
      • By Product Type
      • By Application
    • Key Takeaways
  16. Key Countries Market Analysis
    • USA
      • Pricing Analysis
      • Market Share Analysis, 2024
        • By Product Type
        • By Application
    • Canada
      • Pricing Analysis
      • Market Share Analysis, 2024
        • By Product Type
        • By Application
    • Mexico
      • Pricing Analysis
      • Market Share Analysis, 2024
        • By Product Type
        • By Application
    • Brazil
      • Pricing Analysis
      • Market Share Analysis, 2024
        • By Product Type
        • By Application
    • Chile
      • Pricing Analysis
      • Market Share Analysis, 2024
        • By Product Type
        • By Application
    • Germany
      • Pricing Analysis
      • Market Share Analysis, 2024
        • By Product Type
        • By Application
    • UK
      • Pricing Analysis
      • Market Share Analysis, 2024
        • By Product Type
        • By Application
    • Italy
      • Pricing Analysis
      • Market Share Analysis, 2024
        • By Product Type
        • By Application
    • Spain
      • Pricing Analysis
      • Market Share Analysis, 2024
        • By Product Type
        • By Application
    • France
      • Pricing Analysis
      • Market Share Analysis, 2024
        • By Product Type
        • By Application
    • India
      • Pricing Analysis
      • Market Share Analysis, 2024
        • By Product Type
        • By Application
    • ASEAN
      • Pricing Analysis
      • Market Share Analysis, 2024
        • By Product Type
        • By Application
    • Australia & New Zealand
      • Pricing Analysis
      • Market Share Analysis, 2024
        • By Product Type
        • By Application
    • China
      • Pricing Analysis
      • Market Share Analysis, 2024
        • By Product Type
        • By Application
    • Japan
      • Pricing Analysis
      • Market Share Analysis, 2024
        • By Product Type
        • By Application
    • South Korea
      • Pricing Analysis
      • Market Share Analysis, 2024
        • By Product Type
        • By Application
    • Russia
      • Pricing Analysis
      • Market Share Analysis, 2024
        • By Product Type
        • By Application
    • Poland
      • Pricing Analysis
      • Market Share Analysis, 2024
        • By Product Type
        • By Application
    • Hungary
      • Pricing Analysis
      • Market Share Analysis, 2024
        • By Product Type
        • By Application
    • Kingdom of Saudi Arabia
      • Pricing Analysis
      • Market Share Analysis, 2024
        • By Product Type
        • By Application
    • Turkiye
      • Pricing Analysis
      • Market Share Analysis, 2024
        • By Product Type
        • By Application
    • South Africa
      • Pricing Analysis
      • Market Share Analysis, 2024
        • By Product Type
        • By Application
  17. Market Structure Analysis
    • Competition Dashboard
    • Competition Benchmarking
    • Market Share Analysis of Top Players
      • By Regional
      • By Product Type
      • By Application
  18. Competition Analysis
    • Competition Deep Dive
      • The Lubrizol Corporation
        • Overview
        • Product Portfolio
        • Profitability by Market Segments (Product/Age /Sales Channel/Region)
        • Sales Footprint
        • Strategy Overview
          • Marketing Strategy
          • Product Strategy
          • Channel Strategy
      • Infineum International Limited
      • Chevron Oronite Company LLC
      • Evonik Industries AG
      • Afton Chemical Corporation
      • BASF SE
      • Sanyo Chemical Industries
      • Croda International Plc
      • Lanxess AG
      • Mitsui Chemicals, Inc.
      • Shenyang Great Wall Lubricating Oil Manufacturing Co., Ltd.
  19. Assumptions & Acronyms Used
  20. Research Methodology

List of Tables

  • Table 1: Global Market Value (USD Million) Forecast by Region, 2020 to 2035
  • Table 2: Global Market Value (USD Million) Forecast by Product Type , 2020 to 2035
  • Table 3: Global Market Value (USD Million) Forecast by Application, 2020 to 2035
  • Table 4: North America Market Value (USD Million) Forecast by Country, 2020 to 2035
  • Table 5: North America Market Value (USD Million) Forecast by Product Type , 2020 to 2035
  • Table 6: North America Market Value (USD Million) Forecast by Application, 2020 to 2035
  • Table 7: Latin America Market Value (USD Million) Forecast by Country, 2020 to 2035
  • Table 8: Latin America Market Value (USD Million) Forecast by Product Type , 2020 to 2035
  • Table 9: Latin America Market Value (USD Million) Forecast by Application, 2020 to 2035
  • Table 10: Western Europe Market Value (USD Million) Forecast by Country, 2020 to 2035
  • Table 11: Western Europe Market Value (USD Million) Forecast by Product Type , 2020 to 2035
  • Table 12: Western Europe Market Value (USD Million) Forecast by Application, 2020 to 2035
  • Table 13: Eastern Europe Market Value (USD Million) Forecast by Country, 2020 to 2035
  • Table 14: Eastern Europe Market Value (USD Million) Forecast by Product Type , 2020 to 2035
  • Table 15: Eastern Europe Market Value (USD Million) Forecast by Application, 2020 to 2035
  • Table 16: East Asia Market Value (USD Million) Forecast by Country, 2020 to 2035
  • Table 17: East Asia Market Value (USD Million) Forecast by Product Type , 2020 to 2035
  • Table 18: East Asia Market Value (USD Million) Forecast by Application, 2020 to 2035
  • Table 19: South Asia and Pacific Market Value (USD Million) Forecast by Country, 2020 to 2035
  • Table 20: South Asia and Pacific Market Value (USD Million) Forecast by Product Type , 2020 to 2035
  • Table 21: South Asia and Pacific Market Value (USD Million) Forecast by Application, 2020 to 2035
  • Table 22: Middle East & Africa Market Value (USD Million) Forecast by Country, 2020 to 2035
  • Table 23: Middle East & Africa Market Value (USD Million) Forecast by Product Type , 2020 to 2035
  • Table 24: Middle East & Africa Market Value (USD Million) Forecast by Application, 2020 to 2035

List of Figures

  • Figure 1: Global Market Pricing Analysis
  • Figure 2: Global Market Value (USD Million) Forecast 2020-2035
  • Figure 3: Global Market Value Share and BPS Analysis by Product Type , 2025 and 2035
  • Figure 4: Global Market Y-o-Y Growth Comparison by Product Type , 2025-2035
  • Figure 5: Global Market Attractiveness Analysis by Product Type
  • Figure 6: Global Market Value Share and BPS Analysis by Application, 2025 and 2035
  • Figure 7: Global Market Y-o-Y Growth Comparison by Application, 2025-2035
  • Figure 8: Global Market Attractiveness Analysis by Application
  • Figure 9: Global Market Value (USD Million) Share and BPS Analysis by Region, 2025 and 2035
  • Figure 10: Global Market Y-o-Y Growth Comparison by Region, 2025-2035
  • Figure 11: Global Market Attractiveness Analysis by Region
  • Figure 12: North America Market Incremental Dollar Opportunity, 2025-2035
  • Figure 13: Latin America Market Incremental Dollar Opportunity, 2025-2035
  • Figure 14: Western Europe Market Incremental Dollar Opportunity, 2025-2035
  • Figure 15: Eastern Europe Market Incremental Dollar Opportunity, 2025-2035
  • Figure 16: East Asia Market Incremental Dollar Opportunity, 2025-2035
  • Figure 17: South Asia and Pacific Market Incremental Dollar Opportunity, 2025-2035
  • Figure 18: Middle East & Africa Market Incremental Dollar Opportunity, 2025-2035
  • Figure 19: North America Market Value Share and BPS Analysis by Country, 2025 and 2035
  • Figure 20: North America Market Value Share and BPS Analysis by Product Type , 2025 and 2035
  • Figure 21: North America Market Y-o-Y Growth Comparison by Product Type , 2025-2035
  • Figure 22: North America Market Attractiveness Analysis by Product Type
  • Figure 23: North America Market Value Share and BPS Analysis by Application, 2025 and 2035
  • Figure 24: North America Market Y-o-Y Growth Comparison by Application, 2025-2035
  • Figure 25: North America Market Attractiveness Analysis by Application
  • Figure 26: Latin America Market Value Share and BPS Analysis by Country, 2025 and 2035
  • Figure 27: Latin America Market Value Share and BPS Analysis by Product Type , 2025 and 2035
  • Figure 28: Latin America Market Y-o-Y Growth Comparison by Product Type , 2025-2035
  • Figure 29: Latin America Market Attractiveness Analysis by Product Type
  • Figure 30: Latin America Market Value Share and BPS Analysis by Application, 2025 and 2035
  • Figure 31: Latin America Market Y-o-Y Growth Comparison by Application, 2025-2035
  • Figure 32: Latin America Market Attractiveness Analysis by Application
  • Figure 33: Western Europe Market Value Share and BPS Analysis by Country, 2025 and 2035
  • Figure 34: Western Europe Market Value Share and BPS Analysis by Product Type , 2025 and 2035
  • Figure 35: Western Europe Market Y-o-Y Growth Comparison by Product Type , 2025-2035
  • Figure 36: Western Europe Market Attractiveness Analysis by Product Type
  • Figure 37: Western Europe Market Value Share and BPS Analysis by Application, 2025 and 2035
  • Figure 38: Western Europe Market Y-o-Y Growth Comparison by Application, 2025-2035
  • Figure 39: Western Europe Market Attractiveness Analysis by Application
  • Figure 40: Eastern Europe Market Value Share and BPS Analysis by Country, 2025 and 2035
  • Figure 41: Eastern Europe Market Value Share and BPS Analysis by Product Type , 2025 and 2035
  • Figure 42: Eastern Europe Market Y-o-Y Growth Comparison by Product Type , 2025-2035
  • Figure 43: Eastern Europe Market Attractiveness Analysis by Product Type
  • Figure 44: Eastern Europe Market Value Share and BPS Analysis by Application, 2025 and 2035
  • Figure 45: Eastern Europe Market Y-o-Y Growth Comparison by Application, 2025-2035
  • Figure 46: Eastern Europe Market Attractiveness Analysis by Application
  • Figure 47: East Asia Market Value Share and BPS Analysis by Country, 2025 and 2035
  • Figure 48: East Asia Market Value Share and BPS Analysis by Product Type , 2025 and 2035
  • Figure 49: East Asia Market Y-o-Y Growth Comparison by Product Type , 2025-2035
  • Figure 50: East Asia Market Attractiveness Analysis by Product Type
  • Figure 51: East Asia Market Value Share and BPS Analysis by Application, 2025 and 2035
  • Figure 52: East Asia Market Y-o-Y Growth Comparison by Application, 2025-2035
  • Figure 53: East Asia Market Attractiveness Analysis by Application
  • Figure 54: South Asia and Pacific Market Value Share and BPS Analysis by Country, 2025 and 2035
  • Figure 55: South Asia and Pacific Market Value Share and BPS Analysis by Product Type , 2025 and 2035
  • Figure 56: South Asia and Pacific Market Y-o-Y Growth Comparison by Product Type , 2025-2035
  • Figure 57: South Asia and Pacific Market Attractiveness Analysis by Product Type
  • Figure 58: South Asia and Pacific Market Value Share and BPS Analysis by Application, 2025 and 2035
  • Figure 59: South Asia and Pacific Market Y-o-Y Growth Comparison by Application, 2025-2035
  • Figure 60: South Asia and Pacific Market Attractiveness Analysis by Application
  • Figure 61: Middle East & Africa Market Value Share and BPS Analysis by Country, 2025 and 2035
  • Figure 62: Middle East & Africa Market Value Share and BPS Analysis by Product Type , 2025 and 2035
  • Figure 63: Middle East & Africa Market Y-o-Y Growth Comparison by Product Type , 2025-2035
  • Figure 64: Middle East & Africa Market Attractiveness Analysis by Product Type
  • Figure 65: Middle East & Africa Market Value Share and BPS Analysis by Application, 2025 and 2035
  • Figure 66: Middle East & Africa Market Y-o-Y Growth Comparison by Application, 2025-2035
  • Figure 67: Middle East & Africa Market Attractiveness Analysis by Application
  • Figure 68: Global Market - Tier Structure Analysis
  • Figure 69: Global Market - Company Share Analysis

Frequently Asked Questions

How big is the viscosity index improver market in 2025?

The global viscosity index improver market is estimated to be valued at USD 4.2 billion in 2025.

What will be the size of viscosity index improver market in 2035?

The market size for the viscosity index improver market is projected to reach USD 5.6 billion by 2035.

How much will be the viscosity index improver market growth between 2025 and 2035?

The viscosity index improver market is expected to grow at a 2.9% CAGR between 2025 and 2035.

What are the key product types in the viscosity index improver market?

The key product types in viscosity index improver market are ethylene propylene copolymer (ocp), hydrostyrene diene copolymer (hsd), polyisobutylene (pib), others and polymethacrylate (pma).

Which application segment to contribute significant share in the viscosity index improver market in 2025?

In terms of application, vehicle lubricants segment to command 51.6% share in the viscosity index improver market in 2025.

Explore Similar Insights

Future Market Insights

Viscosity Index Improver Market

Chat With MaRIA

Chat With

MaRIA

Hi There, I am MaRIA, Your Market Research Intelligence Assistant. How may I help you?