Viscosity Reducing Agents Market Size and Share Forecast Outlook 2025 to 2035

The Viscosity Reducing Agents Market is estimated to be valued at USD 2.0 billion in 2025 and is projected to reach USD 2.8 billion by 2035, registering a compound annual growth rate (CAGR) of 3.5% over the forecast period.
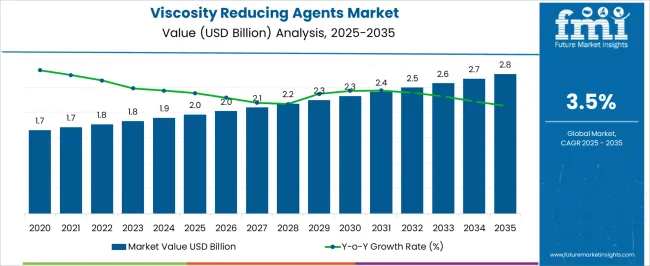
Quick Stats for Viscosity Reducing Agents Market

  • Viscosity Reducing Agents Market Value (2025): USD 2.0 billion
  • Viscosity Reducing Agents Market Forecast Value (2035): USD 2.8 billion
  • Viscosity Reducing Agents Market Forecast CAGR: 3.5%
  • Leading Segment in Viscosity Reducing Agents Market in 2025: Polymers (27.3%)
  • Key Growth Regions in Viscosity Reducing Agents Market: North America, Asia-Pacific, Europe
  • Top Key Players in Viscosity Reducing Agents Market: Henkel, Omya AG, ExxonMobil, Rhodia Group, Lubrizol, Kao Chemicals, Sanyo Chemical Industries, Royal Dutch Shell, Toray Industries, Stepan Company, BASF, Evonik
Viscosity Reducing Agents Market Market Value Analysis

Viscosity Reducing Agents Market Key Takeaways

Metric Value
Viscosity Reducing Agents Market Estimated Value in (2025 E) USD 2.0 billion
Viscosity Reducing Agents Market Forecast Value in (2035 F) USD 2.8 billion
Forecast CAGR (2025 to 2035) 3.5%

Why is the Viscosity Reducing Agents Market Growing?

The viscosity reducing agents market is experiencing consistent growth, driven by the rising demand for efficiency improvements across industries that rely heavily on fluid transportation and processing. Increasing applications in pipelines, refineries, and chemical processing units are creating a strong foundation for expansion. Viscosity reducing agents are being increasingly adopted as they enable smoother transportation of crude oil and heavy liquids by reducing resistance and energy requirements.

This contributes to lowering operational costs and minimizing environmental impact through reduced energy consumption. Growth is also being supported by technological advancements in chemical formulations that provide higher efficiency at lower dosages, making them more cost-effective and sustainable. The market is gaining traction in emerging economies where infrastructure development and energy exploration projects are accelerating.

Growing focus on enhancing flow assurance in oil and gas operations, coupled with the need to meet stringent energy efficiency and emission reduction standards, is expected to further shape demand As industries continue to prioritize operational efficiency and sustainability, viscosity reducing agents are positioned as a critical enabler of long-term growth.

Segmental Analysis

The viscosity reducing agents market is segmented by product type, end-use industry, and geographic regions. By product type, viscosity reducing agents market is divided into Polymers, Surfactants, Dispersants, Additives, and Others. In terms of end-use industry, viscosity reducing agents market is classified into Oil And Gas, Cement And Construction, Paints And Coatings, Rubber, and Others. Regionally, the viscosity reducing agents industry is classified into North America, Latin America, Western Europe, Eastern Europe, Balkan & Baltic Countries, Russia & Belarus, Central Asia, East Asia, South Asia & Pacific, and the Middle East & Africa.
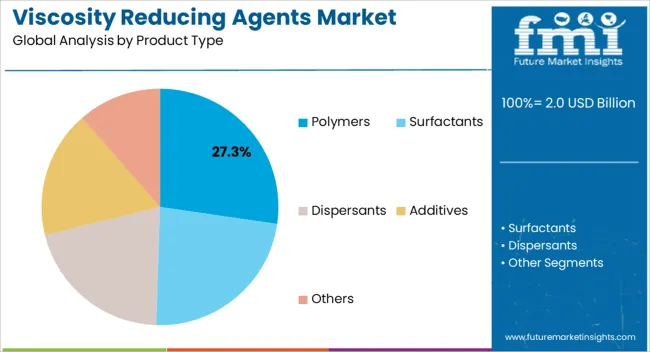
Insights into the Polymers Product Type Segment

Viscosity Reducing Agents Market Analysis By Product Type

The polymers segment is projected to account for 27.3% of the viscosity reducing agents market revenue share in 2025, making it the leading product type. This dominance is being driven by their proven ability to significantly reduce viscosity in a wide range of fluid systems, particularly in oil pipelines and industrial processes. Polymers are favored due to their high molecular weight and capacity to interact effectively with fluid molecules, thereby reducing friction and enabling smoother flow.

The ability to achieve substantial reductions in pumping pressure directly translates into lower energy costs and improved efficiency for operators. Additionally, polymer-based viscosity reducing agents offer versatility, as they can be customized for different types of crude oil, refined products, and industrial liquids.

Advances in polymer chemistry are enabling the development of agents that are more stable under extreme temperature and pressure conditions, further expanding their application scope Growing emphasis on reducing operational costs and ensuring reliable fluid transportation is reinforcing the adoption of polymers, establishing them as the preferred product type in the global market.
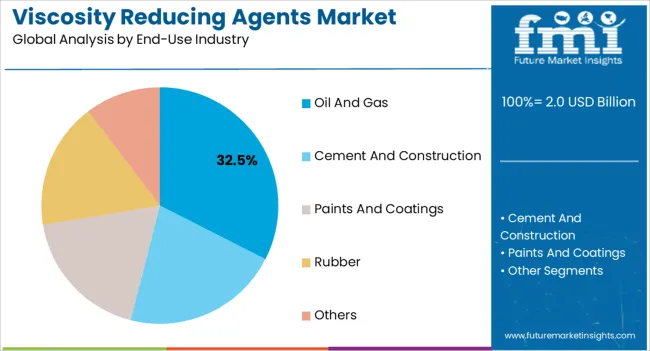
Insights into the Oil and Gas End-Use Industry Segment

Viscosity Reducing Agents Market Analysis By End Use Industry

The oil and gas segment is anticipated to represent 32.5% of the viscosity reducing agents market revenue share in 2025, making it the leading end-use industry. Its dominance is being reinforced by the sector’s reliance on viscosity reducing agents to optimize the transportation of crude oil and refined products through extensive pipeline networks. The ability of these agents to reduce flow resistance allows for higher throughput capacity and lowers the energy intensity of pumping operations, directly impacting cost efficiency.

Increasing exploration and production activities, particularly in unconventional resources and deepwater fields, are driving the demand for advanced solutions that can maintain flow assurance under challenging conditions. Moreover, the industry is under pressure to improve environmental sustainability, and viscosity reducing agents are playing a crucial role in reducing emissions by minimizing energy consumption.

Expanding global trade in oil and petroleum products, coupled with ongoing investments in pipeline infrastructure projects across North America, the Middle East, and Asia-Pacific, is further accelerating adoption As efficiency, safety, and sustainability remain central to oil and gas operations, viscosity reducing agents are expected to remain indispensable in this segment.

Market Overview

Viscosity Reducing Agents Market Overview

Viscosity is basically the resistance offered during the flow of the fluids due to natural presence of internal friction between their particles. Fluid with high viscosity resists the motion as its molecular design offers a significant amount of internal friction. The physical significance of viscosity can be understood by the example of addition of turpentine into paints so that the paints become thinner, less viscous and suitable for further use.In various applications, high viscosity is undesirable as it reduces work efficiency.

The advancements in chemical technology and research & development in this field has led for the emergence of viscosity reducing agents, which can reduce the viscosity of the fluids without changing their chemical properties and effectiveness.

Viscosity reducing agents are also known as the drag reducing agents, the additives that reduce the turbulence and improves the flow of fluids. Viscosity reducing agents are widely used in oil pipelines to improve the flow capacity and thus improving the productivity. They also reduce energy losses in pipelines. On crude oil exploration and production sites, the raw crude oil is highly viscous and thick in nature. The process to pump this heavy crude oil from the source becomes highly energy intensive.

The addition of viscosity reducing agents reduces the viscosity of the crude oil, and in turn, the power requirement for pumping is also reduced. This lead to enhancement of the production efficiency of the plant along with decrease in production costs. Use of viscosity reducing agents also increases the overall operating life of transportation system of oil industries.

The viscosity reducing agents find their utilization across various industries as they reduce the problem of choking in pipelines and ducts and increase the transportation and process efficiency. In addition,the viscosity reducing agents are non-toxic and non-polluting in nature. Apart from their use in chemical and process industries, several test and research studies are being carried on animals if these viscosity reducing agents can be used in arteries and veins to increase the blood flow. The benefits of using viscosity reducing agents, increased pipeline throughput and energy savings, are expected to drive the demand for their market over forecast period 2025-2026.
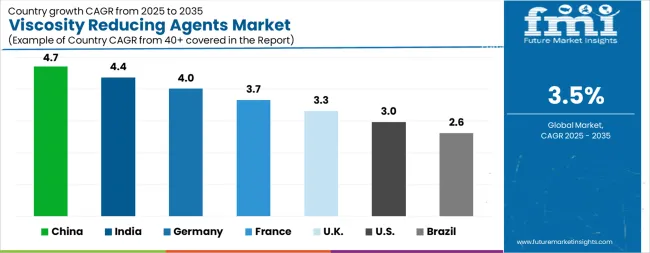
Analysis of Viscosity Reducing Agents Market By Key Countries

Viscosity Reducing Agents Market Cagr Analysis By Country
Country CAGR
China 4.7%
India 4.4%
Germany 4.0%
France 3.7%
UK 3.3%
USA 3.0%
Brazil 2.6%

Country-wise Analysis

The Viscosity Reducing Agents Market is expected to register a CAGR of 3.5% during the forecast period, exhibiting varied country level momentum. China leads with the highest CAGR of 4.7%, followed by India at 4.4%. Developed markets such as Germany, France, and the UK continue to expand steadily, while the USA is likely to grow at consistent rates. Brazil posts the lowest CAGR at 2.6%, yet still underscores a broadly positive trajectory for the global Viscosity Reducing Agents Market. In 2024, Germany held a dominant revenue in the Western Europe market and is expected to grow with a CAGR of 4.0%. The USA Viscosity Reducing Agents Market is estimated to be valued at USD 705.1 million in 2025 and is anticipated to reach a valuation of USD 944.5 million by 2035. Sales are projected to rise at a CAGR of 3.0% over the forecast period between 2025 and 2035. While Japan and South Korea markets are estimated to be valued at USD 97.6 million and USD 67.8 million respectively in 2025.
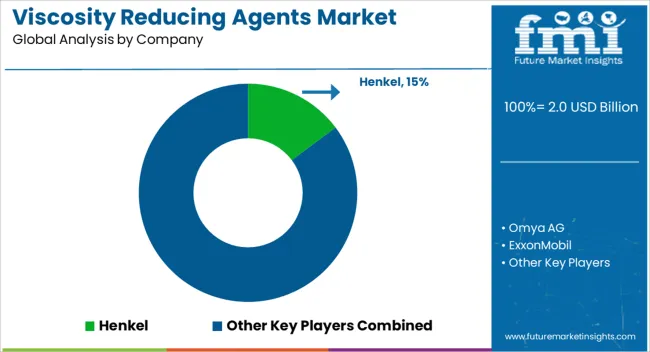
Key Players in the Viscosity Reducing Agents Market

Viscosity Reducing Agents Market Analysis By Company

  • Henkel
  • Omya AG
  • ExxonMobil
  • Rhodia Group
  • Lubrizol
  • Kao Chemicals
  • Sanyo Chemical Industries
  • Royal Dutch Shell
  • Toray Industries
  • Stepan Company
  • BASF
  • Evonik

Scope of the Report

Item Value
Quantitative Units USD 2.0 Billion
Product Type Polymers, Surfactants, Dispersants, Additives, and Others
End-Use Industry Oil And Gas, Cement And Construction, Paints And Coatings, Rubber, and Others
Regions Covered North America, Europe, Asia-Pacific, Latin America, Middle East & Africa
Country Covered United States, Canada, Germany, France, United Kingdom, China, Japan, India, Brazil, South Africa
Key Companies Profiled Henkel, Omya AG, ExxonMobil, Rhodia Group, Lubrizol, Kao Chemicals, Sanyo Chemical Industries, Royal Dutch Shell, Toray Industries, Stepan Company, BASF, and Evonik

Viscosity Reducing Agents Market by Segments

Product Type:

  • Polymers
  • Surfactants
  • Dispersants
  • Additives
  • Others

End-Use Industry:

  • Oil And Gas
  • Cement And Construction
  • Paints And Coatings
  • Rubber
  • Others

Region:

  • North America
    • USA
    • Canada
    • Mexico
  • Latin America
    • Brazil
    • Chile
    • Rest of Latin America
  • Western Europe
    • Germany
    • UK
    • Italy
    • Spain
    • France
    • Nordic
    • BENELUX
    • Rest of Western Europe
  • Eastern Europe
    • Russia
    • Poland
    • Hungary
    • Balkan & Baltic
    • Rest of Eastern Europe
  • East Asia
    • China
    • Japan
    • South Korea
  • South Asia and Pacific
    • India
    • ASEAN
    • Australia & New Zealand
    • Rest of South Asia and Pacific
  • Middle East & Africa
    • Kingdom of Saudi Arabia
    • Other GCC Countries
    • Turkiye
    • South Africa
    • Other African Union
    • Rest of Middle East & Africa

Table of Content

  1. Executive Summary
    • Global Market Outlook
    • Demand-side Trends
    • Supply-side Trends
    • Technology Roadmap Analysis
    • Analysis and Recommendations
  2. Market Overview
    • Market Coverage / Taxonomy
    • Market Definition / Scope / Limitations
  3. Market Background
    • Market Dynamics
      • Drivers
      • Restraints
      • Opportunity
      • Trends
    • Scenario Forecast
      • Demand in Optimistic Scenario
      • Demand in Likely Scenario
      • Demand in Conservative Scenario
    • Opportunity Map Analysis
    • Product Life Cycle Analysis
    • Supply Chain Analysis
    • Investment Feasibility Matrix
    • Value Chain Analysis
    • PESTLE and Porter’s Analysis
    • Regulatory Landscape
    • Regional Parent Market Outlook
    • Production and Consumption Statistics
    • Import and Export Statistics
  4. Global Market Analysis 2020 to 2024 and Forecast, 2025 to 2035
    • Historical Market Size Value (USD Million) Analysis, 2020 to 2024
    • Current and Future Market Size Value (USD Million) Projections, 2025 to 2035
      • Y-o-Y Growth Trend Analysis
      • Absolute $ Opportunity Analysis
  5. Global Market Pricing Analysis 2020 to 2024 and Forecast 2025 to 2035
  6. Global Market Analysis 2020 to 2024 and Forecast 2025 to 2035, By Product Type
    • Introduction / Key Findings
    • Historical Market Size Value (USD Million) Analysis By Product Type , 2020 to 2024
    • Current and Future Market Size Value (USD Million) Analysis and Forecast By Product Type , 2025 to 2035
      • Polymers
      • Surfactants
      • Dispersants
      • Additives
      • Others
    • Y-o-Y Growth Trend Analysis By Product Type , 2020 to 2024
    • Absolute $ Opportunity Analysis By Product Type , 2025 to 2035
  7. Global Market Analysis 2020 to 2024 and Forecast 2025 to 2035, By End-Use Industry
    • Introduction / Key Findings
    • Historical Market Size Value (USD Million) Analysis By End-Use Industry, 2020 to 2024
    • Current and Future Market Size Value (USD Million) Analysis and Forecast By End-Use Industry, 2025 to 2035
      • Oil And Gas
      • Cement And Construction
      • Paints And Coatings
      • Rubber
      • Others
    • Y-o-Y Growth Trend Analysis By End-Use Industry, 2020 to 2024
    • Absolute $ Opportunity Analysis By End-Use Industry, 2025 to 2035
  8. Global Market Analysis 2020 to 2024 and Forecast 2025 to 2035, By Region
    • Introduction
    • Historical Market Size Value (USD Million) Analysis By Region, 2020 to 2024
    • Current Market Size Value (USD Million) Analysis and Forecast By Region, 2025 to 2035
      • North America
      • Latin America
      • Western Europe
      • Eastern Europe
      • East Asia
      • South Asia and Pacific
      • Middle East & Africa
    • Market Attractiveness Analysis By Region
  9. North America Market Analysis 2020 to 2024 and Forecast 2025 to 2035, By Country
    • Historical Market Size Value (USD Million) Trend Analysis By Market Taxonomy, 2020 to 2024
    • Market Size Value (USD Million) Forecast By Market Taxonomy, 2025 to 2035
      • By Country
        • USA
        • Canada
        • Mexico
      • By Product Type
      • By End-Use Industry
    • Market Attractiveness Analysis
      • By Country
      • By Product Type
      • By End-Use Industry
    • Key Takeaways
  10. Latin America Market Analysis 2020 to 2024 and Forecast 2025 to 2035, By Country
    • Historical Market Size Value (USD Million) Trend Analysis By Market Taxonomy, 2020 to 2024
    • Market Size Value (USD Million) Forecast By Market Taxonomy, 2025 to 2035
      • By Country
        • Brazil
        • Chile
        • Rest of Latin America
      • By Product Type
      • By End-Use Industry
    • Market Attractiveness Analysis
      • By Country
      • By Product Type
      • By End-Use Industry
    • Key Takeaways
  11. Western Europe Market Analysis 2020 to 2024 and Forecast 2025 to 2035, By Country
    • Historical Market Size Value (USD Million) Trend Analysis By Market Taxonomy, 2020 to 2024
    • Market Size Value (USD Million) Forecast By Market Taxonomy, 2025 to 2035
      • By Country
        • Germany
        • UK
        • Italy
        • Spain
        • France
        • Nordic
        • BENELUX
        • Rest of Western Europe
      • By Product Type
      • By End-Use Industry
    • Market Attractiveness Analysis
      • By Country
      • By Product Type
      • By End-Use Industry
    • Key Takeaways
  12. Eastern Europe Market Analysis 2020 to 2024 and Forecast 2025 to 2035, By Country
    • Historical Market Size Value (USD Million) Trend Analysis By Market Taxonomy, 2020 to 2024
    • Market Size Value (USD Million) Forecast By Market Taxonomy, 2025 to 2035
      • By Country
        • Russia
        • Poland
        • Hungary
        • Balkan & Baltic
        • Rest of Eastern Europe
      • By Product Type
      • By End-Use Industry
    • Market Attractiveness Analysis
      • By Country
      • By Product Type
      • By End-Use Industry
    • Key Takeaways
  13. East Asia Market Analysis 2020 to 2024 and Forecast 2025 to 2035, By Country
    • Historical Market Size Value (USD Million) Trend Analysis By Market Taxonomy, 2020 to 2024
    • Market Size Value (USD Million) Forecast By Market Taxonomy, 2025 to 2035
      • By Country
        • China
        • Japan
        • South Korea
      • By Product Type
      • By End-Use Industry
    • Market Attractiveness Analysis
      • By Country
      • By Product Type
      • By End-Use Industry
    • Key Takeaways
  14. South Asia and Pacific Market Analysis 2020 to 2024 and Forecast 2025 to 2035, By Country
    • Historical Market Size Value (USD Million) Trend Analysis By Market Taxonomy, 2020 to 2024
    • Market Size Value (USD Million) Forecast By Market Taxonomy, 2025 to 2035
      • By Country
        • India
        • ASEAN
        • Australia & New Zealand
        • Rest of South Asia and Pacific
      • By Product Type
      • By End-Use Industry
    • Market Attractiveness Analysis
      • By Country
      • By Product Type
      • By End-Use Industry
    • Key Takeaways
  15. Middle East & Africa Market Analysis 2020 to 2024 and Forecast 2025 to 2035, By Country
    • Historical Market Size Value (USD Million) Trend Analysis By Market Taxonomy, 2020 to 2024
    • Market Size Value (USD Million) Forecast By Market Taxonomy, 2025 to 2035
      • By Country
        • Kingdom of Saudi Arabia
        • Other GCC Countries
        • Turkiye
        • South Africa
        • Other African Union
        • Rest of Middle East & Africa
      • By Product Type
      • By End-Use Industry
    • Market Attractiveness Analysis
      • By Country
      • By Product Type
      • By End-Use Industry
    • Key Takeaways
  16. Key Countries Market Analysis
    • USA
      • Pricing Analysis
      • Market Share Analysis, 2024
        • By Product Type
        • By End-Use Industry
    • Canada
      • Pricing Analysis
      • Market Share Analysis, 2024
        • By Product Type
        • By End-Use Industry
    • Mexico
      • Pricing Analysis
      • Market Share Analysis, 2024
        • By Product Type
        • By End-Use Industry
    • Brazil
      • Pricing Analysis
      • Market Share Analysis, 2024
        • By Product Type
        • By End-Use Industry
    • Chile
      • Pricing Analysis
      • Market Share Analysis, 2024
        • By Product Type
        • By End-Use Industry
    • Germany
      • Pricing Analysis
      • Market Share Analysis, 2024
        • By Product Type
        • By End-Use Industry
    • UK
      • Pricing Analysis
      • Market Share Analysis, 2024
        • By Product Type
        • By End-Use Industry
    • Italy
      • Pricing Analysis
      • Market Share Analysis, 2024
        • By Product Type
        • By End-Use Industry
    • Spain
      • Pricing Analysis
      • Market Share Analysis, 2024
        • By Product Type
        • By End-Use Industry
    • France
      • Pricing Analysis
      • Market Share Analysis, 2024
        • By Product Type
        • By End-Use Industry
    • India
      • Pricing Analysis
      • Market Share Analysis, 2024
        • By Product Type
        • By End-Use Industry
    • ASEAN
      • Pricing Analysis
      • Market Share Analysis, 2024
        • By Product Type
        • By End-Use Industry
    • Australia & New Zealand
      • Pricing Analysis
      • Market Share Analysis, 2024
        • By Product Type
        • By End-Use Industry
    • China
      • Pricing Analysis
      • Market Share Analysis, 2024
        • By Product Type
        • By End-Use Industry
    • Japan
      • Pricing Analysis
      • Market Share Analysis, 2024
        • By Product Type
        • By End-Use Industry
    • South Korea
      • Pricing Analysis
      • Market Share Analysis, 2024
        • By Product Type
        • By End-Use Industry
    • Russia
      • Pricing Analysis
      • Market Share Analysis, 2024
        • By Product Type
        • By End-Use Industry
    • Poland
      • Pricing Analysis
      • Market Share Analysis, 2024
        • By Product Type
        • By End-Use Industry
    • Hungary
      • Pricing Analysis
      • Market Share Analysis, 2024
        • By Product Type
        • By End-Use Industry
    • Kingdom of Saudi Arabia
      • Pricing Analysis
      • Market Share Analysis, 2024
        • By Product Type
        • By End-Use Industry
    • Turkiye
      • Pricing Analysis
      • Market Share Analysis, 2024
        • By Product Type
        • By End-Use Industry
    • South Africa
      • Pricing Analysis
      • Market Share Analysis, 2024
        • By Product Type
        • By End-Use Industry
  17. Market Structure Analysis
    • Competition Dashboard
    • Competition Benchmarking
    • Market Share Analysis of Top Players
      • By Regional
      • By Product Type
      • By End-Use Industry
  18. Competition Analysis
    • Competition Deep Dive
      • Henkel
        • Overview
        • Product Portfolio
        • Profitability by Market Segments (Product/Age /Sales Channel/Region)
        • Sales Footprint
        • Strategy Overview
          • Marketing Strategy
          • Product Strategy
          • Channel Strategy
      • Omya AG
      • ExxonMobil
      • Rhodia Group
      • Lubrizol
      • Kao Chemicals
      • Sanyo Chemical Industries
      • Royal Dutch Shell
      • Toray Industries
      • Stepan Company
      • BASF
      • Evonik
  19. Assumptions & Acronyms Used
  20. Research Methodology

List of Tables

  • Table 1: Global Market Value (USD Million) Forecast by Region, 2020-2035
  • Table 2: Global Market Value (USD Million) Forecast by Product Type , 2020-2035
  • Table 3: Global Market Value (USD Million) Forecast by End-Use Industry, 2020-2035
  • Table 4: North America Market Value (USD Million) Forecast by Country, 2020-2035
  • Table 5: North America Market Value (USD Million) Forecast by Product Type , 2020-2035
  • Table 6: North America Market Value (USD Million) Forecast by End-Use Industry, 2020-2035
  • Table 7: Latin America Market Value (USD Million) Forecast by Country, 2020-2035
  • Table 8: Latin America Market Value (USD Million) Forecast by Product Type , 2020-2035
  • Table 9: Latin America Market Value (USD Million) Forecast by End-Use Industry, 2020-2035
  • Table 10: Western Europe Market Value (USD Million) Forecast by Country, 2020-2035
  • Table 11: Western Europe Market Value (USD Million) Forecast by Product Type , 2020-2035
  • Table 12: Western Europe Market Value (USD Million) Forecast by End-Use Industry, 2020-2035
  • Table 13: Eastern Europe Market Value (USD Million) Forecast by Country, 2020-2035
  • Table 14: Eastern Europe Market Value (USD Million) Forecast by Product Type , 2020-2035
  • Table 15: Eastern Europe Market Value (USD Million) Forecast by End-Use Industry, 2020-2035
  • Table 16: East Asia Market Value (USD Million) Forecast by Country, 2020-2035
  • Table 17: East Asia Market Value (USD Million) Forecast by Product Type , 2020-2035
  • Table 18: East Asia Market Value (USD Million) Forecast by End-Use Industry, 2020-2035
  • Table 19: South Asia and Pacific Market Value (USD Million) Forecast by Country, 2020-2035
  • Table 20: South Asia and Pacific Market Value (USD Million) Forecast by Product Type , 2020-2035
  • Table 21: South Asia and Pacific Market Value (USD Million) Forecast by End-Use Industry, 2020-2035
  • Table 22: Middle East & Africa Market Value (USD Million) Forecast by Country, 2020-2035
  • Table 23: Middle East & Africa Market Value (USD Million) Forecast by Product Type , 2020-2035
  • Table 24: Middle East & Africa Market Value (USD Million) Forecast by End-Use Industry, 2020-2035

List of Figures

  • Figure 1: Global Market Pricing Analysis
  • Figure 2: Global Market Value (USD Million) Forecast 2020-2035
  • Figure 3: Global Market Value Share and BPS Analysis by Product Type , 2025 and 2035
  • Figure 4: Global Market Y-o-Y Growth Comparison by Product Type , 2025-2035
  • Figure 5: Global Market Attractiveness Analysis by Product Type
  • Figure 6: Global Market Value Share and BPS Analysis by End-Use Industry, 2025 and 2035
  • Figure 7: Global Market Y-o-Y Growth Comparison by End-Use Industry, 2025-2035
  • Figure 8: Global Market Attractiveness Analysis by End-Use Industry
  • Figure 9: Global Market Value (USD Million) Share and BPS Analysis by Region, 2025 and 2035
  • Figure 10: Global Market Y-o-Y Growth Comparison by Region, 2025-2035
  • Figure 11: Global Market Attractiveness Analysis by Region
  • Figure 12: North America Market Incremental Dollar Opportunity, 2025-2035
  • Figure 13: Latin America Market Incremental Dollar Opportunity, 2025-2035
  • Figure 14: Western Europe Market Incremental Dollar Opportunity, 2025-2035
  • Figure 15: Eastern Europe Market Incremental Dollar Opportunity, 2025-2035
  • Figure 16: East Asia Market Incremental Dollar Opportunity, 2025-2035
  • Figure 17: South Asia and Pacific Market Incremental Dollar Opportunity, 2025-2035
  • Figure 18: Middle East & Africa Market Incremental Dollar Opportunity, 2025-2035
  • Figure 19: North America Market Value Share and BPS Analysis by Country, 2025 and 2035
  • Figure 20: North America Market Value Share and BPS Analysis by Product Type , 2025 and 2035
  • Figure 21: North America Market Y-o-Y Growth Comparison by Product Type , 2025-2035
  • Figure 22: North America Market Attractiveness Analysis by Product Type
  • Figure 23: North America Market Value Share and BPS Analysis by End-Use Industry, 2025 and 2035
  • Figure 24: North America Market Y-o-Y Growth Comparison by End-Use Industry, 2025-2035
  • Figure 25: North America Market Attractiveness Analysis by End-Use Industry
  • Figure 26: Latin America Market Value Share and BPS Analysis by Country, 2025 and 2035
  • Figure 27: Latin America Market Value Share and BPS Analysis by Product Type , 2025 and 2035
  • Figure 28: Latin America Market Y-o-Y Growth Comparison by Product Type , 2025-2035
  • Figure 29: Latin America Market Attractiveness Analysis by Product Type
  • Figure 30: Latin America Market Value Share and BPS Analysis by End-Use Industry, 2025 and 2035
  • Figure 31: Latin America Market Y-o-Y Growth Comparison by End-Use Industry, 2025-2035
  • Figure 32: Latin America Market Attractiveness Analysis by End-Use Industry
  • Figure 33: Western Europe Market Value Share and BPS Analysis by Country, 2025 and 2035
  • Figure 34: Western Europe Market Value Share and BPS Analysis by Product Type , 2025 and 2035
  • Figure 35: Western Europe Market Y-o-Y Growth Comparison by Product Type , 2025-2035
  • Figure 36: Western Europe Market Attractiveness Analysis by Product Type
  • Figure 37: Western Europe Market Value Share and BPS Analysis by End-Use Industry, 2025 and 2035
  • Figure 38: Western Europe Market Y-o-Y Growth Comparison by End-Use Industry, 2025-2035
  • Figure 39: Western Europe Market Attractiveness Analysis by End-Use Industry
  • Figure 40: Eastern Europe Market Value Share and BPS Analysis by Country, 2025 and 2035
  • Figure 41: Eastern Europe Market Value Share and BPS Analysis by Product Type , 2025 and 2035
  • Figure 42: Eastern Europe Market Y-o-Y Growth Comparison by Product Type , 2025-2035
  • Figure 43: Eastern Europe Market Attractiveness Analysis by Product Type
  • Figure 44: Eastern Europe Market Value Share and BPS Analysis by End-Use Industry, 2025 and 2035
  • Figure 45: Eastern Europe Market Y-o-Y Growth Comparison by End-Use Industry, 2025-2035
  • Figure 46: Eastern Europe Market Attractiveness Analysis by End-Use Industry
  • Figure 47: East Asia Market Value Share and BPS Analysis by Country, 2025 and 2035
  • Figure 48: East Asia Market Value Share and BPS Analysis by Product Type , 2025 and 2035
  • Figure 49: East Asia Market Y-o-Y Growth Comparison by Product Type , 2025-2035
  • Figure 50: East Asia Market Attractiveness Analysis by Product Type
  • Figure 51: East Asia Market Value Share and BPS Analysis by End-Use Industry, 2025 and 2035
  • Figure 52: East Asia Market Y-o-Y Growth Comparison by End-Use Industry, 2025-2035
  • Figure 53: East Asia Market Attractiveness Analysis by End-Use Industry
  • Figure 54: South Asia and Pacific Market Value Share and BPS Analysis by Country, 2025 and 2035
  • Figure 55: South Asia and Pacific Market Value Share and BPS Analysis by Product Type , 2025 and 2035
  • Figure 56: South Asia and Pacific Market Y-o-Y Growth Comparison by Product Type , 2025-2035
  • Figure 57: South Asia and Pacific Market Attractiveness Analysis by Product Type
  • Figure 58: South Asia and Pacific Market Value Share and BPS Analysis by End-Use Industry, 2025 and 2035
  • Figure 59: South Asia and Pacific Market Y-o-Y Growth Comparison by End-Use Industry, 2025-2035
  • Figure 60: South Asia and Pacific Market Attractiveness Analysis by End-Use Industry
  • Figure 61: Middle East & Africa Market Value Share and BPS Analysis by Country, 2025 and 2035
  • Figure 62: Middle East & Africa Market Value Share and BPS Analysis by Product Type , 2025 and 2035
  • Figure 63: Middle East & Africa Market Y-o-Y Growth Comparison by Product Type , 2025-2035
  • Figure 64: Middle East & Africa Market Attractiveness Analysis by Product Type
  • Figure 65: Middle East & Africa Market Value Share and BPS Analysis by End-Use Industry, 2025 and 2035
  • Figure 66: Middle East & Africa Market Y-o-Y Growth Comparison by End-Use Industry, 2025-2035
  • Figure 67: Middle East & Africa Market Attractiveness Analysis by End-Use Industry
  • Figure 68: Global Market - Tier Structure Analysis
  • Figure 69: Global Market - Company Share Analysis

Frequently Asked Questions

How big is the viscosity reducing agents market in 2025?

The global viscosity reducing agents market is estimated to be valued at USD 2.0 billion in 2025.

What will be the size of viscosity reducing agents market in 2035?

The market size for the viscosity reducing agents market is projected to reach USD 2.8 billion by 2035.

How much will be the viscosity reducing agents market growth between 2025 and 2035?

The viscosity reducing agents market is expected to grow at a 3.5% CAGR between 2025 and 2035.

What are the key product types in the viscosity reducing agents market?

The key product types in viscosity reducing agents market are polymers, surfactants, dispersants, additives and others.

Which end-use industry segment to contribute significant share in the viscosity reducing agents market in 2025?

In terms of end-use industry, oil and gas segment to command 32.5% share in the viscosity reducing agents market in 2025.

Explore Similar Insights

Future Market Insights

Viscosity Reducing Agents Market

Chat With

MaRIA

Hi There, I am MaRIA, Your Market Research Intelligence Assistant. How may I help you?