Methodology

Reducing Tee Connector Market Forecast and Outlook 2025 to 2035

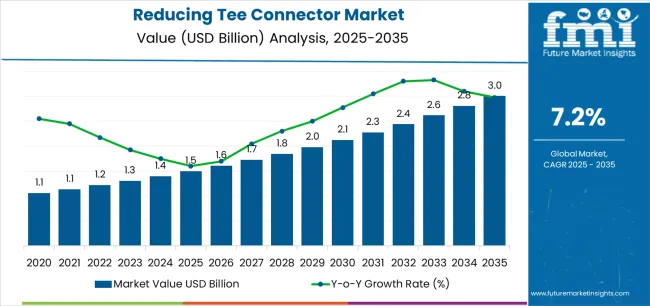
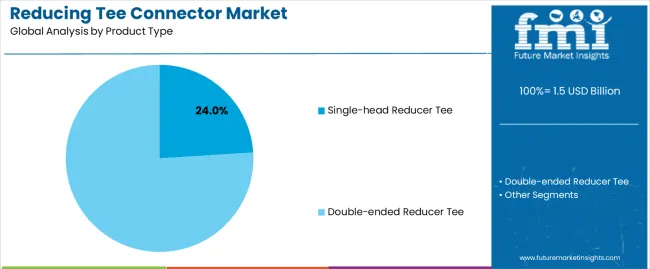
The reducing tee connector market is expected to expand from USD 1.5 billion in 2025 to USD 2.9 billion by 2035, at a CAGR of 7.2%, with the majority of structural growth driven by performance differences across product types and application segments. The single-head reducer tee segment, with a 24% share, is the backbone of global installations due to its suitability for standard branch connections that require a single-diameter transition. Contractors prefer this configuration for its availability across common pressure classes, its compatibility with diverse piping materials, and its ability to maintain predictable flow characteristics without complicating system layout. Its dominance is reinforced by widespread use in municipal distribution networks, commercial buildings, and industrial process lines, where single-point branching forms the most common engineering pattern.

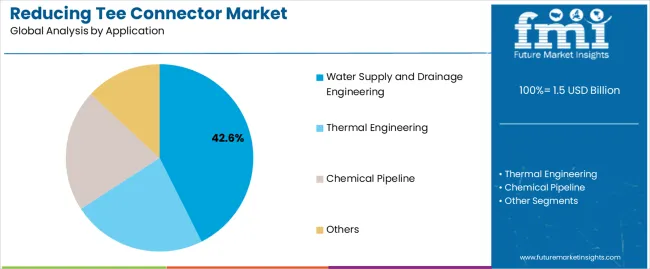
The double-ended reducer tee segment serves more complex piping geometries requiring two-step diameter transitions or differential branching. Although smaller in share, this segment remains critical in space-restricted systems, thermal engineering loops, and specialized chemical pipelines where multi-directional reduction supports compact installation and pressure-balancing requirements. Across applications, water supply and drainage engineering, with a 42.6% share, leads global demand due to extensive utilization in municipal grids, utility upgrades, irrigation channels, and high-volume building plumbing systems. The fitting’s ability to handle service line takeoffs, accommodate diameter changes, and maintain distribution efficiency reinforces its role as a core component of water infrastructure. Thermal engineering, chemical pipelines, and industrial utility networks follow as process-intensive facilities adopt standardized reducing tee configurations to simplify design, minimize fabrication steps, and improve installation certainty across large-scale piping environments.
Quick Stats for Reducing Tee Connector Market

  • Reducing Tee Connector Market Value (2025): USD 1.5 billion
  • Reducing Tee Connector Market Forecast Value (2035): USD 2.9 billion
  • Reducing Tee Connector Market Forecast CAGR: 7.2%
  • Leading Product Type in Reducing Tee Connector Market: Single-head Reducer Tee
  • Key Growth Regions in Reducing Tee Connector Market: East Asia, South Asia, and Europe
  • Key Players in Reducing Tee Connector Market: Injectech, The Metal Company, Seelye Acquisitions, Tefen, Newport, Business Key

Reducing Tee Connector Market Market Value Analysis

From 2030 to 2035, the market is forecast to grow from USD 1.9 billion to USD 2.9 billion, adding another USD 1.0 billion, which constitutes 69.0% of the overall ten-year expansion. This period is expected to be characterized by the expansion of industrial automation requiring sophisticated process piping systems, the development of corrosion-resistant materials extending fitting service life in aggressive environments, and the growth of modular piping systems incorporating standardized components for rapid installation. The growing adoption of building information modeling and digital fabrication technologies will drive demand for reducing tee connectors with enhanced dimensional accuracy and comprehensive technical documentation.

Between 2020 and 2025, the reducing tee connector market experienced steady growth, driven by increasing recognition of reducing tee fittings as essential components in space-constrained piping layouts and growing acceptance of standardized pipe fittings as cost-effective solutions for complex piping configurations requiring diameter transitions and branch connections. The market developed as piping engineers and system designers recognized the potential for reducing tee technology to eliminate multiple fittings, simplify installation procedures, and optimize material costs while maintaining pressure ratings and flow characteristics. Technological advancement in manufacturing processes and material science began emphasizing the critical importance of maintaining dimensional tolerances and ensuring leak-free connections in demanding industrial and municipal applications.

Reducing Tee Connector Market Key Takeaways

Metric Value
Estimated Value in (2025E) USD 1.5 billion
Forecast Value in (2035F) USD 2.9 billion
Forecast CAGR (2025 to 2035) 7.2%

Why is the Reducing Tee Connector Market Growing?

Market expansion is being supported by the increasing global infrastructure investment driven by urbanization trends and aging facility replacement requirements, alongside the corresponding need for efficient pipe fittings that can enable diameter transitions at branch connections, optimize space utilization in congested installations, and reduce material costs across various municipal water systems, industrial process piping, HVAC distribution, and chemical plant applications. Modern piping engineers and system designers are increasingly focused on implementing reducing tee connector solutions that can simplify piping layouts, minimize welding requirements, and ensure reliable performance in diverse operating conditions.

The growing emphasis on installation efficiency and project cost optimization is driving demand for standardized reducing tee fittings that can eliminate custom fabrication, reduce labor requirements, and ensure consistent quality through factory-manufactured components meeting industry standards. Contractors' preference for versatile fittings that combine diameter reduction and branch connection functionality within single components is creating opportunities for innovative reducing tee implementations. The rising influence of modular construction methods and prefabricated piping assemblies is also contributing to increased adoption of reducing tee connectors that can accelerate installation schedules without compromising system performance or regulatory compliance.

What is the Segmental Analysis of the Reducing Elbow Connector Market?

The market is segmented by product type, application, and region. By product type, the market is divided into single-head reducer tee and double-ended reducer tee. Based on application, the market is categorized into water supply and drainage engineering, thermal engineering, chemical pipeline, and others. Regionally, the market is divided into East Asia, Europe, North America, South Asia, Latin America, Middle East & Africa, and Eastern Europe.
By Product Type, the Single-head Reducer Tee Segment Leads the Market

Reducing Tee Connector Market Analysis By Product Type

The single-head reducer tee segment is projected to maintain its leading position in the reducing tee connector market in 2025 with a 24.0% market share, reaffirming its role as the preferred product configuration for standard branch connections requiring single diameter reduction at one outlet position. Piping contractors and system designers increasingly utilize single-head reducer tees for their straightforward application in common branching scenarios, cost-effective pricing compared to double-reduction alternatives, and proven effectiveness in maintaining flow characteristics while accommodating equipment connections of different sizes. Single-head reducer tee technology's proven effectiveness and application versatility directly address the piping requirements for typical branch configurations and standard equipment connections across diverse industrial and commercial installations.

This product segment forms the foundation of conventional piping system design, as it represents the fitting type with the greatest utilization frequency and established availability across multiple material specifications and pressure ratings. Construction industry investments in standardized components and efficient installation methods continue to strengthen adoption among contractors and facility owners. With piping systems predominantly requiring single diameter transitions at branch points and procurement practices favoring readily available standard components, single-head reducer tees align with both technical requirements and supply chain efficiency objectives, making them the central component of comprehensive pipe fitting inventories.
By Application, the Water Supply and Drainage Engineering Segment Dominates Market Demand

Reducing Tee Connector Market Analysis By Application

The water supply and drainage engineering application segment is projected to represent the largest share of reducing tee connector demand in 2025 with a 42.6% market share, underscoring its critical role as the primary driver for reducing tee adoption across municipal water distribution, wastewater collection, building plumbing, and irrigation systems requiring branch connections with diameter transitions. Water system engineers prefer reducing tee connectors for municipal and building applications due to their ability to accommodate service line connections, optimize main line sizing, and ensure code-compliant installations while supporting efficient flow distribution and pressure maintenance. Positioned as standard components for water infrastructure construction, reducing tee connectors offer both functional versatility and installation efficiency benefits.

The segment is supported by continuous growth in urban water infrastructure investment and the expanding requirements for building plumbing systems serving increasingly complex commercial and residential developments. Additionally, water utilities and building owners are investing in comprehensive infrastructure renewal programs replacing aging water mains and upgrading distribution systems with modern materials and fittings. As urban populations expand globally and water conservation regulations drive system optimization, the water supply and drainage engineering application will continue to dominate the market while supporting infrastructure modernization and sustainable water management strategies.

What are the Drivers, Restraints, and Key Trends of the Reducing Tee Connector Market?

The reducing tee connector market is advancing steadily due to increasing infrastructure development driven by urbanization and industrial expansion requiring extensive piping systems with efficient branch connection solutions, and growing adoption of standardized pipe fittings reducing project costs through elimination of custom fabrication and field modifications across diverse municipal infrastructure, industrial process systems, and commercial building applications. However, the market faces challenges, including price competition from low-cost manufacturers affecting profit margins, material cost volatility impacting pricing stability, and substitution risks from alternative piping configurations utilizing separate fittings for diameter reduction and branching functions. Innovation in corrosion-resistant materials and advanced manufacturing techniques continues to influence product development and market differentiation patterns.

Expansion of Infrastructure Investment and Urbanization Trends

The accelerating global urbanization and corresponding infrastructure development requirements are driving substantial demand for pipe fittings including reducing tee connectors as essential components in water distribution networks, wastewater collection systems, and industrial facility construction supporting urban population growth and economic development. Government infrastructure programs and private construction projects are implementing comprehensive piping systems requiring extensive fitting inventories with reducing tee connectors enabling efficient layout design, accommodating equipment connections, and optimizing material utilization throughout complex distribution networks. Construction contractors are increasingly recognizing the cost advantages of standardized reducing tee fittings compared to field fabrication alternatives, creating sustained market demand as infrastructure investment accelerates in emerging economies and developed markets address aging infrastructure replacement needs. Urban development initiatives continue to generate pipeline construction activity supporting reducing tee connector consumption across residential, commercial, and industrial sectors.

Integration of Advanced Materials and Corrosion Resistance Technologies

Modern pipe fitting manufacturers are incorporating advanced materials including stainless steel alloys, duplex stainless steels, and specialized corrosion-resistant plastics that extend service life in aggressive chemical environments, high-temperature applications, and corrosive water conditions requiring superior material performance beyond conventional carbon steel and standard plastic fittings. Leading manufacturers are developing reducing tee connectors with enhanced metallurgical properties, improved surface treatments, and specialized coatings that address specific application challenges including seawater exposure, chemical processing, and elevated temperature services. These material innovations improve reliability while enabling market expansion into demanding applications previously requiring expensive exotic materials or frequent component replacement, including offshore platforms, desalination facilities, and chemical processing plants. Advanced material integration also allows manufacturers to differentiate product offerings and command premium pricing in markets valuing long-term performance over initial acquisition cost.

Development of Precision Manufacturing and Quality Assurance Systems

The advancement of automated manufacturing technologies, computer numerical control machining, and comprehensive quality control systems is driving production of reducing tee connectors with enhanced dimensional accuracy, consistent wall thickness, and reliable pressure ratings supporting demanding application requirements and stringent code compliance. Manufacturers are investing in advanced production equipment, non-destructive testing capabilities, and statistical process control that ensure product conformance to international standards, minimize defect rates, and support certification requirements for critical applications. These manufacturing improvements create opportunities for differentiated product positioning emphasizing quality assurance, traceability documentation, and liability protection appealing to contractors and facility owners prioritizing system reliability and regulatory compliance. Successful quality demonstration enables market penetration in applications where fitting failure consequences justify premium pricing for verified performance and comprehensive technical support.
What is the Analysis of the Reducing Tee Connector Market by Key Countries?

Reducing Tee Connector Market Cagr Analysis By Country

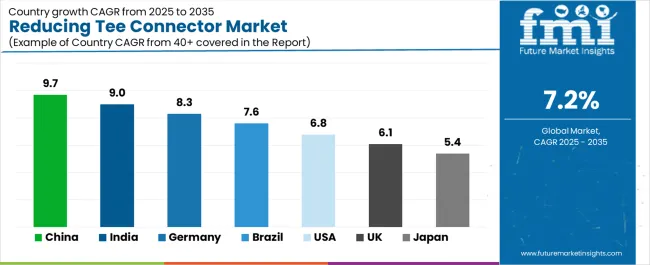
Country CAGR (2025-2035)
China 9.7%
India 9.0%
Germany 8.3%
Brazil 7.6%
United States 6.8%
United Kingdom 6.1%
Japan 5.4%

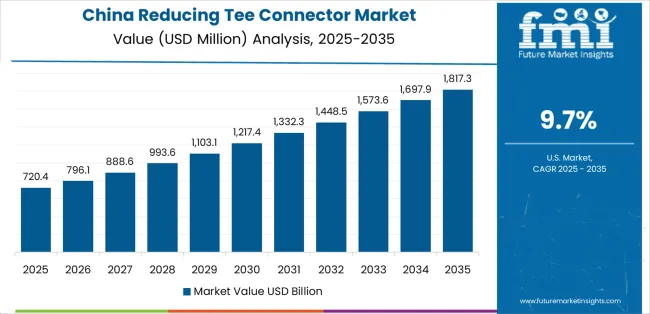
The reducing tee connector market is experiencing solid growth globally, with China leading at a 9.7% CAGR through 2035, driven by massive infrastructure investment, extensive industrial construction, and comprehensive urbanization requiring extensive piping system installation. India follows at 9.0%, supported by expanding urban water infrastructure, growing industrial capacity, and government infrastructure development initiatives. Germany shows growth at 8.3%, emphasizing infrastructure modernization, industrial facility upgrades, and comprehensive building construction. Brazil demonstrates 7.6% growth, supported by urban infrastructure development, industrial expansion, and water system improvements. The United States records 6.8%, focusing on aging infrastructure replacement, industrial facility maintenance, and building construction activity. The United Kingdom exhibits 6.1% growth, emphasizing infrastructure renewal and building services installation. Japan shows 5.4% growth, supported by infrastructure maintenance requirements and industrial facility operations.

The report covers an in-depth analysis of 40+ countries, with top-performing countries highlighted below.
China Leads Global Market Growth with Infrastructure Investment and Industrial Expansion

Reducing Tee Connector Market Country Value Analysis

Revenue from reducing tee connectors in China is projected to exhibit exceptional growth with a CAGR of 9.7% through 2035, driven by massive infrastructure investment under national development programs, extensive industrial construction supporting manufacturing expansion, and comprehensive urbanization requiring water supply systems, wastewater collection networks, and industrial process piping throughout major cities and industrial zones. The country's enormous construction volume and continuous infrastructure development are creating unprecedented demand for pipe fittings including reducing tee connectors. Major piping component manufacturers and distribution networks are establishing comprehensive supply capabilities to serve construction and industrial markets.

  • Massive urban water infrastructure projects and expanding municipal service networks are driving demand for reducing tee connectors throughout major metropolitan areas, creating opportunities across water distribution systems, wastewater collection networks, and building plumbing installations serving residential and commercial developments.
  • Extensive industrial construction and expanding manufacturing capacity are supporting adoption of reducing tee fittings among industrial contractors installing process piping systems, utility distribution networks, and equipment connections throughout chemical plants, power generation facilities, and manufacturing operations.

India Demonstrates Strong Market Potential with Infrastructure Development and Industrial Growth

Revenue from reducing tee connectors in India is expanding at a CAGR of 9.0%, supported by ambitious urban infrastructure development programs, expanding industrial capacity under Make in India initiatives, and growing building construction serving residential and commercial property development. The country's infrastructure investment and industrial expansion are driving pipe fitting demand throughout diverse construction sectors. Manufacturers and distributors are establishing market presence through domestic production and comprehensive distribution networks.

  • Expanding urban water supply projects and municipal infrastructure development are creating opportunities for reducing tee connector utilization across water distribution systems, building plumbing installations, and irrigation networks serving agricultural and landscape applications throughout metropolitan and rural areas.
  • Growing industrial construction and expanding manufacturing facilities are driving adoption of pipe fittings among contractors installing process piping, utility systems, and equipment connections throughout chemical plants, pharmaceutical facilities, and manufacturing operations across major industrial regions.

Germany Demonstrates Engineering Excellence with Infrastructure Quality and Industrial Standards

Revenue from reducing tee connectors in Germany is expanding at a CAGR of 8.3%, supported by comprehensive infrastructure maintenance programs, industrial facility modernization initiatives, and advanced building construction incorporating sophisticated building services systems. The nation's emphasis on quality standards and technical specifications are driving demand for precision-manufactured pipe fittings meeting stringent requirements. Manufacturers and suppliers maintain strong market presence through quality-focused product offerings and technical support capabilities.

  • Comprehensive infrastructure renewal and building modernization programs are creating sustained demand for high-quality reducing tee connectors among contractors implementing water system upgrades, HVAC installations, and industrial piping projects meeting German engineering standards and regulatory requirements.
  • Advanced industrial facilities and precision manufacturing operations are supporting adoption of premium pipe fittings among industrial contractors installing process systems, cleanroom utilities, and specialized equipment connections requiring documented material compliance and dimensional accuracy.

Brazil Emphasizes Urban Development and Industrial Infrastructure Expansion

Revenue from reducing tee connectors in Brazil is expanding at a CAGR of 7.6%, supported by urban infrastructure development addressing service gaps, industrial construction supporting economic development, and building construction serving growing metropolitan populations. The nation's infrastructure needs and economic growth are driving pipe fitting demand across construction and industrial sectors. Distributors and manufacturers are investing in market development addressing diverse regional requirements.

  • Urban water infrastructure projects and municipal service expansion are creating demand for reducing tee connectors across water distribution networks, sanitation systems, and building plumbing installations serving residential developments and commercial construction throughout major cities and regional centers.
  • Industrial facility construction and manufacturing capacity expansion are driving adoption of pipe fittings among contractors installing process piping systems, utility distributions, and equipment connections throughout food processing, petrochemical, and manufacturing facilities across major industrial regions.

United States Demonstrates Established Market with Infrastructure Renewal and Industrial Maintenance

Revenue from reducing tee connectors in the United States is expanding at a CAGR of 6.8%, supported by aging infrastructure replacement requirements, industrial facility maintenance and upgrades, and continuous building construction activity serving commercial and residential property development. The nation's mature infrastructure and established industrial base are driving consistent pipe fitting demand. Manufacturers and distributors maintain extensive market presence through comprehensive product lines and distribution networks.

  • Aging water infrastructure replacement and municipal system upgrades are creating sustained demand for reducing tee connectors among utilities and contractors implementing pipeline rehabilitation, water main replacement, and system expansion projects addressing deteriorating infrastructure throughout metropolitan areas.
  • Industrial facility maintenance and process system upgrades are driving adoption of pipe fittings among maintenance contractors and facility engineers implementing equipment replacement, system modifications, and capacity expansions throughout chemical plants, refineries, and manufacturing operations.

United Kingdom Shows Steady Growth with Infrastructure Investment and Building Services

Revenue from reducing tee connectors in the United Kingdom is expanding at a CAGR of 6.1%, supported by infrastructure renewal programs, building construction activity, and industrial facility operations requiring pipe fitting components for maintenance and construction applications. The UK's infrastructure needs and construction activity are driving stable pipe fitting demand. Distributors and manufacturers maintain market presence through established supply relationships and product availability.
  • Infrastructure investment programs and water system improvements are creating consistent demand for reducing tee connectors among utilities and contractors implementing distribution network upgrades, building plumbing installations, and industrial piping projects throughout England, Scotland, Wales, and Northern Ireland.
  • Building construction and commercial property development are supporting adoption of pipe fittings among mechanical contractors installing HVAC systems, plumbing distributions, and fire protection networks serving diverse building applications throughout major urban centers and regional markets.

Japan Focuses on Infrastructure Maintenance and Industrial Facility Operations

Reducing Tee Connector Market Japan Market Share Analysis By Product Type

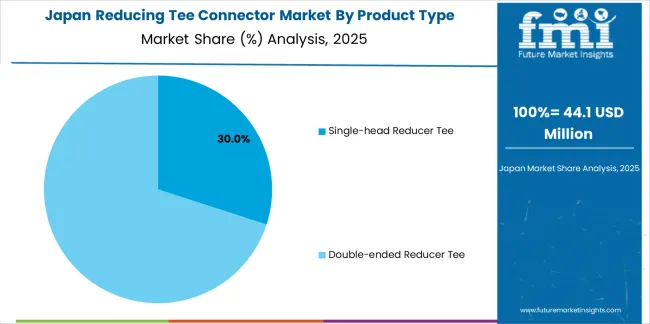
Revenue from reducing tee connectors in Japan is growing at a CAGR of 5.4%, driven by comprehensive infrastructure maintenance requirements, industrial facility operations demanding reliable components, and building construction incorporating sophisticated mechanical systems. Japan's emphasis on quality and reliability are supporting demand for precision-manufactured pipe fittings meeting stringent specifications. Manufacturers and distributors maintain market presence through quality-focused offerings and technical support.
  • Infrastructure maintenance programs and utility system operations are creating sustained demand for high-quality reducing tee connectors among utilities and contractors implementing system repairs, component replacements, and facility upgrades meeting Japanese quality standards and regulatory requirements.
  • Advanced industrial facilities and precision manufacturing operations are driving adoption of premium pipe fittings among maintenance teams and contractors implementing process modifications, equipment installations, and system expansions requiring documented material traceability and dimensional conformance.

What is the Market Split for Reducing Tee Connectors in Europe?

Reducing Tee Connector Market Europe Country Market Share Analysis, 2025 & 2035

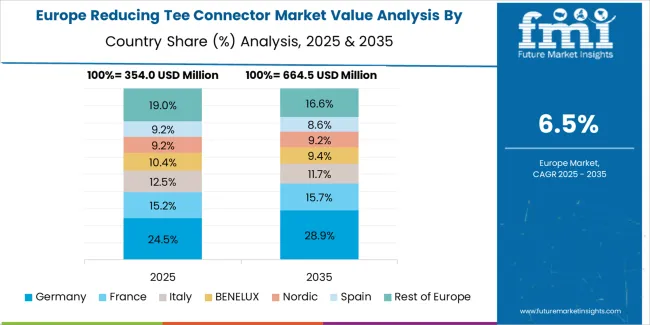
The reducing tee connector market in Europe is projected to grow from USD 398.6 million in 2025 to USD 748.3 million by 2035, registering a CAGR of 6.5% over the forecast period. Germany is expected to maintain leadership with a 28.4% market share in 2025, moderating to 27.6% by 2035, supported by industrial infrastructure, building construction, and comprehensive quality standards.

France follows with 19.2% in 2025, projected at 19.7% by 2035, driven by infrastructure investment, industrial facilities, and building construction activity. The United Kingdom holds 15.8% in 2025, expected to reach 16.3% by 2035 supported by infrastructure renewal and building services markets. Italy commands 13.4% in 2025, rising slightly to 13.8% by 2035, while Spain accounts for 10.6% in 2025, reaching 11.1% by 2035 aided by construction activity and infrastructure development. Poland maintains 4.9% in 2025, up to 5.3% by 2035 due to industrial expansion and infrastructure investment. The Rest of Europe region, including Nordics, Central & Eastern Europe, and other markets, is anticipated to hold 7.7% in 2025 and 6.2% by 2035, reflecting varied infrastructure development and industrial activity across diverse national markets.
What is the Competitive Landscape of the Reducing Tee Connector Market?

Reducing Tee Connector Market Analysis By Company

The reducing tee connector market is characterized by competition among established pipe fitting manufacturers, industrial distribution companies, and specialized piping component suppliers. Companies are investing in manufacturing efficiency, material innovation, quality assurance systems, and distribution network expansion to deliver reliable, cost-competitive, and readily available reducing tee connector solutions. Innovation in corrosion-resistant materials, precision manufacturing processes, and comprehensive technical documentation is central to strengthening market position and competitive advantage.

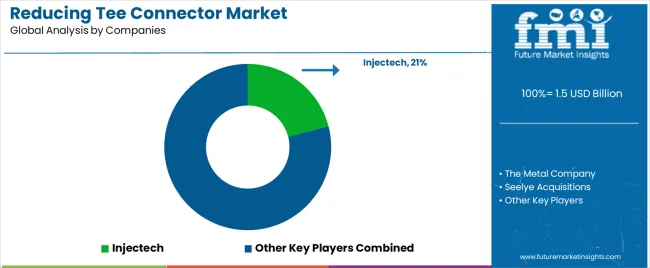
Injectech leads as a pipe fitting manufacturer offering comprehensive reducing tee connector products with emphasis on material quality, dimensional accuracy, and industry standard compliance. The Metal Company provides industrial pipe fittings with focus on material variety and application expertise. Seelye Acquisitions offers piping components and fittings serving industrial and commercial markets. Tefen specializes in plastic pipe fittings and fluid handling components. Newport provides industrial piping products including reducing tee connectors. Business Key focuses on pipe fitting distribution and supply.

LeakyPipe offers specialized pipe fittings and irrigation components. The Southern Valve and Fitting provides comprehensive valve and fitting products. Hansen Products specializes in industrial piping components and fittings. Argco offers pipe fittings and industrial supplies. ERA focuses on pipe fitting manufacturing and distribution. PipingNow provides online pipe fitting sales and technical resources. Fluid Power specializes in hydraulic and pneumatic fittings. Shurjoint offers mechanical pipe joining systems and fittings. Hansen provides industrial piping components. Belden focuses on pipe fitting products. Galvanized specializes in galvanized pipe fittings. LASCO Fittings offers comprehensive plastic and metal pipe fittings.

Reducing Tee Connector Market - Stakeholder Contribution Framework

Reducing tee connectors represent an essential piping component segment within construction and industrial sectors, projected to grow from USD 1.5 billion in 2025 to USD 2.9 billion by 2035 at a 7.2% CAGR. These specialized pipe fittings, primarily single-head and double-ended reducer tee configurations for diameter transition and branch connection, serve as fundamental components in piping systems where space optimization, installation efficiency, and reliable fluid distribution are required across municipal water infrastructure, industrial process piping, building mechanical systems, and chemical plant applications. Market expansion is driven by accelerating urbanization requiring extensive water infrastructure, growing industrial construction demanding sophisticated process piping, increasing emphasis on installation cost reduction through standardized components, and rising adoption of corrosion-resistant materials extending system service life in demanding environments.

How Standards Organizations Could Strengthen Product Quality and Industry Practices?

  • Dimensional Standards: Establish comprehensive specifications for reducing tee connector dimensions, pressure ratings, material requirements, and manufacturing tolerances that ensure product interchangeability, maintain system integrity, and support reliable installation across diverse piping applications and pressure classes.
  • Material Specifications: Develop detailed material standards for various reducing tee connector applications including chemical composition limits, mechanical property requirements, and corrosion resistance criteria that ensure adequate performance throughout intended service conditions and application environments.
  • Testing and Certification: Implement mandatory testing protocols for pressure rating verification, leak testing, and material validation that ensure product conformance to stated specifications and provide quality assurance supporting liability protection and regulatory compliance.
  • Marking and Identification: Establish requirements for product marking including material identification, pressure ratings, manufacturing date, and traceability codes that enable proper component selection, facilitate installation verification, and support maintenance documentation throughout facility lifecycles.
  • Installation Guidelines: Develop comprehensive installation standards addressing proper joint preparation, gasket selection, torque specifications, and inspection procedures that ensure leak-free connections and reliable system performance throughout operational service life.

How Industry Associations Could Advance Market Development and Technical Knowledge?

  • Technical Education: Create training programs covering reducing tee connector selection, proper installation techniques, material compatibility, and troubleshooting methods that maintain contractor competency and support quality installation practices across construction and industrial sectors.
  • Application Guidelines: Develop comprehensive selection guides addressing reducing tee connector sizing methods, pressure drop calculations, and material selection criteria that optimize system design, ensure code compliance, and support cost-effective component specification.
  • Best Practice Documentation: Publish installation case studies, document successful applications, and share lessons learned that demonstrate proper techniques, identify common mistakes, and accelerate industry knowledge transfer supporting quality improvement initiatives.
  • Material Innovation Promotion: Facilitate adoption of advanced materials including corrosion-resistant alloys and high-performance plastics through technical seminars, performance data dissemination, and application success documentation that reduces specifier reluctance and accelerates market acceptance.
  • Supply Chain Coordination: Promote inventory standardization, facilitate manufacturer-distributor communication, and support availability improvements that reduce project delays, minimize emergency procurement costs, and ensure reliable component supply throughout construction schedules.

How Manufacturers Could Drive Quality and Market Leadership?

  • Manufacturing Excellence: Implement advanced production technologies including automated machining, robotic welding, and statistical process control that ensure consistent product quality, minimize defect rates, and support high-volume production meeting demanding delivery schedules.
  • Quality Assurance Systems: Establish comprehensive testing protocols, implement material traceability systems, and maintain certification programs that demonstrate product conformance to specifications and provide documentation supporting liability protection and regulatory compliance.
  • Material Innovation: Invest in development of corrosion-resistant materials, explore high-performance alloys, and create specialized coatings that extend service life, expand application possibilities, and differentiate product offerings in competitive markets.
  • Technical Support Services: Provide comprehensive application assistance including sizing calculations, material selection guidance, and installation troubleshooting that strengthen customer relationships, reduce specification errors, and build brand loyalty among engineering and contractor communities.
  • Distribution Network Development: Establish strategic partnerships with industrial distributors, implement vendor-managed inventory programs, and create regional warehousing that ensure product availability, minimize delivery lead times, and support just-in-time construction schedules.

How Contractors and Engineers Could Optimize System Performance and Project Success?

  • Proper Component Selection: Conduct comprehensive system design analysis considering flow requirements, pressure conditions, and material compatibility that ensure appropriate reducing tee connector specification, prevent premature failures, and optimize lifecycle costs.
  • Installation Quality Control: Implement systematic inspection procedures, verify proper joint assembly, and document installation compliance that ensure leak-free connections, maintain system integrity, and prevent costly repairs during commissioning and operation.
  • Material Verification: Confirm component material certifications, verify dimensional conformance, and validate pressure ratings that ensure code compliance, protect against substandard products, and provide documentation supporting warranty claims and liability protection.
  • Inventory Management: Maintain appropriate spare parts inventory, establish preferred supplier relationships, and implement procurement strategies that minimize emergency purchases, reduce project delays, and optimize material costs throughout construction schedules.
  • Lifecycle Planning: Consider long-term maintenance requirements, evaluate material durability, and implement systematic inspection programs that extend system service life, prevent unexpected failures, and optimize facility operational costs.

How Research Institutions Could Enable Technical Advancement?

  • Material Science Research: Investigate advanced alloys, study corrosion mechanisms, and develop improved surface treatments that extend reducing tee connector service life in aggressive environments and expand application possibilities in challenging conditions.
  • Manufacturing Process Development: Research advanced production methods including additive manufacturing, explore automated inspection technologies, and develop cost-reduction techniques that improve product quality while reducing manufacturing costs supporting market expansion.
  • Performance Testing: Conduct long-term durability studies, investigate failure mechanisms, and develop accelerated testing protocols that validate product performance, support certification programs, and provide data informing design improvements.
  • Fluid Dynamics Research: Study flow characteristics through reducing tee connectors, quantify pressure drop relationships, and develop computational models that optimize fitting geometry, improve system efficiency, and support engineering design methodologies.
  • Sustainability Assessment: Evaluate environmental impacts throughout product lifecycle, investigate recycling possibilities, and develop sustainable material alternatives that reduce carbon footprint and support industry environmental performance objectives.

How Distributors and Supply Chain Partners Could Support Market Efficiency?

  • Inventory Optimization: Maintain comprehensive product selection including diverse materials and sizes, implement demand forecasting systems, and establish strategic warehousing that ensure product availability and minimize contractor procurement delays.
  • Technical Product Support: Provide knowledgeable sales staff offering application assistance, develop online product selection tools, and create comprehensive technical documentation that support proper component specification and reduce selection errors.
  • Logistics Excellence: Implement efficient order processing, establish reliable delivery systems, and create flexible fulfillment options that minimize lead times, reduce transportation costs, and support contractor schedule requirements.
  • Value-Added Services: Offer kitting services assembling complete project requirements, provide inventory management programs supporting large facilities, and create vendor-managed inventory arrangements that simplify procurement and optimize working capital.
  • Market Development Investment: Support contractor training programs, sponsor technical seminars, and participate in industry events that promote product awareness, educate potential users, and accelerate market adoption of advanced materials and technologies.

Key Players in the Reducing Tee Connector Market

  • Injectech
  • The Metal Company
  • Seelye Acquisitions
  • Tefen
  • Newport
  • Business Key
  • LeakyPipe
  • The Southern Valve and Fitting
  • Hansen Products
  • Argco
  • ERA
  • PipingNow
  • Fluid Power
  • Shurjoint
  • Hansen
  • Belden
  • Galvanized
  • LASCO Fittings

Scope of the Report

Items Values
Quantitative Units (2025) USD 1.5 billion
Product Type Single-head Reducer Tee, Double-ended Reducer Tee
Application Water Supply and Drainage Engineering, Thermal Engineering, Chemical Pipeline, Others
Regions Covered East Asia, Europe, North America, South Asia, Latin America, Middle East & Africa, Eastern Europe
Countries Covered China, India, Germany, Brazil, United States, United Kingdom, Japan, and 40+ countries
Key Companies Profiled Injectech, The Metal Company, Seelye Acquisitions, Tefen, Newport, Business Key
Additional Attributes Dollar sales by product type and application category, regional demand trends, competitive landscape, technological advancements in manufacturing processes, material innovation, quality assurance systems, and distribution network development

Reducing Tee Connector Market by Segments

Product Type:

  • Single-head Reducer Tee
  • Double-ended Reducer Tee

Application:

  • Water Supply and Drainage Engineering
  • Thermal Engineering
  • Chemical Pipeline
  • Others

Region:

  • East Asia
    • China
    • Japan
    • South Korea
    • Taiwan
    • Rest of East Asia
  • Europe
    • Germany
    • United Kingdom
    • France
    • Italy
    • Spain
    • Netherlands
    • Nordic
    • BENELUX
    • Rest of Europe
  • North America
    • United States
    • Canada
    • Mexico
  • South Asia
    • India
    • Pakistan
    • Bangladesh
    • Rest of South Asia
  • Latin America
    • Brazil
    • Argentina
    • Chile
    • Rest of Latin America
  • Middle East & Africa
    • Kingdom of Saudi Arabia
    • Other GCC Countries
    • Turkey
    • South Africa
    • Other African Union
    • Rest of Middle East & Africa
  • Eastern Europe
    • Russia
    • Poland
    • Czech Republic
    • Rest of Eastern Europe

Frequently Asked Questions

How big is the reducing tee connector market in 2025?

The global reducing tee connector market is estimated to be valued at USD 1.5 billion in 2025.

What will be the size of reducing tee connector market in 2035?

The market size for the reducing tee connector market is projected to reach USD 3.0 billion by 2035.

How much will be the reducing tee connector market growth between 2025 and 2035?

The reducing tee connector market is expected to grow at a 7.2% CAGR between 2025 and 2035.

What are the key product types in the reducing tee connector market?

The key product types in reducing tee connector market are single-head reducer tee and double-ended reducer tee.

Which application segment to contribute significant share in the reducing tee connector market in 2025?

In terms of application, water supply and drainage engineering segment to command 42.6% share in the reducing tee connector market in 2025.

Table of Content

  1. Executive Summary
    • Global Market Outlook
    • Demand to side Trends
    • Supply to side Trends
    • Technology Roadmap Analysis
    • Analysis and Recommendations
  2. Market Overview
    • Market Coverage / Taxonomy
    • Market Definition / Scope / Limitations
  3. Market Background
    • Market Dynamics
      • Drivers
      • Restraints
      • Opportunity
      • Trends
    • Scenario Forecast
      • Demand in Optimistic Scenario
      • Demand in Likely Scenario
      • Demand in Conservative Scenario
    • Opportunity Map Analysis
    • Product Life Cycle Analysis
    • Supply Chain Analysis
    • Investment Feasibility Matrix
    • Value Chain Analysis
    • PESTLE and Porter’s Analysis
    • Regulatory Landscape
    • Regional Parent Market Outlook
    • Production and Consumption Statistics
    • Import and Export Statistics
  4. Global Market Analysis 2020 to 2024 and Forecast, 2025 to 2035
    • Historical Market Size Value (USD Million) Analysis, 2020 to 2024
    • Current and Future Market Size Value (USD Million) Projections, 2025 to 2035
      • Y to o to Y Growth Trend Analysis
      • Absolute $ Opportunity Analysis
  5. Global Market Pricing Analysis 2020 to 2024 and Forecast 2025 to 2035
  6. Global Market Analysis 2020 to 2024 and Forecast 2025 to 2035, By Product Type
    • Introduction / Key Findings
    • Historical Market Size Value (USD Million) Analysis By Product Type , 2020 to 2024
    • Current and Future Market Size Value (USD Million) Analysis and Forecast By Product Type , 2025 to 2035
      • Single-head Reducer Tee
      • Double-ended Reducer Tee
    • Y to o to Y Growth Trend Analysis By Product Type , 2020 to 2024
    • Absolute $ Opportunity Analysis By Product Type , 2025 to 2035
  7. Global Market Analysis 2020 to 2024 and Forecast 2025 to 2035, By Application
    • Introduction / Key Findings
    • Historical Market Size Value (USD Million) Analysis By Application, 2020 to 2024
    • Current and Future Market Size Value (USD Million) Analysis and Forecast By Application, 2025 to 2035
      • Water Supply and Drainage Engineering
      • Thermal Engineering
      • Chemical Pipeline
      • Others
    • Y to o to Y Growth Trend Analysis By Application, 2020 to 2024
    • Absolute $ Opportunity Analysis By Application, 2025 to 2035
  8. Global Market Analysis 2020 to 2024 and Forecast 2025 to 2035, By Region
    • Introduction
    • Historical Market Size Value (USD Million) Analysis By Region, 2020 to 2024
    • Current Market Size Value (USD Million) Analysis and Forecast By Region, 2025 to 2035
      • North America
      • Latin America
      • Western Europe
      • Eastern Europe
      • East Asia
      • South Asia and Pacific
      • Middle East & Africa
    • Market Attractiveness Analysis By Region
  9. North America Market Analysis 2020 to 2024 and Forecast 2025 to 2035, By Country
    • Historical Market Size Value (USD Million) Trend Analysis By Market Taxonomy, 2020 to 2024
    • Market Size Value (USD Million) Forecast By Market Taxonomy, 2025 to 2035
      • By Country
        • USA
        • Canada
        • Mexico
      • By Product Type
      • By Application
    • Market Attractiveness Analysis
      • By Country
      • By Product Type
      • By Application
    • Key Takeaways
  10. Latin America Market Analysis 2020 to 2024 and Forecast 2025 to 2035, By Country
    • Historical Market Size Value (USD Million) Trend Analysis By Market Taxonomy, 2020 to 2024
    • Market Size Value (USD Million) Forecast By Market Taxonomy, 2025 to 2035
      • By Country
        • Brazil
        • Chile
        • Rest of Latin America
      • By Product Type
      • By Application
    • Market Attractiveness Analysis
      • By Country
      • By Product Type
      • By Application
    • Key Takeaways
  11. Western Europe Market Analysis 2020 to 2024 and Forecast 2025 to 2035, By Country
    • Historical Market Size Value (USD Million) Trend Analysis By Market Taxonomy, 2020 to 2024
    • Market Size Value (USD Million) Forecast By Market Taxonomy, 2025 to 2035
      • By Country
        • Germany
        • UK
        • Italy
        • Spain
        • France
        • Nordic
        • BENELUX
        • Rest of Western Europe
      • By Product Type
      • By Application
    • Market Attractiveness Analysis
      • By Country
      • By Product Type
      • By Application
    • Key Takeaways
  12. Eastern Europe Market Analysis 2020 to 2024 and Forecast 2025 to 2035, By Country
    • Historical Market Size Value (USD Million) Trend Analysis By Market Taxonomy, 2020 to 2024
    • Market Size Value (USD Million) Forecast By Market Taxonomy, 2025 to 2035
      • By Country
        • Russia
        • Poland
        • Hungary
        • Balkan & Baltic
        • Rest of Eastern Europe
      • By Product Type
      • By Application
    • Market Attractiveness Analysis
      • By Country
      • By Product Type
      • By Application
    • Key Takeaways
  13. East Asia Market Analysis 2020 to 2024 and Forecast 2025 to 2035, By Country
    • Historical Market Size Value (USD Million) Trend Analysis By Market Taxonomy, 2020 to 2024
    • Market Size Value (USD Million) Forecast By Market Taxonomy, 2025 to 2035
      • By Country
        • China
        • Japan
        • South Korea
      • By Product Type
      • By Application
    • Market Attractiveness Analysis
      • By Country
      • By Product Type
      • By Application
    • Key Takeaways
  14. South Asia and Pacific Market Analysis 2020 to 2024 and Forecast 2025 to 2035, By Country
    • Historical Market Size Value (USD Million) Trend Analysis By Market Taxonomy, 2020 to 2024
    • Market Size Value (USD Million) Forecast By Market Taxonomy, 2025 to 2035
      • By Country
        • India
        • ASEAN
        • Australia & New Zealand
        • Rest of South Asia and Pacific
      • By Product Type
      • By Application
    • Market Attractiveness Analysis
      • By Country
      • By Product Type
      • By Application
    • Key Takeaways
  15. Middle East & Africa Market Analysis 2020 to 2024 and Forecast 2025 to 2035, By Country
    • Historical Market Size Value (USD Million) Trend Analysis By Market Taxonomy, 2020 to 2024
    • Market Size Value (USD Million) Forecast By Market Taxonomy, 2025 to 2035
      • By Country
        • Kingdom of Saudi Arabia
        • Other GCC Countries
        • Turkiye
        • South Africa
        • Other African Union
        • Rest of Middle East & Africa
      • By Product Type
      • By Application
    • Market Attractiveness Analysis
      • By Country
      • By Product Type
      • By Application
    • Key Takeaways
  16. Key Countries Market Analysis
    • USA
      • Pricing Analysis
      • Market Share Analysis, 2024
        • By Product Type
        • By Application
    • Canada
      • Pricing Analysis
      • Market Share Analysis, 2024
        • By Product Type
        • By Application
    • Mexico
      • Pricing Analysis
      • Market Share Analysis, 2024
        • By Product Type
        • By Application
    • Brazil
      • Pricing Analysis
      • Market Share Analysis, 2024
        • By Product Type
        • By Application
    • Chile
      • Pricing Analysis
      • Market Share Analysis, 2024
        • By Product Type
        • By Application
    • Germany
      • Pricing Analysis
      • Market Share Analysis, 2024
        • By Product Type
        • By Application
    • UK
      • Pricing Analysis
      • Market Share Analysis, 2024
        • By Product Type
        • By Application
    • Italy
      • Pricing Analysis
      • Market Share Analysis, 2024
        • By Product Type
        • By Application
    • Spain
      • Pricing Analysis
      • Market Share Analysis, 2024
        • By Product Type
        • By Application
    • France
      • Pricing Analysis
      • Market Share Analysis, 2024
        • By Product Type
        • By Application
    • India
      • Pricing Analysis
      • Market Share Analysis, 2024
        • By Product Type
        • By Application
    • ASEAN
      • Pricing Analysis
      • Market Share Analysis, 2024
        • By Product Type
        • By Application
    • Australia & New Zealand
      • Pricing Analysis
      • Market Share Analysis, 2024
        • By Product Type
        • By Application
    • China
      • Pricing Analysis
      • Market Share Analysis, 2024
        • By Product Type
        • By Application
    • Japan
      • Pricing Analysis
      • Market Share Analysis, 2024
        • By Product Type
        • By Application
    • South Korea
      • Pricing Analysis
      • Market Share Analysis, 2024
        • By Product Type
        • By Application
    • Russia
      • Pricing Analysis
      • Market Share Analysis, 2024
        • By Product Type
        • By Application
    • Poland
      • Pricing Analysis
      • Market Share Analysis, 2024
        • By Product Type
        • By Application
    • Hungary
      • Pricing Analysis
      • Market Share Analysis, 2024
        • By Product Type
        • By Application
    • Kingdom of Saudi Arabia
      • Pricing Analysis
      • Market Share Analysis, 2024
        • By Product Type
        • By Application
    • Turkiye
      • Pricing Analysis
      • Market Share Analysis, 2024
        • By Product Type
        • By Application
    • South Africa
      • Pricing Analysis
      • Market Share Analysis, 2024
        • By Product Type
        • By Application
  17. Market Structure Analysis
    • Competition Dashboard
    • Competition Benchmarking
    • Market Share Analysis of Top Players
      • By Regional
      • By Product Type
      • By Application
  18. Competition Analysis
    • Competition Deep Dive
      • Injectech
        • Overview
        • Product Portfolio
        • Profitability by Market Segments (Product/Age /Sales Channel/Region)
        • Sales Footprint
        • Strategy Overview
          • Marketing Strategy
          • Product Strategy
          • Channel Strategy
      • The Metal Company
      • Seelye Acquisitions
      • Tefen
      • Newport
      • Business Key
      • LeakyPipe
      • The Southern Valve and Fitting
      • Hansen Products
      • Argco
      • ERA
      • PipingNow
      • Fluid Power
      • Shurjoint
      • Hansen
      • Belden
      • Galvanized
      • LASCO Fittings
  19. Assumptions & Acronyms Used
  20. Research Methodology

List of Tables

  • Table 1: Global Market Value (USD Million) Forecast by Region, 2020 to 2035
  • Table 2: Global Market Value (USD Million) Forecast by Product Type , 2020 to 2035
  • Table 3: Global Market Value (USD Million) Forecast by Application, 2020 to 2035
  • Table 4: North America Market Value (USD Million) Forecast by Country, 2020 to 2035
  • Table 5: North America Market Value (USD Million) Forecast by Product Type , 2020 to 2035
  • Table 6: North America Market Value (USD Million) Forecast by Application, 2020 to 2035
  • Table 7: Latin America Market Value (USD Million) Forecast by Country, 2020 to 2035
  • Table 8: Latin America Market Value (USD Million) Forecast by Product Type , 2020 to 2035
  • Table 9: Latin America Market Value (USD Million) Forecast by Application, 2020 to 2035
  • Table 10: Western Europe Market Value (USD Million) Forecast by Country, 2020 to 2035
  • Table 11: Western Europe Market Value (USD Million) Forecast by Product Type , 2020 to 2035
  • Table 12: Western Europe Market Value (USD Million) Forecast by Application, 2020 to 2035
  • Table 13: Eastern Europe Market Value (USD Million) Forecast by Country, 2020 to 2035
  • Table 14: Eastern Europe Market Value (USD Million) Forecast by Product Type , 2020 to 2035
  • Table 15: Eastern Europe Market Value (USD Million) Forecast by Application, 2020 to 2035
  • Table 16: East Asia Market Value (USD Million) Forecast by Country, 2020 to 2035
  • Table 17: East Asia Market Value (USD Million) Forecast by Product Type , 2020 to 2035
  • Table 18: East Asia Market Value (USD Million) Forecast by Application, 2020 to 2035
  • Table 19: South Asia and Pacific Market Value (USD Million) Forecast by Country, 2020 to 2035
  • Table 20: South Asia and Pacific Market Value (USD Million) Forecast by Product Type , 2020 to 2035
  • Table 21: South Asia and Pacific Market Value (USD Million) Forecast by Application, 2020 to 2035
  • Table 22: Middle East & Africa Market Value (USD Million) Forecast by Country, 2020 to 2035
  • Table 23: Middle East & Africa Market Value (USD Million) Forecast by Product Type , 2020 to 2035
  • Table 24: Middle East & Africa Market Value (USD Million) Forecast by Application, 2020 to 2035

List of Figures

  • Figure 1: Global Market Pricing Analysis
  • Figure 2: Global Market Value (USD Million) Forecast 2020-2035
  • Figure 3: Global Market Value Share and BPS Analysis by Product Type , 2025 and 2035
  • Figure 4: Global Market Y to o to Y Growth Comparison by Product Type , 2025-2035
  • Figure 5: Global Market Attractiveness Analysis by Product Type
  • Figure 6: Global Market Value Share and BPS Analysis by Application, 2025 and 2035
  • Figure 7: Global Market Y to o to Y Growth Comparison by Application, 2025-2035
  • Figure 8: Global Market Attractiveness Analysis by Application
  • Figure 9: Global Market Value (USD Million) Share and BPS Analysis by Region, 2025 and 2035
  • Figure 10: Global Market Y to o to Y Growth Comparison by Region, 2025-2035
  • Figure 11: Global Market Attractiveness Analysis by Region
  • Figure 12: North America Market Incremental Dollar Opportunity, 2025-2035
  • Figure 13: Latin America Market Incremental Dollar Opportunity, 2025-2035
  • Figure 14: Western Europe Market Incremental Dollar Opportunity, 2025-2035
  • Figure 15: Eastern Europe Market Incremental Dollar Opportunity, 2025-2035
  • Figure 16: East Asia Market Incremental Dollar Opportunity, 2025-2035
  • Figure 17: South Asia and Pacific Market Incremental Dollar Opportunity, 2025-2035
  • Figure 18: Middle East & Africa Market Incremental Dollar Opportunity, 2025-2035
  • Figure 19: North America Market Value Share and BPS Analysis by Country, 2025 and 2035
  • Figure 20: North America Market Value Share and BPS Analysis by Product Type , 2025 and 2035
  • Figure 21: North America Market Y to o to Y Growth Comparison by Product Type , 2025-2035
  • Figure 22: North America Market Attractiveness Analysis by Product Type
  • Figure 23: North America Market Value Share and BPS Analysis by Application, 2025 and 2035
  • Figure 24: North America Market Y to o to Y Growth Comparison by Application, 2025-2035
  • Figure 25: North America Market Attractiveness Analysis by Application
  • Figure 26: Latin America Market Value Share and BPS Analysis by Country, 2025 and 2035
  • Figure 27: Latin America Market Value Share and BPS Analysis by Product Type , 2025 and 2035
  • Figure 28: Latin America Market Y to o to Y Growth Comparison by Product Type , 2025-2035
  • Figure 29: Latin America Market Attractiveness Analysis by Product Type
  • Figure 30: Latin America Market Value Share and BPS Analysis by Application, 2025 and 2035
  • Figure 31: Latin America Market Y to o to Y Growth Comparison by Application, 2025-2035
  • Figure 32: Latin America Market Attractiveness Analysis by Application
  • Figure 33: Western Europe Market Value Share and BPS Analysis by Country, 2025 and 2035
  • Figure 34: Western Europe Market Value Share and BPS Analysis by Product Type , 2025 and 2035
  • Figure 35: Western Europe Market Y to o to Y Growth Comparison by Product Type , 2025-2035
  • Figure 36: Western Europe Market Attractiveness Analysis by Product Type
  • Figure 37: Western Europe Market Value Share and BPS Analysis by Application, 2025 and 2035
  • Figure 38: Western Europe Market Y to o to Y Growth Comparison by Application, 2025-2035
  • Figure 39: Western Europe Market Attractiveness Analysis by Application
  • Figure 40: Eastern Europe Market Value Share and BPS Analysis by Country, 2025 and 2035
  • Figure 41: Eastern Europe Market Value Share and BPS Analysis by Product Type , 2025 and 2035
  • Figure 42: Eastern Europe Market Y to o to Y Growth Comparison by Product Type , 2025-2035
  • Figure 43: Eastern Europe Market Attractiveness Analysis by Product Type
  • Figure 44: Eastern Europe Market Value Share and BPS Analysis by Application, 2025 and 2035
  • Figure 45: Eastern Europe Market Y to o to Y Growth Comparison by Application, 2025-2035
  • Figure 46: Eastern Europe Market Attractiveness Analysis by Application
  • Figure 47: East Asia Market Value Share and BPS Analysis by Country, 2025 and 2035
  • Figure 48: East Asia Market Value Share and BPS Analysis by Product Type , 2025 and 2035
  • Figure 49: East Asia Market Y to o to Y Growth Comparison by Product Type , 2025-2035
  • Figure 50: East Asia Market Attractiveness Analysis by Product Type
  • Figure 51: East Asia Market Value Share and BPS Analysis by Application, 2025 and 2035
  • Figure 52: East Asia Market Y to o to Y Growth Comparison by Application, 2025-2035
  • Figure 53: East Asia Market Attractiveness Analysis by Application
  • Figure 54: South Asia and Pacific Market Value Share and BPS Analysis by Country, 2025 and 2035
  • Figure 55: South Asia and Pacific Market Value Share and BPS Analysis by Product Type , 2025 and 2035
  • Figure 56: South Asia and Pacific Market Y to o to Y Growth Comparison by Product Type , 2025-2035
  • Figure 57: South Asia and Pacific Market Attractiveness Analysis by Product Type
  • Figure 58: South Asia and Pacific Market Value Share and BPS Analysis by Application, 2025 and 2035
  • Figure 59: South Asia and Pacific Market Y to o to Y Growth Comparison by Application, 2025-2035
  • Figure 60: South Asia and Pacific Market Attractiveness Analysis by Application
  • Figure 61: Middle East & Africa Market Value Share and BPS Analysis by Country, 2025 and 2035
  • Figure 62: Middle East & Africa Market Value Share and BPS Analysis by Product Type , 2025 and 2035
  • Figure 63: Middle East & Africa Market Y to o to Y Growth Comparison by Product Type , 2025-2035
  • Figure 64: Middle East & Africa Market Attractiveness Analysis by Product Type
  • Figure 65: Middle East & Africa Market Value Share and BPS Analysis by Application, 2025 and 2035
  • Figure 66: Middle East & Africa Market Y to o to Y Growth Comparison by Application, 2025-2035
  • Figure 67: Middle East & Africa Market Attractiveness Analysis by Application
  • Figure 68: Global Market - Tier Structure Analysis
  • Figure 69: Global Market - Company Share Analysis
Dashboard
Dashboard
Dashboard
Dashboard
Dashboard
Dashboard

Our Research Products

Full Research Suite

The "Full Research Suite" delivers actionable market intel, deep dives on markets or technologies, so clients act faster, cut risk, and unlock growth.

Competitor Leaderboard Report

The Leaderboard benchmarks and ranks top vendors, classifying them as Established Leaders, Leading Challengers, or Disruptors & Challengers.

Future Leaders Index

Locates where complements amplify value and substitutes erode it, forecasting net impact by horizon

Market Data & Forecasts

We deliver granular, decision-grade intel: market sizing, 5-year forecasts, pricing, adoption, usage, revenue, and operational KPIs—plus competitor tracking, regulation, and value chains—across 60 countries broadly.

Market Focus Report

Spot the shifts before they hit your P&L. We track inflection points, adoption curves, pricing moves, and ecosystem plays to show where demand is heading, why it is changing, and what to do next across high-growth markets and disruptive tech

Survey Report

Real-time reads of user behavior. We track shifting priorities, perceptions of today’s and next-gen services, and provider experience, then pace how fast tech moves from trial to adoption, blending buyer, consumer, and channel inputs with social signals (#WhySwitch, #UX).

Bespoke Reports

Partner with our analyst team to build a custom report designed around your business priorities. From analysing market trends to assessing competitors or crafting bespoke datasets, we tailor insights to your needs.

Supplier Intelligence

Discovery & Profiling

Capacity & Footprint

Performance & Risk

Compliance & Governance

Commercial Readiness

Who Supplies Whom

Scorecards & Shortlists

Playbooks & Docs

Category Intelligence

Definition & Scope

Demand & Use Cases

Cost Drivers

Market Structure

Supply Chain Map

Trade & Policy

Operating Norms

Deliverables

Buyer Intelligence

Account Basics

Spend & Scope

Procurement Model

Vendor Requirements

Terms & Policies

Entry Strategy

Pain Points & Triggers

Outputs

Pricing Analysis

Benchmarks

Trends

Should-Cost

Indexation

Landed Cost

Commercial Terms

Deliverables

Brand Analysis

Positioning & Value Prop

Share & Presence

Customer Evidence

Go-to-Market

Digital & Reputation

Compliance & Trust

KPIs & Gaps

Outputs

Full Research Suite comprises of:

Market outlook & trends analysis

Market outlook & trends analysis

Interviews & case studies

Interviews & case studies

Strategic recommendations

Strategic recommendations

Vendor profiles & capabilities analysis

Vendor profiles & capabilities analysis

5-year forecasts

5-year forecasts

8 regions and 60+ country-level data splits

8 regions and 60+ country-level data splits

Market segment data splits

Market segment data splits

12 months of continuous data updates

12 months of continuous data updates

DELIVERED AS:

PDF EXCEL ONLINE

Full Research Suite


$5000

$7500

$10000

Buy Report Now
Similar Industry Reports

Similar Industry Reports

Reducing Elbow Connector Market

Reducing Elbow Connector Market Size and Share Forecast Outlook 2025 to 2035

Drag Reducing Agent Market

Drag Reducing Agent Market Size and Share Forecast Outlook 2025 to 2035

Pressure Reducing Valve Market

Pressure Reducing Valve Market Size and Share Forecast Outlook 2025 to 2035

Viscosity Reducing Agents Market

Viscosity Reducing Agents Market Size and Share Forecast Outlook 2025 to 2035

Material Shrinkage-reducing Agents Market

Material Shrinkage-reducing Agents Market Size and Share Forecast Outlook 2025 to 2035

Teeth Whitening Market

Teeth Whitening Market Size and Share Forecast Outlook 2025 to 2035

Teeth Whitening Pens Market

Teeth Whitening Pens Market - Growth, Demand & Trends 2025 to 2035

Teen Room Décor Market

Teen Room Décor Market Analysis – Growth & Demand Forecast 2025 to 2035

Teeth Desensitizer Market

Teeth Desensitizer Market Analysis by Product Type, Form, Distribution Channels and Region 2025 to 2035

Steel Drum Market
Steel Drum Market

Steel Drum Market Size and Share Forecast Outlook 2025 to 2035

Steel Drums & IBCs Market

Steel Drums & IBCs Market Size and Share Forecast Outlook 2025 to 2035

Steel Roll-on Tube Market

Steel Roll-on Tube Market Size and Share Forecast Outlook 2025 to 2035

Steel Testing Equipment Market

Steel Testing Equipment Market Size and Share Forecast Outlook 2025 to 2035

Steel Salvage Drums Market

Steel Salvage Drums Market Size and Share Forecast Outlook 2025 to 2035

Steel Wire Reinforced Polyethylene Pipe Market

Steel Wire Reinforced Polyethylene Pipe Market Size and Share Forecast Outlook 2025 to 2035

Steerable Needle Market

Steerable Needle Market Size and Share Forecast Outlook 2025 to 2035

Steel Wire Market
Steel Wire Market

Steel Wire Market Size and Share Forecast Outlook 2025 to 2035

Steel Strapping Market

Steel Strapping Market Size and Share Forecast Outlook 2025 to 2035

Steel Drum Industry Analysis in Southeast Asia

Steel Drum Industry Analysis in Southeast Asia Size and Share Forecast Outlook 2025 to 2035

Steel Studs Market
Steel Studs Market

Steel Studs Market Size and Share Forecast Outlook 2025 to 2035

Future Market Insights

Reducing Tee Connector Market

Chat With MaRIA

Chat With

MaRIA

Hi There, I am MaRIA, Your Market Research Intelligence Assistant. How may I help you?