Reports

- Global Locations -

Headquarters

Future Market Insights, Inc.

Christiana Corporate, 200
Continental Drive, Suite 401,
Newark, Delaware - 19713,
United States

T: +1-845-579-5705

Americas

Future Market Insights, Inc.

616 Corporate Way, Suite 2-9018,
Valley Cottage, NY 10989, United States

T: +1-347-918-3531

MEA

Future Market Insights

1602-6 Jumeirah Bay X2 Tower, Plot No: JLT-PH2-X2A,
Jumeirah Lakes Towers, Dubai,
United Arab Emirates

Europe

Future Market Insights

3rd Floor, 207 Regent Street,
W1B 3HH London
United Kingdom

T: + 44 (0) 20 8123 9659
D: +44 (0) 20 3287 4268

Asia Pacific

Future Market Insights

IndiaLand Global Tech Park, Unit UG-1, Behind Grand HighStreet, Phase 1, Hinjawadi, MH, Pune – 411057, India

Teeth Whitening Pens Market Snapshot

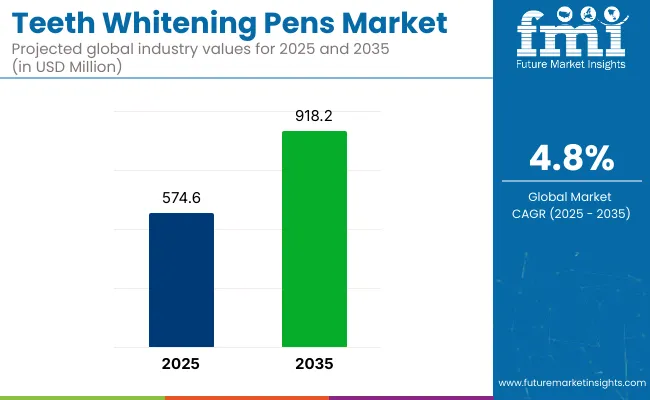
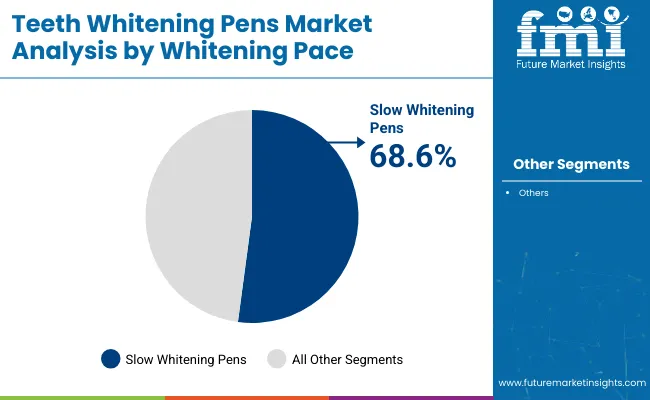
The global teeth whitening pens market is expected to enjoy a valuation of US$ 501.5 Million by the end of the year 2022, and further expand at a CAGR rate of 4.8% to reach a valuation of US$ 830.9 Million by the year 2033. According to a recent study by Future Market Insights, slow whitening segment held 68.6% of the global market share in 2022.

Market Outlook:

Data Points Market Insights
Market Value 2022 US$ 501.5 Million
Market Value 2023 US$ 522.3 Million
Market Value 2033 US$ 830.9 Million
CAGR 2023 to 2033 4.8%
Market Share of Top 5 Countries 50.5%
Key Market Players Procter & Gamble, Colgate - Palmolive Company, Koninklijke Phillips N.V., SmileDirectClub Inc., BleachBright, White Glo, Whiter Image, Dr. Fresh LLC, Tarte Cosmetics, Cavex Holland BV, Spotlight Oral Care, Lumineux Health, Perfora, Moon Oral Care, GO SMILE, Auraglow, Smilebriter, Keeko, Beaming White, LLC., and Mr. Bright Smile

Teeth whitening pens are a type of cosmetic treatment that uses a pen-like applicator to apply a bleaching solution directly onto the surface of the teeth to brighten the color of the teeth. The bleaching chemical commonly utilized in teeth whitening pens are hydrogen peroxide or carbamide peroxide, which works to eliminate stains and discoloration on the surface of the teeth.

Teeth whitening pens are marketed as an efficient solution for teeth whitening at home or while on the go because they are made to be compact and portable to use. They are lightweight and small, making them perfect for touch-ups during the day or for travel.

Don't pay for what you don't need

Customize your report by selecting specific countries or regions and save 30%!

Sales Analysis of Teeth Whitening Pens Market from 2017 to 2022 Vs Market Outlook for 2023 to 2033

The market value for teeth whitening pen was approximately 7.3% of the overall US$ 6.9 Billion of the global teeth whitening market in 2022.

The sale of teeth whitening pen expanded at a CAGR of 3.7% from 2017 to 2022, due to the increasing demand for at-home teeth whitening solutions.

Teeth whitening pens offer an affordable and effective solution for consumers who want to improve the appearance of their teeth. With more disposable income, consumers are willing to spend on these products to achieve a brighter, whiter smile. This trend is especially evident among Millennials and Gen Z, who are placing an increasing emphasis on personal care and appearance.

  • Teeth whitening pens are considered a safe and convenient way to achieve a whiter smile without the need for expensive dental procedures. This has made whitening pens more attractive to a wider range of consumers, regardless of their income level.

Another factor contributing to the increasing demand for teeth-whitening pens is the rise of social media and the importance of appearance in today's society. Many people feel that having a bright, white smile is essential for social and professional success, and a teeth whitening pen can help them achieve this look.

  • The availability of a wide range of teeth whitening pens, including over-the-counter options, has made it easier for people to access these products and incorporate them into their daily oral hygiene routine.

The growing awareness of teeth whitening pens among the general population is likely to increase sales of such products and devices by driving demand, creating opportunities for innovation, and creating a more regular market for dental professionals.

  • As more people become aware of the benefits of teeth whitening, they are likely to seek out these products and devices to improve the appearance of their teeth. This increased demand can drive sales for both over-the-counter and professional teeth whitening products.
  • The growing awareness of teeth-whitening pens can also create opportunities for dental professionals. As more people seek out teeth whitening treatments, dentists and dental hygienists can offer these services as part of their practice, increasing revenue and customer satisfaction.
  • Thus, owing to such factors, the global teeth whitening pens market is expected to grow at a CAGR of 4.8% during the forecast period.

What are the Key Opportunities for the Teeth Whitening Pen Manufacturers?

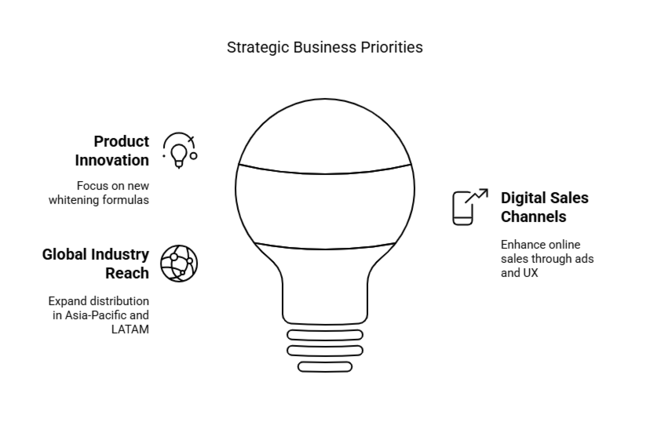
Expanding into emerging markets increases the potential customer base for manufacturers. As more people in these markets become aware of teeth whitening products, there is likely to be an increase in demand for teeth whitening pens, which can drive sales and revenue growth.

  • Entering new markets often requires manufacturers to adapt their products to meet the needs and preferences of local consumers. This can lead to new product innovations, such as new flavors, packaging, or formulations that are more appealing to consumers in these markets.

Innovative products are often unique and offer features that are not currently available on the market. This can create a buzz among consumers and generate interest in the product category, leading to increased sales and demand.

  • By offering innovative products, companies can differentiate themselves from competitors and stand out in a crowded market. This can lead to increased market share and revenue growth.

Expanding e-commerce channels can be a smart strategy for manufacturers in the teeth whitening pens market to increase their reach, attract new customers, and drive sales growth.

  • E-commerce channels allow manufacturers to reach a wider audience beyond their physical retail locations. This can increase the potential customer base and drive sales growth.
  • E-commerce channels offer convenience to consumers, allowing them to shop from anywhere at any time. This can attract more customers to the market.
Sabyasachi Ghosh
Sabyasachi Ghosh

Principal Consultant

Talk to Analyst

Find your sweet spots for generating winning opportunities in this market.

What are the Factors Restraining the Demand for the Teeth Whitening Pens?

The availability of alternatives can constrain the adoption of teeth whitening pens in teeth whitening procedures in a few ways. Some consumers may prefer other teeth whitening options, such as professional teeth whitening treatments or over-the-counter whitening kits, over teeth whitening pens. This could be due to factors such as perceived effectiveness, speed of results, or ease of use.

Economic factors such as economic recession, changes in manufacturing costs, and insurance coverage could potentially restrict the utilization of teeth whitening pens by impacting consumer demand and affordability.

  • During times of economic recession or financial hardship, consumers may prioritize essential expenses over non-essential ones. Teeth whitening pens, as a cosmetic product, may be considered a non-essential expense and may be less likely to be purchased during times of economic hardship.

Legal and regulatory barriers could potentially limit the growth of the market in certain ways. One potential barrier is regulatory requirements for teeth whitening products, which could include restrictions on the ingredients used, labeling requirements, and safety testing requirements. Compliance with these regulations can be costly and time-consuming, which could limit the number of companies that are able to enter the market or increase the cost of producing teeth-whitening pens.

Country-wise Insights

What Makes the USA a Large Market for Teeth Whitening Pen?

In 2022, the U.S. held a dominant share of in the North American market and contributed around US$ 138.4 Million in 2022.

The U.S. is a large market for teeth whitening pens due to several factors, including a culture that places a high value on physical appearance and cosmetic treatments. Also, there is a growing demand for at-home teeth whitening products that are convenient and affordable, which has contributed to the popularity of teeth whitening pens. Another factor influencing the market is the widespread availability of teeth whitening pens in retail stores and online platforms have made them easily accessible to consumers.

What Makes China a Highly Lucrative Market for Teeth Whitening Pen?

China holds nearly 8.4% market share in the global teeth whitening pens market in 2022, and is projected to display growth at a CAGR of 6.6% during the forecasted period.

China is a highly lucrative market for teeth whitening pens due to its large population, increasing disposable income, and growing interest in oral health and hygiene. Additionally, there is a strong cultural emphasis on physical appearance in China, which has contributed to the popularity of cosmetic dental treatments. The rise of e-commerce platforms in China has also made it easier for consumers to access and purchase teeth whitening pens online.

What Factors Are Driving the German Market for Teeth Whitening Pens?

Germany accounted for a market value share of around 4.3% in 2022, in the global teeth whitening pens market.

The German market for teeth whitening pens is driven by factors such as the country's increasing focus on dental hygiene, highly aware population, which creates greater demands for cosmetic dental treatments. The availability of teeth whitening pens in retail stores and online platforms has also catered with the consumer’s demands. Additionally, the German market is known for its high standards of product quality and safety, which has led to the development of high-quality teeth whitening products that appeal to consumers.

Get the data you need at a Fraction of the cost

Personalize your report by choosing insights you need
and save 40%!

Category-wise Insights

Why Carbamide Peroxide based Pens are the Leading Teeth Whitening Solution?

Carbamide peroxide based pens dominated the bleach type segment by holding the major chunk of the segment at about 60.5% by the end of 2022. Carbamide peroxide based pens are a leading teeth whitening solution because they are effective at removing stains and discoloration, while being safe for home use. The teeth whitening pens market continues to grow due to the rising demand for affordable and convenient at-home teeth whitening solutions.

Which segment of Whitening Pace is Aiding the Global Market to Propel?

The slow whitening segment held a revenue share of around 68.6% in 2022 globally.

Slow whitening teeth whitening pens are often preferred over on-the-go whitening pens because they tend to produce more noticeable results. Slow whitening pens are typically used for several days or weeks, and the results gradually become more apparent over time. In contrast, on-the-go whitening pens are designed for quick touch-ups and may not be as effective for long-term whitening. Additionally, slow whitening pens may be more affordable than on-the-go pens, which makes them a popular choice for at-home teeth whitening.

Which Sub-Segment of Sensitivity Type is Benefiting the Growth of the Global Market?

General teeth whitening segment held the highest market share of 59.2% in 2022 and is expected to grow at a CAGR of 4.1% in the projected period. Teeth whitening pens are generally utilized for general teeth whitening over sensitive teeth whitening because they contain a lower concentration of bleaching agents that are less likely to cause tooth sensitivity. Additionally, many consumers prefer the convenience and affordability of general teeth whitening pens, which has contributed to their widespread use.

Which Distribution Channel is Benefiting the Global Market?

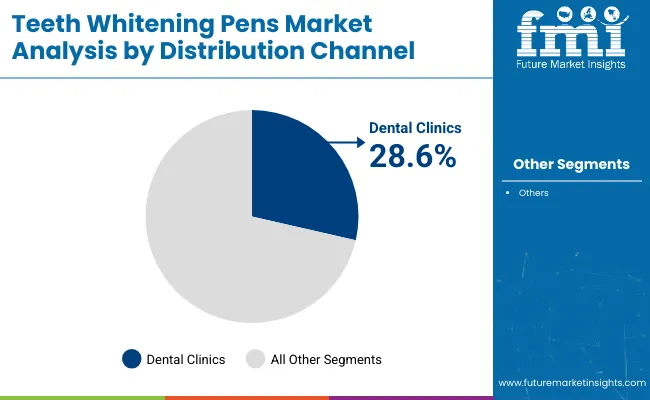
Dental clinics held a market share of around 28.6% in 2022 globally. Dental clinics often market and sell teeth whitening pens as a complementary service to their patients during routine appointments or as a take-home product. Also, dental clinics are able to provide professional guidance and recommendations to their patients, which is a valuable advantage in marketing teeth whitening pens.

Competitive Landscape

In the teeth whitening pens market, the key players are adopting different strategies to raise their sales and gain revenue. To meet the demand of the consumers and expand, these firms are making technological advancements for new product launches. Apart from that, the manufacturers are making distribution agreements and acquiring companies to reach a larger consumer base.

A few of these strategies undertaken by the market players in the teeth whitening pens market are:

  • In December 2021, P&G acquired OULA, a cosmetic product manufacturing company.
  • In January 2022, Colgate-Palmolive partnered with 3Shape to deliver an innovative, personalized tooth whitening experience with the 3Shape Unite platform.

Similarly, recent developments related to the companies manufacturing the teeth whitening pens have been tracked by the team at Future Market Insights, which are available in the full report

Report Scope as Per Teeth Whitening Pens Industry Analysis

Attribute Details
Forecast Period 2023 to 2033
Historical Data Available for 2017 to 2022
Market Analysis US$ Million for Value
Key Regions Covered North America, Latin America, East Asia, South Asia & Pacific, Western Europe, Eastern Europe, Central Asia, Russia & Belarus, Balkan & Baltic Countries, Middle East and Africa (MEA)
Key Countries Covered USA, Canada, Brazil, Mexico, Argentina, China, Japan, South Korea, India, Indonesia, Thailand, Philippines, Malaysia, Vietnam, Australia & New Zealand, Germany, France, Spain, Italy, BENELUX, Nordic Countries, UK, Poland, Hungary, Romania, Czech Republic, Russia, Belarus, GCC Countries, Northern Africa, South Africa, Israel
Key Market Segments Covered Bleach Type, Whitening Pace, Sensitivity Type, Distribution Channel, and Region
Key Companies Profiled
  • Procter & Gamble
  • Colgate - Palmolive Company
  • Koninkiljke Phillips N.V.
  • SmileDirectClub Inc.
  • BleachBright
  • White Glo
  • Whiter Image
  • Dr. Fresh LLC
  • Tarte Cosmetics
  • Cavex Holland BV
  • Spotlight Oral Care
  • Lumineux Health
  • Perfora
  • Moon Oral Care
  • GO SMILE
  • Auraglow
  • Smilebriter
  • Keeko
  • Beaming White, LLC.
  • Mr. Bright Smile
Pricing Available upon Request

Frequently Asked Questions

How Big is the Teeth Whitening Pens Market by the End of 2023?

The global industry is likely to reach US$ 522.3 million by the end of 2023.

Who are the Key Teeth Whitening Pens Industry players?

Procter & Gamble, Colgate - Palmolive Company, and Koninklijke Phillips N.V., are the key industry players.

Which will be the Key Segment by Bleach Type in the Teeth Whitening Pens Industry?

The carbamide peroxide based pens segment is estimated to lead industry through 2033.

How was the Global Teeth Whitening Pens Market’s Historical Performance?

The market registered a 3.7% CAGR from 2018 to 2022.

What is the Expected CAGR of China’s Teeth Whitening Pens Market?

China is expected to thrive at a CAGR of 6.6% CAGR through 2033.

Table of Content

1. Executive Summary

    1.1. Global Market Outlook

    1.2. Demand Side Trends

    1.3. Supply-Side Trends

    1.4. Analysis and Recommendations

2. Market Overview

    2.1. Market Coverage / Taxonomy

    2.2. Market Definition / Scope / Limitations

    2.3. Inclusions and Exclusions

3. Key Market Trends

    3.1. Key Trends Impacting the Market

    3.2. Development/Innovation Trends

4. Value-Added Insights

    4.1. Product Alternatives Assessment

        4.1.1. Toothpaste

        4.1.2. Strips

        4.1.3. Floss

        4.1.4. LED System

        4.1.5. Powder

        4.1.6. Kits

        4.1.7. Trays

    4.2. Product Adoption / Usage Analysis

    4.3. Regulatory Landscape, By Country

    4.4. Technology Advancements

    4.5. Value Chain Analysis

    4.6. PESTLE Analysis, By Region

    4.7. Porter’s Analysis

5. Market Background

    5.1. Macro-Economic Factors

        5.1.1. Global GDP Growth Outlook

        5.1.2. Global Healthcare Expenditure Outlook

        5.1.3. Global Life Expectancy Outlook

        5.1.4. Global Teeth Whitening Market Overview

    5.2. Forecast Factors - Relevance & Impact

        5.2.1. Per-Capita Spend on Teeth Whitening

        5.2.2. Mean Disposable Household Income

        5.2.3. Prevalence of Poor Oral Hygiene

        5.2.4. Percentage of Population consuming Tobacco, Coffee & Cigarette opting for Teeth Whitening Services

        5.2.5. Percentage of the Population using Teeth Whitening For Cosmetic Dentistry treatments

        5.2.6. Product Adoption/Usage Rate

        5.2.7. Growing Dental Aesthetics Product Awareness and Demand in emerging markets

        5.2.8. Growing R&D by marketers

        5.2.9. New Product Launches

        5.2.10. Cost of Product

    5.3. Market Dynamics

        5.3.1. Drivers

        5.3.2. Restraints

        5.3.3. Opportunity Analysis

6. COVID-19 Crisis - Impact Assessment

    6.1. COVID-19 and Impact Analysis

        6.1.1. By Bleach Type

        6.1.2. By Whitening Pace

        6.1.3. By Sensitivity Type

        6.1.4. By Distribution Channel

        6.1.5. By Region

    6.2. 2021 Market Scenario

7. Global Market Demand Volume (‘000 Units) Analysis 2017 to 2022 and Forecast, 2023 to 2033

    7.1. Historical Market Volume (‘000 Units) Analysis, 2017 to 2022

    7.2. Current and Future Market Volume (‘000 Units) Projections, 2023 to 2033

        7.2.1. Y-o-Y Growth Trend Analysis

8. Global Market - Pricing Analysis

    8.1. Global Average Pricing Analysis Benchmark

    8.2. Regional Average Pricing Analysis Benchmark

    8.3. Pricing Assumptions

9. Global Market Demand Value or Size (US$ Million) Analysis 2017 to 2022 and Forecast, 2023 to 2033

    9.1. Historical Market Value (US$ Million) Analysis, 2017 to 2022

    9.2. Current and Future Market Value (US$ Million) Projections, 2023 to 2033

        9.2.1. Y-o-Y Growth Trend Analysis

        9.2.2. Absolute $ Opportunity Analysis

10. Global Market Analysis 2017 to 2022 and Forecast 2023 to 2033, By Bleach Type

    10.1. Introduction / Key Findings

    10.2. Historical Market Size (US$ Million) Volume (‘000 Units) Analysis By Bleach Type, 2017 to 2022

    10.3. Current and Future Market Size (US$ Million) Volume (‘000 Units) Analysis and Forecast By Bleach Type, 2023 to 2033

        10.3.1. Hydrogen Peroxide-based Pens

        10.3.2. Carbamide Peroxide-based Pens

    10.4. Market Attractiveness Analysis By Bleach Type

11. Global Market Analysis 2017 to 2022 and Forecast 2023 to 2033, By Whitening Pace

    11.1. Introduction / Key Findings

    11.2. Historical Market Size (US$ Million) Analysis By Whitening Pace, 2017 to 2022

    11.3. Current and Future Market Size (US$ Million) Analysis and Forecast By Whitening Pace, 2023 to 2033

        11.3.1. On-the-Go Whitening

        11.3.2. Slow Whitening

    11.4. Market Attractiveness Analysis By Whitening Pace

12. Global Market Analysis 2017 to 2022 and Forecast 2023 to 2033, By Sensitivity Type

    12.1. Introduction / Key Findings

    12.2. Historical Market Size (US$ Million) Analysis By Sensitivity Type, 2017 to 2022

    12.3. Current and Future Market Size (US$ Million) Analysis and Forecast By Sensitivity Type, 2023 to 2033

        12.3.1. Sensitive Teeth Whitening

        12.3.2. General Teeth Whitening

    12.4. Market Attractiveness Analysis By Sensitivity Type

13. Global Market Analysis 2017 to 2022 and Forecast 2023 to 2033, By Distribution Channel

    13.1. Introduction / Key Findings

    13.2. Historical Market Size (US$ Million) Analysis By Distribution Channel, 2017 to 2022

    13.3. Current and Future Market Size (US$ Million) Analysis and Forecast By Distribution Channel, 2023 to 2033

        13.3.1. Hospitals

        13.3.2. Dental Clinics

        13.3.3. Hypermarkets/Supermarkets

        13.3.4. Retail Pharmacy Sales

        13.3.5. e-Commerce

            13.3.5.1. Manufacturers' Websites

            13.3.5.2. Aggregator's Websites

    13.4. Market Attractiveness Analysis By Distribution Channel

14. Global Market Analysis 2017 to 2022 and Forecast 2023 to 2033, By Region

    14.1. Introduction

    14.2. Historical Market Size (US$ Million) & Volume (‘000 Units) Trend Analysis By Region, 2017 to 2022

    14.3. Current and Future Market Size (US$ Million) & Volume (‘000 Units) Analysis and Forecast by Region, 2023 to 2033

        14.3.1. North America

        14.3.2. Latin America

        14.3.3. East Asia

        14.3.4. South Asia & Pacific

        14.3.5. Western Europe

        14.3.6. Eastern Europe

        14.3.7. Central Asia

        14.3.8. Russia & Belarus

        14.3.9. Balkan & Baltic Countries

        14.3.10. Middle East & Africa

    14.4. Market Attractiveness Analysis By Region

15. North America Market Analysis 2017 to 2022 and Forecast 2023 to 2033

    15.1. Introduction

    15.2. Historical Market Size (US$ Million) and Volume (‘000 Units) Trend Analysis by Market Taxonomy, 2017 to 2022

    15.3. Current and Future Market Size (US$ Million) Volume (‘000 Units) Analysis and Forecast by Market Taxonomy, 2023 to 2033

        15.3.1. By Country

            15.3.1.1. United States of America

            15.3.1.2. Canada

        15.3.2. By Bleach Type

        15.3.3. By Whitening Pace

        15.3.4. By Sensitivity Type

        15.3.5. By Distribution Channel

    15.4. Market Attractiveness Analysis

        15.4.1. By Country

        15.4.2. By Bleach Type

        15.4.3. By Whitening Pace

        15.4.4. By Sensitivity Type

        15.4.5. By Distribution Channel

    15.5. Market Trends

    15.6. Key Market Participants - Intensity Mapping

    15.7. Drivers and Restraints - Impact Analysis

    15.8. Country-Level Analysis & Forecast

        15.8.1. United States of America Market Analysis

            15.8.1.1. Introduction

            15.8.1.2. Market Analysis and Forecast by Market Taxonomy

                15.8.1.2.1. By Bleach Type

                15.8.1.2.2. By Whitening Pace

                15.8.1.2.3. By Sensitivity Type

                15.8.1.2.4. By Distribution Channel

        15.8.2. Canada Market Analysis

            15.8.2.1. Introduction

            15.8.2.2. Market Analysis and Forecast by Market Taxonomy

                15.8.2.2.1. By Bleach Type

                15.8.2.2.2. By Whitening Pace

                15.8.2.2.3. By Sensitivity Type

                15.8.2.2.4. By Distribution Channel

16. Latin America Market Analysis 2017 to 2022 and Forecast 2023 to 2033

    16.1. Introduction

    16.2. Historical Market Size (US$ Million) Volume (‘000 Units) Trend Analysis By Market Taxonomy, 2017 to 2022

    16.3. Current and Future Market Size (US$ Million) Volume (‘000 Units) Analysis and Forecast by Market Taxonomy, 2023 to 2033

        16.3.1. By Country

            16.3.1.1. Brazil

            16.3.1.2. Mexico

            16.3.1.3. Argentina

            16.3.1.4. Rest of Latin America

        16.3.2. By Bleach Type

        16.3.3. By Whitening Pace

        16.3.4. By Sensitivity Type

        16.3.5. By Distribution Channel

    16.4. Market Attractiveness Analysis

        16.4.1. By Bleach Type

        16.4.2. By Whitening Pace

        16.4.3. By Sensitivity Type

        16.4.4. By Distribution Channel

    16.5. Market Trends

    16.6. Key Market Participants - Intensity Mapping

    16.7. Drivers and Restraints - Impact Analysis

    16.8. Country-Level Analysis & Forecast

        16.8.1. Brazil Market Analysis

            16.8.1.1. Introduction

            16.8.1.2. Market Analysis and Forecast by Market Taxonomy

                16.8.1.2.1. By Bleach Type

                16.8.1.2.2. By Whitening Pace

                16.8.1.2.3. By Sensitivity Type

                16.8.1.2.4. By Distribution Channel

        16.8.2. Mexico Market Analysis

            16.8.2.1. Introduction

            16.8.2.2. Market Analysis and Forecast by Market Taxonomy

                16.8.2.2.1. By Bleach Type

                16.8.2.2.2. By Whitening Pace

                16.8.2.2.3. By Sensitivity Type

                16.8.2.2.4. By Distribution Channel

        16.8.3. Argentina Market Analysis

            16.8.3.1. Introduction

            16.8.3.2. Market Analysis and Forecast by Market Taxonomy

                16.8.3.2.1. By Bleach Type

                16.8.3.2.2. By Whitening Pace

                16.8.3.2.3. By Sensitivity Type

                16.8.3.2.4. By Distribution Channel

17. East Asia Market Analysis 2017 to 2022 and Forecast 2023 to 2033

    17.1. Introduction

    17.2. Historical Market Size (US$ Million) Volume (‘000 Units) Trend Analysis By Market Taxonomy, 2017 to 2022

    17.3. Current and Future Market Size (US$ Million) Volume (‘000 Units) Analysis and Forecast by Market Taxonomy, 2023 to 2033

        17.3.1. By Country

            17.3.1.1. China

            17.3.1.2. Japan

            17.3.1.3. South Korea

        17.3.2. By Bleach Type

        17.3.3. By Whitening Pace

        17.3.4. By Sensitivity Type

        17.3.5. By Distribution Channel

    17.4. Market Attractiveness Analysis

        17.4.1. By Bleach Type

        17.4.2. By Whitening Pace

        17.4.3. By Sensitivity Type

        17.4.4. By Distribution Channel

    17.5. Market Trends

    17.6. Key Market Participants - Intensity Mapping

    17.7. Drivers and Restraints - Impact Analysis

    17.8. Country-Level Analysis & Forecast

        17.8.1. China Market Analysis

            17.8.1.1. Introduction

            17.8.1.2. Market Analysis and Forecast by Market Taxonomy

                17.8.1.2.1. By Bleach Type

                17.8.1.2.2. By Whitening Pace

                17.8.1.2.3. By Sensitivity Type

                17.8.1.2.4. By Distribution Channel

        17.8.2. Japan Market Analysis

            17.8.2.1. Introduction

            17.8.2.2. Market Analysis and Forecast by Market Taxonomy

                17.8.2.2.1. By Bleach Type

                17.8.2.2.2. By Whitening Pace

                17.8.2.2.3. By Sensitivity Type

                17.8.2.2.4. By Distribution Channel

        17.8.3. South Korea Market Analysis

            17.8.3.1. Introduction

            17.8.3.2. Market Analysis and Forecast by Market Taxonomy

                17.8.3.2.1. By Bleach Type

                17.8.3.2.2. By Whitening Pace

                17.8.3.2.3. By Sensitivity Type

                17.8.3.2.4. By Distribution Channel

18. South Asia & Pacific Market Analysis 2017 to 2022 and Forecast 2023 to 2033

    18.1. Introduction

    18.2. Historical Market Size (US$ Million) Volume (‘000 Units) Trend Analysis By Market Taxonomy, 2017 to 2022

    18.3. Current and Future Market Size (US$ Million) Volume (‘000 Units) Analysis and Forecast by Market Taxonomy, 2023 to 2033

        18.3.1. By Country

            18.3.1.1. India

            18.3.1.2. Indonesia

            18.3.1.3. Thailand

            18.3.1.4. Philippines

            18.3.1.5. Malaysia

            18.3.1.6. Vietnam

            18.3.1.7. Rest of ASEAN

            18.3.1.8. Australia & New Zealand

        18.3.2. By Bleach Type

        18.3.3. By Whitening Pace

        18.3.4. By Sensitivity Type

        18.3.5. By Distribution Channel

    18.4. Market Attractiveness Analysis

        18.4.1. By Bleach Type

        18.4.2. By Whitening Pace

        18.4.3. By Sensitivity Type

        18.4.4. By Distribution Channel

    18.5. Market Trends

    18.6. Key Market Participants - Intensity Mapping

    18.7. Drivers and Restraints - Impact Analysis

    18.8. Country-Level Analysis & Forecast

        18.8.1. India Market Analysis

            18.8.1.1. Introduction

            18.8.1.2. Market Analysis and Forecast by Market Taxonomy

                18.8.1.2.1. By Bleach Type

                18.8.1.2.2. By Whitening Pace

                18.8.1.2.3. By Sensitivity Type

                18.8.1.2.4. By Distribution Channel

        18.8.2. Indonesia Market Analysis

            18.8.2.1. Introduction

            18.8.2.2. Market Analysis and Forecast by Market Taxonomy

                18.8.2.2.1. By Bleach Type

                18.8.2.2.2. By Whitening Pace

                18.8.2.2.3. By Sensitivity Type

                18.8.2.2.4. By Distribution Channel

        18.8.3. Thailand Market Analysis

            18.8.3.1. Introduction

            18.8.3.2. Market Analysis and Forecast by Market Taxonomy

                18.8.3.2.1. By Bleach Type

                18.8.3.2.2. By Whitening Pace

                18.8.3.2.3. By Sensitivity Type

                18.8.3.2.4. By Distribution Channel

        18.8.4. Philippines Market Analysis

            18.8.4.1. Introduction

            18.8.4.2. Market Analysis and Forecast by Market Taxonomy

                18.8.4.2.1. By Bleach Type

                18.8.4.2.2. By Whitening Pace

                18.8.4.2.3. By Sensitivity Type

                18.8.4.2.4. By Distribution Channel

        18.8.5. Malaysia Market Analysis

            18.8.5.1. Introduction

            18.8.5.2. Market Analysis and Forecast by Market Taxonomy

                18.8.5.2.1. By Bleach Type

                18.8.5.2.2. By Whitening Pace

                18.8.5.2.3. By Sensitivity Type

                18.8.5.2.4. By Distribution Channel

        18.8.6. Vietnam Market Analysis

            18.8.6.1. Introduction

            18.8.6.2. Market Analysis and Forecast by Market Taxonomy

                18.8.6.2.1. By Bleach Type

                18.8.6.2.2. By Whitening Pace

                18.8.6.2.3. By Sensitivity Type

                18.8.6.2.4. By Distribution Channel

        18.8.7. Australia & New Zealand Market Analysis

            18.8.7.1. Introduction

            18.8.7.2. Market Analysis and Forecast by Market Taxonomy

                18.8.7.2.1. By Bleach Type

                18.8.7.2.2. By Whitening Pace

                18.8.7.2.3. By Sensitivity Type

                18.8.7.2.4. By Distribution Channel

19. Western Europe Market 2017 to 2022 and Forecast 2023 to 2033

    19.1. Introduction

    19.2. Historical Market Size (US$ Million) Volume (‘000 Units) Trend Analysis By Market Taxonomy, 2017 to 2022

    19.3. Current and Future Market Size (US$ Million) Volume (‘000 Units) Analysis and Forecast by Market Taxonomy, 2023 to 2033

        19.3.1. By Country

            19.3.1.1. Germany

            19.3.1.2. France

            19.3.1.3. Spain

            19.3.1.4. Italy

            19.3.1.5. BENELUX

            19.3.1.6. Nordics

            19.3.1.7. United Kingdom

        19.3.2. By Bleach Type

        19.3.3. By Whitening Pace

        19.3.4. By Sensitivity Type

        19.3.5. By Distribution Channel

    19.4. Market Attractiveness Analysis

        19.4.1. By Country

        19.4.2. By Bleach Type

        19.4.3. By Whitening Pace

        19.4.4. By Sensitivity Type

        19.4.5. By Distribution Channel

    19.5. Market Trends

    19.6. Key Market Participants - Intensity Mapping

    19.7. Drivers and Restraints - Impact Analysis

    19.8. Country-Level Analysis & Forecast

        19.8.1. Germany Market Analysis

            19.8.1.1. Introduction

            19.8.1.2. Market Analysis and Forecast by Market Taxonomy

                19.8.1.2.1. By Bleach Type

                19.8.1.2.2. By Whitening Pace

                19.8.1.2.3. By Sensitivity Type

                19.8.1.2.4. By Distribution Channel

        19.8.2. France Market Analysis

            19.8.2.1. Introduction

            19.8.2.2. Market Analysis and Forecast by Market Taxonomy

                19.8.2.2.1. By Bleach Type

                19.8.2.2.2. By Whitening Pace

                19.8.2.2.3. By Sensitivity Type

                19.8.2.2.4. By Distribution Channel

        19.8.3. Spain Market Analysis

            19.8.3.1. Introduction

            19.8.3.2. Market Analysis and Forecast by Market Taxonomy

                19.8.3.2.1. By Bleach Type

                19.8.3.2.2. By Whitening Pace

                19.8.3.2.3. By Sensitivity Type

                19.8.3.2.4. By Distribution Channel

        19.8.4. Italy Market Analysis

            19.8.4.1. Introduction

            19.8.4.2. Market Analysis and Forecast by Market Taxonomy

                19.8.4.2.1. By Bleach Type

                19.8.4.2.2. By Whitening Pace

                19.8.4.2.3. By Sensitivity Type

                19.8.4.2.4. By Distribution Channel

        19.8.5. BENELUX Market Analysis

            19.8.5.1. Introduction

            19.8.5.2. Market Analysis and Forecast by Market Taxonomy

                19.8.5.2.1. By Bleach Type

                19.8.5.2.2. By Whitening Pace

                19.8.5.2.3. By Sensitivity Type

                19.8.5.2.4. By Distribution Channel

        19.8.6. Nordic Countries Market Analysis

            19.8.6.1. Introduction

            19.8.6.2. Market Analysis and Forecast by Market Taxonomy

                19.8.6.2.1. By Bleach Type

                19.8.6.2.2. By Whitening Pace

                19.8.6.2.3. By Sensitivity Type

                19.8.6.2.4. By Distribution Channel

        19.8.7. United Kingdom Market Analysis

            19.8.7.1. Introduction

            19.8.7.2. Market Analysis and Forecast by Market Taxonomy

                19.8.7.2.1. By Bleach Type

                19.8.7.2.2. By Whitening Pace

                19.8.7.2.3. By Sensitivity Type

                19.8.7.2.4. By Distribution Channel

20. Eastern Europe Market Analysis 2017 to 2022 and Forecast 2023 to 2033

    20.1. Introduction

    20.2. Historical Market Size (US$ Million) Volume (‘000 Units) Trend Analysis By Market Taxonomy, 2017 to 2022

    20.3. Current and Future Market Size (US$ Million) Volume (‘000 Units) Analysis and Forecast by Market Taxonomy, 2023 to 2033

        20.3.1. By Country

            20.3.1.1. Poland

            20.3.1.2. Hungary

            20.3.1.3. Romania

            20.3.1.4. Czech Republic

            20.3.1.5. Others

        20.3.2. By Bleach Type

        20.3.3. By Whitening Pace

        20.3.4. By Sensitivity Type

        20.3.5. By Distribution Channel

    20.4. Market Attractiveness Analysis

        20.4.1. By Country

        20.4.2. By Bleach Type

        20.4.3. By Whitening Pace

        20.4.4. By Sensitivity Type

        20.4.5. By Distribution Channel

    20.5. Market Trends

    20.6. Key Market Participants - Intensity Mapping

    20.7. Drivers and Restraints - Impact Analysis

    20.8. Country-Level Analysis & Forecast

        20.8.1. Poland Market Analysis

            20.8.1.1. Introduction

            20.8.1.2. Market Analysis and Forecast by Market Taxonomy

                20.8.1.2.1. By Bleach Type

                20.8.1.2.2. By Whitening Pace

                20.8.1.2.3. By Sensitivity Type

                20.8.1.2.4. By Distribution Channel

        20.8.2. Hungary Market Analysis

            20.8.2.1. Introduction

            20.8.2.2. Market Analysis and Forecast by Market Taxonomy

                20.8.2.2.1. By Bleach Type

                20.8.2.2.2. By Whitening Pace

                20.8.2.2.3. By Sensitivity Type

                20.8.2.2.4. By Distribution Channel

        20.8.3. Romania Market Analysis

            20.8.3.1. Introduction

            20.8.3.2. Market Analysis and Forecast by Market Taxonomy

                20.8.3.2.1. By Bleach Type

                20.8.3.2.2. By Whitening Pace

                20.8.3.2.3. By Sensitivity Type

                20.8.3.2.4. By Distribution Channel

        20.8.4. Czech Republic Market Analysis

            20.8.4.1. Introduction

            20.8.4.2. Market Analysis and Forecast by Market Taxonomy

                20.8.4.2.1. By Bleach Type

                20.8.4.2.2. By Whitening Pace

                20.8.4.2.3. By Sensitivity Type

                20.8.4.2.4. By Distribution Channel

21. Central Asia Market Analysis 2017 to 2022 and Forecast 2023 to 2033

    21.1. Introduction

    21.2. Historical Market Size (US$ Million) Volume (‘000 Units) Trend Analysis By Market Taxonomy, 2017 to 2022

    21.3. Current and Future Market Size (US$ Million) Volume (‘000 Units) Analysis and Forecast by Market Taxonomy, 2023 to 2033

        21.3.1. By Bleach Type

        21.3.2. By Whitening Pace

        21.3.3. By Sensitivity Type

        21.3.4. By Distribution Channel

    21.4. Market Attractiveness Analysis

        21.4.1. By Bleach Type

        21.4.2. By Whitening Pace

        21.4.3. By Sensitivity Type

        21.4.4. By Distribution Channel

    21.5. Market Trends

    21.6. Key Market Participants - Intensity Mapping

    21.7. Drivers and Restraints - Impact Analysis

22. Russia & Belarus Market Analysis 2017 to 2022 and Forecast 2023 to 2033

    22.1. Introduction

    22.2. Historical Market Size (US$ Million) Trend Volume (‘000 Units) Analysis By Market Taxonomy, 2017 to 2022

    22.3. Current and Future Market Size (US$ Million) Volume (‘000 Units) Analysis and Forecast by Market Taxonomy, 2023 to 2033

        22.3.1. By Bleach Type

        22.3.2. By Whitening Pace

        22.3.3. By Sensitivity Type

        22.3.4. By Distribution Channel

    22.4. Market Attractiveness Analysis

        22.4.1. By Bleach Type

        22.4.2. By Whitening Pace

        22.4.3. By Sensitivity Type

        22.4.4. By Distribution Channel

    22.5. Market Trends

    22.6. Key Market Participants - Intensity Mapping

    22.7. Drivers and Restraints - Impact Analysis

23. Balkan & Baltic Countries Market Analysis 2017 to 2022 and Forecast 2023 to 2033

    23.1. Introduction

    23.2. Historical Market Size (US$ Million) Volume (‘000 Units) Trend Analysis By Market Taxonomy, 2017 to 2022

    23.3. Current and Future Market Size (US$ Million) Volume (‘000 Units) Analysis and Forecast by Market Taxonomy, 2023 to 2033

        23.3.1. By Bleach Type

        23.3.2. By Whitening Pace

        23.3.3. By Sensitivity Type

        23.3.4. By Distribution Channel

    23.4. Market Attractiveness Analysis

        23.4.1. By Bleach Type

        23.4.2. By Whitening Pace

        23.4.3. By Sensitivity Type

        23.4.4. By Distribution Channel

    23.5. Market Trends

    23.6. Key Market Participants - Intensity Mapping

    23.7. Drivers and Restraints - Impact Analysis

24. Middle East & Africa Market Analysis 2017 to 2022 and Forecast 2023 to 2033

    24.1. Introduction

    24.2. Historical Market Size (US$ Million) Volume (‘000 Units) Trend Analysis By Market Taxonomy, 2017 to 2022

    24.3. Current and Future Market Size (US$ Million) Volume (‘000 Units) Analysis and Forecast by Market Taxonomy, 2023 to 2033

        24.3.1. By Country

            24.3.1.1. GCC Countries

            24.3.1.2. Kingdom of Saudi Arabia

            24.3.1.3. Türkiye

            24.3.1.4. Northern Africa

            24.3.1.5. South Africa

            24.3.1.6. Israel

        24.3.2. By Bleach Type

        24.3.3. By Whitening Pace

        24.3.4. By Sensitivity Type

        24.3.5. By Distribution Channel

    24.4. Market Attractiveness Analysis

        24.4.1. By Country

        24.4.2. By Bleach Type

        24.4.3. By Whitening Pace

        24.4.4. By Sensitivity Type

        24.4.5. By Distribution Channel

    24.5. Market Trends

    24.6. Key Market Participants - Intensity Mapping

    24.7. Drivers and Restraints - Impact Analysis

    24.8. Country-Level Analysis & Forecast

        24.8.1. GCC Countries Market Analysis

            24.8.1.1. Introduction

            24.8.1.2. Market Analysis and Forecast by Market Taxonomy

                24.8.1.2.1. By Bleach Type

                24.8.1.2.2. By Whitening Pace

                24.8.1.2.3. By Sensitivity Type

                24.8.1.2.4. By Distribution Channel

        24.8.2. Kingdom of Saudi Arabia Market Analysis

            24.8.2.1. Introduction

            24.8.2.2. Market Analysis and Forecast by Market Taxonomy

                24.8.2.2.1. By Bleach Type

                24.8.2.2.2. By Whitening Pace

                24.8.2.2.3. By Sensitivity Type

                24.8.2.2.4. By Distribution Channel

        24.8.3. Türkiye Market Analysis

            24.8.3.1. Introduction

            24.8.3.2. Market Analysis and Forecast by Market Taxonomy

                24.8.3.2.1. By Bleach Type

                24.8.3.2.2. By Whitening Pace

                24.8.3.2.3. By Sensitivity Type

                24.8.3.2.4. By Distribution Channel

        24.8.4. Northern Africa Market Analysis

            24.8.4.1. Introduction

            24.8.4.2. Market Analysis and Forecast by Market Taxonomy

                24.8.4.2.1. By Bleach Type

                24.8.4.2.2. By Whitening Pace

                24.8.4.2.3. By Sensitivity Type

                24.8.4.2.4. By Distribution Channel

        24.8.5. South Africa Market Analysis

            24.8.5.1. Introduction

            24.8.5.2. Market Analysis and Forecast by Market Taxonomy

                24.8.5.2.1. By Bleach Type

                24.8.5.2.2. By Whitening Pace

                24.8.5.2.3. By Sensitivity Type

                24.8.5.2.4. By Distribution Channel

        24.8.6. Israel Market Analysis

            24.8.6.1. Introduction

            24.8.6.2. Market Analysis and Forecast by Market Taxonomy

                24.8.6.2.1. By Bleach Type

                24.8.6.2.2. By Whitening Pace

                24.8.6.2.3. By Sensitivity Type

                24.8.6.2.4. By Distribution Channel

25. Market Structure Analysis

    25.1. Market Analysis by Tier of Companies

    25.2. Market Share Analysis of Top Players (%)

    25.3. Market Presence Analysis

        25.3.1. By Regional Footprint of Players

        25.3.2. Product Footprint of Players

        25.3.3. Channel Footprint of Players

26. Competition Analysis

    26.1. Competition Dashboard

    26.2. Competition Benchmarking

    26.3. Competition Deep Dive

        26.3.1. Procter & Gamble

            26.3.1.1. Overview

            26.3.1.2. Product Portfolio

            26.3.1.3. Key Financials

            26.3.1.4. SWOT Analysis

            26.3.1.5. Key Developments

            26.3.1.6. Sales Footprint

            26.3.1.7. Strategy Overview

                26.3.1.7.1. Marketing Strategy

                26.3.1.7.2. Product Strategy

                26.3.1.7.3. Channel Strategy

        26.3.2. Colgate - Palmolive Company

            26.3.2.1. Overview

            26.3.2.2. Product Portfolio

            26.3.2.3. Key Financials

            26.3.2.4. SWOT Analysis

            26.3.2.5. Key Developments

            26.3.2.6. Sales Footprint

            26.3.2.7. Strategy Overview

                26.3.2.7.1. Marketing Strategy

                26.3.2.7.2. Product Strategy

                26.3.2.7.3. Channel Strategy

        26.3.3. Koninklijke Phillips N.V.

            26.3.3.1. Overview

            26.3.3.2. Product Portfolio

            26.3.3.3. Key Financials

            26.3.3.4. SWOT Analysis

            26.3.3.5. Key Developments

            26.3.3.6. Sales Footprint

            26.3.3.7. Strategy Overview

                26.3.3.7.1. Marketing Strategy

                26.3.3.7.2. Product Strategy

                26.3.3.7.3. Channel Strategy

        26.3.4. SmileDirectClub Inc.

            26.3.4.1. Overview

            26.3.4.2. Product Portfolio

            26.3.4.3. Key Financials

            26.3.4.4. SWOT Analysis

            26.3.4.5. Key Developments

            26.3.4.6. Sales Footprint

            26.3.4.7. Strategy Overview

                26.3.4.7.1. Marketing Strategy

                26.3.4.7.2. Product Strategy

                26.3.4.7.3. Channel Strategy

        26.3.5. BleachBright

            26.3.5.1. Overview

            26.3.5.2. Product Portfolio

            26.3.5.3. Key Financials

            26.3.5.4. SWOT Analysis

            26.3.5.5. Key Developments

            26.3.5.6. Sales Footprint

            26.3.5.7. Strategy Overview

                26.3.5.7.1. Marketing Strategy

                26.3.5.7.2. Product Strategy

                26.3.5.7.3. Channel Strategy

        26.3.6. White Glo

            26.3.6.1. Overview

            26.3.6.2. Product Portfolio

            26.3.6.3. Key Financials

            26.3.6.4. SWOT Analysis

            26.3.6.5. Key Developments

            26.3.6.6. Sales Footprint

            26.3.6.7. Strategy Overview

                26.3.6.7.1. Marketing Strategy

                26.3.6.7.2. Product Strategy

                26.3.6.7.3. Channel Strategy

        26.3.7. Whiter Image

            26.3.7.1. Overview

            26.3.7.2. Product Portfolio

            26.3.7.3. Key Financials

            26.3.7.4. SWOT Analysis

            26.3.7.5. Key Developments

            26.3.7.6. Sales Footprint

            26.3.7.7. Strategy Overview

                26.3.7.7.1. Marketing Strategy

                26.3.7.7.2. Product Strategy

                26.3.7.7.3. Channel Strategy

        26.3.8. Dr. Fresh LLC

            26.3.8.1. Overview

            26.3.8.2. Product Portfolio

            26.3.8.3. Key Financials

            26.3.8.4. SWOT Analysis

            26.3.8.5. Key Developments

            26.3.8.6. Sales Footprint

            26.3.8.7. Strategy Overview

                26.3.8.7.1. Marketing Strategy

                26.3.8.7.2. Product Strategy

                26.3.8.7.3. Channel Strategy

        26.3.9. Tarte Cosmetics

            26.3.9.1. Overview

            26.3.9.2. Product Portfolio

            26.3.9.3. Key Financials

            26.3.9.4. SWOT Analysis

            26.3.9.5. Key Developments

            26.3.9.6. Sales Footprint

            26.3.9.7. Strategy Overview

                26.3.9.7.1. Marketing Strategy

                26.3.9.7.2. Product Strategy

                26.3.9.7.3. Channel Strategy

        26.3.10. Cavex Hollland BV

            26.3.10.1. Overview

            26.3.10.2. Product Portfolio

            26.3.10.3. Key Financials

            26.3.10.4. SWOT Analysis

            26.3.10.5. Key Developments

            26.3.10.6. Sales Footprint

            26.3.10.7. Strategy Overview

                26.3.10.7.1. Marketing Strategy

                26.3.10.7.2. Product Strategy

                26.3.10.7.3. Channel Strategy

        26.3.11. Spotlight Oral Care

            26.3.11.1. Overview

            26.3.11.2. Product Portfolio

            26.3.11.3. Key Financials

            26.3.11.4. SWOT Analysis

            26.3.11.5. Key Developments

            26.3.11.6. Sales Footprint

            26.3.11.7. Strategy Overview

                26.3.11.7.1. Marketing Strategy

                26.3.11.7.2. Product Strategy

                26.3.11.7.3. Channel Strategy

        26.3.12. Lumineux Health

            26.3.12.1. Overview

            26.3.12.2. Product Portfolio

            26.3.12.3. Key Financials

            26.3.12.4. SWOT Analysis

            26.3.12.5. Key Developments

            26.3.12.6. Sales Footprint

            26.3.12.7. Strategy Overview

                26.3.12.7.1. Marketing Strategy

                26.3.12.7.2. Product Strategy

                26.3.12.7.3. Channel Strategy

        26.3.13. Perfora

            26.3.13.1. Overview

            26.3.13.2. Product Portfolio

            26.3.13.3. Key Financials

            26.3.13.4. SWOT Analysis

            26.3.13.5. Key Developments

            26.3.13.6. Sales Footprint

            26.3.13.7. Strategy Overview

                26.3.13.7.1. Marketing Strategy

                26.3.13.7.2. Product Strategy

                26.3.13.7.3. Channel Strategy

        26.3.14. Moon Oral Care

            26.3.14.1. Overview

            26.3.14.2. Product Portfolio

            26.3.14.3. Key Financials

            26.3.14.4. SWOT Analysis

            26.3.14.5. Key Developments

            26.3.14.6. Sales Footprint

            26.3.14.7. Strategy Overview

                26.3.14.7.1. Marketing Strategy

                26.3.14.7.2. Product Strategy

                26.3.14.7.3. Channel Strategy

        26.3.15. GO SMILE

            26.3.15.1. Overview

            26.3.15.2. Product Portfolio

            26.3.15.3. Key Financials

            26.3.15.4. SWOT Analysis

            26.3.15.5. Key Developments

            26.3.15.6. Sales Footprint

            26.3.15.7. Strategy Overview

                26.3.15.7.1. Marketing Strategy

                26.3.15.7.2. Product Strategy

                26.3.15.7.3. Channel Strategy

        26.3.16. Auraglow

            26.3.16.1. Overview

            26.3.16.2. Product Portfolio

            26.3.16.3. Key Financials

            26.3.16.4. SWOT Analysis

            26.3.16.5. Key Developments

            26.3.16.6. Sales Footprint

            26.3.16.7. Strategy Overview

                26.3.16.7.1. Marketing Strategy

                26.3.16.7.2. Product Strategy

                26.3.16.7.3. Channel Strategy

        26.3.17. Smilebriter

            26.3.17.1. Overview

            26.3.17.2. Product Portfolio

            26.3.17.3. Key Financials

            26.3.17.4. SWOT Analysis

            26.3.17.5. Key Developments

            26.3.17.6. Sales Footprint

            26.3.17.7. Strategy Overview

                26.3.17.7.1. Marketing Strategy

                26.3.17.7.2. Product Strategy

                26.3.17.7.3. Channel Strategy

        26.3.18. Keeko

            26.3.18.1. Overview

            26.3.18.2. Product Portfolio

            26.3.18.3. Key Financials

            26.3.18.4. SWOT Analysis

            26.3.18.5. Key Developments

            26.3.18.6. Sales Footprint

            26.3.18.7. Strategy Overview

                26.3.18.7.1. Marketing Strategy

                26.3.18.7.2. Product Strategy

                26.3.18.7.3. Channel Strategy

        26.3.19. Beaming White, LLC.

            26.3.19.1. Overview

            26.3.19.2. Product Portfolio

            26.3.19.3. Key Financials

            26.3.19.4. SWOT Analysis

            26.3.19.5. Key Developments

            26.3.19.6. Sales Footprint

            26.3.19.7. Strategy Overview

                26.3.19.7.1. Marketing Strategy

                26.3.19.7.2. Product Strategy

                26.3.19.7.3. Channel Strategy

        26.3.20. Mr. Bright Smile

            26.3.20.1. Overview

            26.3.20.2. Product Portfolio

            26.3.20.3. Key Financials

            26.3.20.4. SWOT Analysis

            26.3.20.5. Key Developments

            26.3.20.6. Sales Footprint

            26.3.20.7. Strategy Overview

                26.3.20.7.1. Marketing Strategy

                26.3.20.7.2. Product Strategy

                26.3.20.7.3. Channel Strategy

27. Assumptions and Acronyms Used

28. Research Methodology

List of Tables

Table 01: Global Market Volume (in '000 Units) Analysis and Opportunity Assessment 2023 to 2033, By Bleach Type

Table 02: Global Market Value (US$ Million) Analysis and Opportunity Assessment 2023 to 2033, By Bleach Type

Table 03: Global Market Value (US$ Million) Analysis and Opportunity Assessment 2023 to 2033, By Whitening Pace

Table 04: Global Market Value (US$ Million) Analysis and Opportunity Assessment 2023 to 2033, By Sensitivity Type

Table 05: Global Market Value (US$ Million) Analysis and Forecast 2023 to 2033, By Distribution Channel

Table 06: Global Market Value (US$ Million) Analysis and Opportunity Assessment 2023 to 2033, By Region

Table 07: Global Market Value (US$ Million) Analysis and Opportunity Assessment 2023 to 2033, By Region

Table 08: North America Market Value (US$ Million) Analysis 2017 to 2022 and Forecast 2023 to 2033, By Country

Table 09: North America Market Volume (in '000 Units) Analysis and Opportunity Assessment 2023 to 2033, By Bleach Type

Table 10: North America Market Value (US$ Million) Analysis and Opportunity Assessment 2023 to 2033, By Bleach Type

Table 11: North America Market Value (US$ Million) Analysis and Opportunity Assessment 2023 to 2033, By Whitening Pace

Table 12: North America Market Value (US$ Million) Analysis and Opportunity Assessment 2023 to 2033, By Sensitivity Type

Table 13: North America Market Value (US$ Million) Analysis and Forecast 2023 to 2033, By Distribution Channel

Table 14: Latin America Market Value (US$ Million) Analysis 2017 to 2022 and Forecast 2023 to 2033, By Country

Table 15: Latin America Market Volume (in '000 Units) Analysis and Opportunity Assessment 2023 to 2033, By Bleach Type

Table 16: Latin America Market Value (US$ Million) Analysis and Opportunity Assessment 2023 to 2033, By Bleach Type

Table 17: Latin America Market Value (US$ Million) Analysis and Opportunity Assessment 2023 to 2033, By Whitening Pace

Table 18: Latin America Market Value (US$ Million) Analysis and Opportunity Assessment 2023 to 2033, By Sensitivity Type

Table 19: Latin America Market Value (US$ Million) Analysis and Forecast 2023 to 2033, By Distribution Channel

Table 20: East Asia Market Value (US$ Million) Analysis 2017 to 2022 and Forecast 2023 to 2033, By Country

Table 21: East Asia Market Volume (in '000 Units) Analysis and Opportunity Assessment 2023 to 2033, By Bleach Type

Table 22: East Asia Market Value (US$ Million) Analysis and Opportunity Assessment 2023 to 2033, By Bleach Type

Table 23: East Asia Market Value (US$ Million) Analysis and Opportunity Assessment 2023 to 2033, By Whitening Pace

Table 24: East Asia Market Value (US$ Million) Analysis and Opportunity Assessment 2023 to 2033, By Sensitivity Type

Table 25: East Asia Market Value (US$ Million) Analysis and Forecast 2023 to 2033, By Distribution Channel

Table 26: South Asia & Pacific Market Value (US$ Million) Analysis 2017 to 2022 and Forecast 2023 to 2033, By Country

Table 27: South Asia & Pacific Market Volume (in '000 Units) Analysis and Opportunity Assessment 2023 to 2033, By Bleach Type

Table 28: South Asia & Pacific Market Value (US$ Million) Analysis and Opportunity Assessment 2023 to 2033, By Bleach Type

Table 29: South Asia & Pacific Market Value (US$ Million) Analysis and Opportunity Assessment 2023 to 2033, By Whitening Pace

Table 30: South Asia & Pacific Market Value (US$ Million) Analysis and Opportunity Assessment 2023 to 2033, By Sensitivity Type

Table 31: South Asia & Pacific Market Value (US$ Million) Analysis and Forecast 2023 to 2033, By Distribution Channel

Table 32: Western Europe Market Value (US$ Million) Analysis 2017 to 2022 and Forecast 2023 to 2033, By Country

Table 33: Western Europe Market Volume (in '000 Units) Analysis and Opportunity Assessment 2023 to 2033, By Bleach Type

Table 34: Western Europe Market Value (US$ Million) Analysis and Opportunity Assessment 2023 to 2033, By Bleach Type

Table 35: Western Europe Market Value (US$ Million) Analysis and Opportunity Assessment 2023 to 2033, By Whitening Pace

Table 36: Western Europe Market Value (US$ Million) Analysis and Opportunity Assessment 2023 to 2033, By Sensitivity Type

Table 37: Western Europe Market Value (US$ Million) Analysis and Forecast 2023 to 2033, By Distribution Channel

Table 38: Eastern Europe Market Value (US$ Million) Analysis 2017 to 2022 and Forecast 2023 to 2033, By Country

Table 39: Eastern Europe Market Volume (in '000 Units) Analysis and Opportunity Assessment 2023 to 2033, By Bleach Type

Table 40: Eastern Europe Market Value (US$ Million) Analysis and Opportunity Assessment 2023 to 2033, By Bleach Type

Table 41: Eastern Europe Market Value (US$ Million) Analysis and Opportunity Assessment 2023 to 2033, By Whitening Pace

Table 42: Eastern Europe Market Value (US$ Million) Analysis and Opportunity Assessment 2023 to 2033, By Sensitivity Type

Table 43: Eastern Europe Market Value (US$ Million) Analysis and Forecast 2023 to 2033, By Distribution Channel

Table 44: Central Asia Market Volume (in '000 Units) Analysis and Opportunity Assessment 2023 to 2033, By Bleach Type

Table 45: Central Asia Market Value (US$ Million) Analysis and Opportunity Assessment 2023 to 2033, By Bleach Type

Table 46: Central Asia Market Value (US$ Million) Analysis and Opportunity Assessment 2023 to 2033, By Whitening Pace

Table 47: Central Asia Market Value (US$ Million) Analysis and Opportunity Assessment 2023 to 2033, By Sensitivity Type

Table 48: Central Asia Market Value (US$ Million) Analysis and Forecast 2023 to 2033, By Distribution Channel

Table 49: Russia & Belarus Market Volume (in '000 Units) Analysis and Opportunity Assessment 2023 to 2033, By Bleach Type

Table 50: Russia & Belarus Market Value (US$ Million) Analysis and Opportunity Assessment 2023 to 2033, By Bleach Type

Table 51: Russia & Belarus Market Value (US$ Million) Analysis and Opportunity Assessment 2023 to 2033, By Whitening Pace

Table 52: Russia & Belarus Market Value (US$ Million) Analysis and Opportunity Assessment 2023 to 2033, By Sensitivity Type

Table 53: Russia & Belarus Market Value (US$ Million) Analysis and Forecast 2023 to 2033, By Distribution Channel

Table 54: Balkan & Baltic Countries Market Volume (in '000 Units) Analysis and Opportunity Assessment 2023 to 2033, By Bleach Type

Table 55: Balkan & Baltic Countries Market Value (US$ Million) Analysis and Opportunity Assessment 2023 to 2033, By Bleach Type

Table 56: Balkan & Baltic Countries Market Value (US$ Million) Analysis and Opportunity Assessment 2023 to 2033, By Whitening Pace

Table 57: Balkan & Baltic Countries Market Value (US$ Million) Analysis and Opportunity Assessment 2023 to 2033, By Sensitivity Type

Table 58: Balkan & Baltic Countries Market Value (US$ Million) Analysis and Forecast 2023 to 2033, By Distribution Channel

Table 59: Middle East and Africa (MEA) Market Value (US$ Million) Analysis 2017 to 2022 and Forecast 2023 to 2033, By Country

Table 60: Middle East and Africa (MEA) Market Volume (in '000 Units) Analysis and Opportunity Assessment 2023 to 2033, By Bleach Type

Table 61: Middle East and Africa (MEA) Market Value (US$ Million) Analysis and Opportunity Assessment 2023 to 2033, By Bleach Type

Table 62: Middle East and Africa (MEA) Market Value (US$ Million) Analysis and Opportunity Assessment 2023 to 2033, By Whitening Pace

Table 63: Middle East and Africa (MEA) Market Value (US$ Million) Analysis and Opportunity Assessment 2023 to 2033, By Sensitivity Type

Table 64: Middle East and Africa (MEA) Market Value (US$ Million) Analysis and Forecast 2023 to 2033, By Distribution Channel

List of Charts

Figure 01: Global Market Volume (‘000 Units) Analysis, 2017 to 2022

Figure 02: Global Market Volume (‘000 Units), 2023 to 2033 & Y-o-Y Growth Trend Analysis

Figure 03: Global Market Value Analysis, 2017 to 2022

Figure 04: Global Market Value, 2023 to 2033 & Y-o-Y Growth Trend Analysis

Figure 05: Global Market Absolute $ Opportunity Analysis, 2023 to 2033

Figure 06: Global Market Analysis By Bleach Type - 2023 to 2033

Figure 07: Global Market Y-o-Y Growth Projections By Bleach Type, 2023 to 2033

Figure 08: Global Market Attractiveness Analysis by Bleach Type, 2023 to 2033

Figure 09: Global Market Analysis By Whitening Pace - 2023 to 2033

Figure 10: Global Market Y-o-Y Growth Projections By Whitening Pace, 2023 to 2033

Figure 11: Global Teeth Whitening Market Attractiveness Analysis by Whitening Pace, 2023 to 2033

Figure 12: Global Market Analysis By Sensitivity Type - 2023 to 2033

Figure 13: Global Market Y-o-Y Growth Projections By Sensitivity Type, 2023 to 2033

Figure 14: Global Teeth Whitening Market Attractiveness Analysis by Sensitivity Type, 2023 to 2033

Figure 15: Global Market Share Analysis (%), By Distribution Channel, 2023 to 2033

Figure 16: Global Market Y-o-Y Analysis (%), By Distribution Channel, 2023 to 2033

Figure 17: Global Market Attractiveness Analysis by Distribution Channel, 2023 to 2033

Figure 18: Global Market Share Analysis (%), By Region, 2023 to 2033

Figure 19: Global Market Y-o-Y Analysis (%), By Region, 2023 to 2033

Figure 20: Global Market Attractiveness Analysis by Region, 2023 to 2033

Figure 21: North America Market Value Share, By Bleach Type (2022 A)

Figure 22: North America Market Value Share, By Whitening Pace (2022 A)

Figure 23: North America Market Value Share, By Sensitivity Type (2022 A)

Figure 24: North America Market Value Share, By Distribution Channel (2022 A)

Figure 25: North America Market Value Share, By Country (2022 A)

Figure 26: North America Market Value Analysis, 2017 to 2022

Figure 27: North America Market Value, 2023 to 2033 & Y-o-Y Growth Trend Analysis

Figure 28: North America Market Attractiveness Analysis, By Bleach Type, 2023 to 2033

Figure 29: North America Market Attractiveness Analysis, By Whitening Pace, 2023 to 2033

Figure 30: North America Market Attractiveness Analysis, By Sensitivity Type 2023 to 2033

Figure 31: North America Market Attractiveness Analysis, By Distribution Channel, 2023 to 2033

Figure 32: North America Market Attractiveness Analysis, By Country 2023 to 2033

Figure 33: United States of America Market Share Analysis (%) By Bleach Type, 2022 to 2033

Figure 34: United States of America Market Share Analysis (%) Whitening Pace, 2022 to 2033

Figure 35: United States of America Market Share Analysis (%) By Sensitivity Type, 2022 to 2033

Figure 36: United States of America Market Share Analysis (%) Distribution Channel, 2022 to 2033

Figure 37: Canada Market Share Analysis (%) By Bleach Type, 2022 to 2033

Figure 38: Canada Market Share Analysis (%) Whitening Pace, 2022 to 2033

Figure 39: Canada Market Share Analysis (%) By Sensitivity Type, 2022 to 2033

Figure 40: Canada Market Share Analysis (%) Distribution Channel, 2022 to 2033

Figure 41: Latin America Market Value Share, By Bleach Type (2022 A)

Figure 42: Latin America Market Value Share, By Whitening Pace (2022 A)

Figure 43: Latin America Market Value Share, By Sensitivity Type (2022 A)

Figure 44: Latin America Market Value Share, By Distribution Channel (2022 A)

Figure 45: Latin America Market Value Share, By Country (2022 A)

Figure 46: Latin America Market Value Analysis, 2017 to 2022

Figure 47: Latin America Market Value, 2023 to 2033 & Y-o-Y Growth Trend Analysis

Figure 48: Latin America Market Attractiveness Analysis, By Bleach Type, 2023 to 2033

Figure 49: Latin America Market Attractiveness Analysis, By Whitening Pace, 2023 to 2033

Figure 50: Latin America Market Attractiveness Analysis, By Sensitivity Type 2023 to 2033

Figure 51: Latin America Market Attractiveness Analysis, By Distribution Channel, 2023 to 2033

Figure 52: Latin America Market Attractiveness Analysis, By Country 2023 to 2033

Figure 53: Brazil Market Share Analysis (%) By Bleach Type, 2022 to 2033

Figure 54: Brazil Market Share Analysis (%) Whitening Pace, 2022 to 2033

Figure 55: Brazil Market Share Analysis (%) By Sensitivity Type, 2022 to 2033

Figure 56: Brazil Market Share Analysis (%) Distribution Channel, 2022 to 2033

Figure 57: Mexico Market Share Analysis (%) By Bleach Type, 2022 to 2033

Figure 58: Mexico Market Share Analysis (%) Whitening Pace, 2022 to 2033

Figure 59: Mexico Market Share Analysis (%) By Sensitivity Type, 2022 to 2033

Figure 60: Mexico Market Share Analysis (%) Distribution Channel, 2022 to 2033

Figure 61: Argentina Market Share Analysis (%) By Bleach Type, 2022 to 2033

Figure 62: Argentina Market Share Analysis (%) Whitening Pace, 2022 to 2033

Figure 63: Argentina Market Share Analysis (%) By Sensitivity Type, 2022 to 2033

Figure 64: Argentina Market Share Analysis (%) Distribution Channel, 2022 to 2033

Figure 65: East Asia Market Value Share, By Bleach Type (2022 A)

Figure 66: East Asia Market Value Share, By Whitening Pace (2022 A)

Figure 67: East Asia Market Value Share, By Sensitivity Type (2022 A)

Figure 68: East Asia Market Value Share, By Distribution Channel (2022 A)

Figure 69: East Asia Market Value Share, By Country (2022 A)

Figure 70: East Asia Market Value Analysis, 2017 to 2022

Figure 71: East Asia Market Value, 2023 to 2033 & Y-o-Y Growth Trend Analysis

Figure 72: East Asia Market Attractiveness Analysis, By Bleach Type, 2023 to 2033

Figure 73: East Asia Market Attractiveness Analysis, By Whitening Pace, 2023 to 2033

Figure74: East Asia Market Attractiveness Analysis, By Sensitivity Type 2023 to 2033

Figure 75: East Asia Market Attractiveness Analysis, By Distribution Channel, 2023 to 2033

Figure 76: East Asia Market Attractiveness Analysis, By Country 2023 to 2033

Figure 77: China Market Share Analysis (%) By Bleach Type, 2022 to 2033

Figure 78: China Market Share Analysis (%) Whitening Pace, 2022 to 2033

Figure 79: China Market Share Analysis (%) By Sensitivity Type, 2022 to 2033

Figure 80: China Market Share Analysis (%) Distribution Channel, 2022 to 2033

Figure 81: Japan Market Share Analysis (%) By Bleach Type, 2022 to 2033

Figure 82: Japan Market Share Analysis (%) Whitening Pace, 2022 to 2033

Figure 83: Japan Market Share Analysis (%) By Sensitivity Type, 2022 to 2033

Figure 84: Japan Market Share Analysis (%) Distribution Channel, 2022 to 2033

Figure 85: South Korea Market Share Analysis (%) By Bleach Type, 2022 to 2033

Figure 86: South Korea Market Share Analysis (%) Whitening Pace, 2022 to 2033

Figure 87: South Korea Market Share Analysis (%) By Sensitivity Type, 2022 to 2033

Figure 88: South Korea Market Share Analysis (%) Distribution Channel, 2022 to 2033

Figure 89: South Asia & Pacific Market Value Share, By Bleach Type (2022 A)

Figure 90: South Asia & Pacific Market Value Share, By Whitening Pace (2022 A)

Figure 91: South Asia & Pacific Market Value Share, By Sensitivity Type (2022 A)

Figure 92: South Asia & Pacific Market Value Share, By Distribution Channel (2022 A)

Figure 93: South Asia & Pacific Market Value Share, By Country (2022 A)

Figure 94: South Asia & Pacific Market Value Analysis, 2017 to 2022

Figure 95: South Asia & Pacific Market Value, 2023 to 2033 & Y-o-Y Growth Trend Analysis

Figure 96: South Asia & Pacific Market Attractiveness Analysis, By Bleach Type, 2023 to 2033

Figure 97: South Asia & Pacific Market Attractiveness Analysis, By Whitening Pace, 2023 to 2033

Figure 98: South Asia & Pacific Market Attractiveness Analysis, By Sensitivity Type 2023 to 2033

Figure 99: South Asia & Pacific Market Attractiveness Analysis, By Distribution Channel, 2023 to 2033

Figure 100: South Asia & Pacific Market Attractiveness Analysis, By Country 2023 to 2033

Figure 101: India Market Share Analysis (%) By Bleach Type, 2022 to 2033

Figure 102: India Market Share Analysis (%) Whitening Pace, 2022 to 2033

Figure 103: India Market Share Analysis (%) By Sensitivity Type, 2022 to 2033

Figure 104: India Market Share Analysis (%) Distribution Channel, 2022 to 2033

Figure 105: Indonesia Market Share Analysis (%) By Bleach Type, 2022 to 2033

Figure 106: Indonesia Market Share Analysis (%) Whitening Pace, 2022 to 2033

Figure 107: Indonesia Market Share Analysis (%) By Sensitivity Type, 2022 to 2033

Figure 108: Indonesia Market Share Analysis (%) Distribution Channel, 2022 to 2033

Figure 109: Thailand Market Share Analysis (%) By Bleach Type, 2022 to 2033

Figure 110: Thailand Market Share Analysis (%) Whitening Pace, 2022 to 2033

Figure 111: Thailand Market Share Analysis (%) By Sensitivity Type, 2022 to 2033

Figure 112: Thailand Market Share Analysis (%) Distribution Channel, 2022 to 2033

Figure 113: Philippines Market Share Analysis (%) By Bleach Type, 2022 to 2033

Figure 114: Philippines Market Share Analysis (%) Whitening Pace, 2022 to 2033

Figure 115: Philippines Market Share Analysis (%) By Sensitivity Type, 2022 to 2033

Figure 116: Philippines Market Share Analysis (%) Distribution Channel, 2022 to 2033

Figure 117: Malaysia Market Share Analysis (%) By Bleach Type, 2022 to 2033

Figure 118: Malaysia Market Share Analysis (%) Whitening Pace, 2022 to 2033

Figure 119: Malaysia Market Share Analysis (%) By Sensitivity Type, 2022 to 2033

Figure120: Malaysia Market Share Analysis (%) Distribution Channel, 2022 to 2033

Figure 121: Vietnam Market Share Analysis (%) By Bleach Type, 2022 to 2033

Figure 122: Vietnam Market Share Analysis (%) Whitening Pace, 2022 to 2033

Figure 123: Vietnam Market Share Analysis (%) By Sensitivity Type, 2022 to 2033

Figure 124: Vietnam Market Share Analysis (%) Distribution Channel, 2022 to 2033

Figure 125: Australia & New Zealand Market Share Analysis (%) By Bleach Type, 2022 to 2033

Figure 126: Australia & New Zealand Market Share Analysis (%) Whitening Pace, 2022 to 2033

Figure 127: Australia & New Zealand Market Share Analysis (%) By Sensitivity Type, 2022 to 2033

Figure 128: Australia & New Zealand Market Share Analysis (%) Distribution Channel, 2022 to 2033

Figure 129: Western Europe Market Value Share, By Bleach Type (2022 A)

Figure 130: Western Europe Market Value Share, By Whitening Pace (2022 A)

Figure 131: Western Europe Market Value Share, By Sensitivity Type (2022 A)

Figure 132: Western Europe Market Value Share, By Distribution Channel (2022 A)

Figure 133: Western Europe Market Value Share, By Country (2022 A)

Figure 134: Western Europe Market Value Analysis, 2017 to 2022

Figure 135: Western Europe Market Value, 2023 to 2033 & Y-o-Y Growth Trend Analysis

Figure 136: Western Europe Market Attractiveness Analysis, By Bleach Type, 2023 to 2033

Figure 137: Western Europe Market Attractiveness Analysis, By Whitening Pace, 2023 to 2033

Figure 138: Western Europe Market Attractiveness Analysis, By Sensitivity Type 2023 to 2033

Figure 139: Western Europe Market Attractiveness Analysis, By Distribution Channel, 2023 to 2033

Figure 140: Western Europe Market Attractiveness Analysis, By Country 2023 to 2033

Figure 141: Germany Market Share Analysis (%) By Bleach Type, 2022 to 2033

Figure 142: Germany Market Share Analysis (%) Whitening Pace, 2022 to 2033

Figure 143: Germany Market Share Analysis (%) By Sensitivity Type, 2022 to 2033

Figure 144: Germany Market Share Analysis (%) Distribution Channel, 2022 to 2033

Figure 145: France Market Share Analysis (%) By Bleach Type, 2022 to 2033

Figure 146: France Market Share Analysis (%) Whitening Pace, 2022 to 2033

Figure 147: France Market Share Analysis (%) By Sensitivity Type, 2022 to 2033

Figure 148: France Market Share Analysis (%) Distribution Channel, 2022 to 2033

Figure 149: Spain Market Share Analysis (%) By Bleach Type, 2022 to 2033

Figure 150: Spain Market Share Analysis (%) Whitening Pace, 2022 to 2033

Figure 151: Spain Market Share Analysis (%) By Sensitivity Type, 2022 to 2033

Figure 152: Spain Market Share Analysis (%) Distribution Channel, 2022 to 2033

Figure 153: Italy Market Share Analysis (%) By Bleach Type, 2022 to 2033

Figure 154: Italy Market Share Analysis (%) Whitening Pace, 2022 to 2033

Figure 155: Italy Market Share Analysis (%) By Sensitivity Type, 2022 to 2033

Figure 156: Italy Market Share Analysis (%) Distribution Channel, 2022 to 2033

Figure 157: BENELUX Market Share Analysis (%) By Bleach Type, 2022 to 2033

Figure 158: BENELUX Market Share Analysis (%) Whitening Pace, 2022 to 2033

Figure 159: BENELUX Market Share Analysis (%) By Sensitivity Type, 2022 to 2033

Figure 160: BENELUX Market Share Analysis (%) Distribution Channel, 2022 to 2033

Figure 161: Nordic Countries Market Share Analysis (%) By Bleach Type, 2022 to 2033

Figure 162: Nordic Countries Whitening Pens Market Share Analysis (%) Whitening Pace, 2022 to 2033

Figure 163: Nordic Countries Market Share Analysis (%) By Sensitivity Type, 2022 to 2033

Figure 164: Nordic Countries Market Share Analysis (%) Distribution Channel, 2022 to 2033

Figure 165: UK Market Share Analysis (%) By Bleach Type, 2022 to 2033

Figure 166: UK Market Share Analysis (%) Whitening Pace, 2022 to 2033

Figure 167: UK Market Share Analysis (%) By Sensitivity Type, 2022 to 2033

Figure 168: UK Market Share Analysis (%) Distribution Channel, 2022 to 2033

Figure 169: Eastern Europe Market Value Share, By Bleach Type (2022 A)

Figure 170: Eastern Europe Market Value Share, By Whitening Pace (2022 A)

Figure 171: Eastern Europe Market Value Share, By Sensitivity Type (2022 A)

Figure 172: Eastern Europe Market Value Share, By Distribution Channel (2022 A)

Figure 173: Eastern Europe Market Value Share, By Country (2022 A)

Figure 174: Eastern Europe Market Value Analysis, 2017 to 2022

Figure 175: Eastern Europe Market Value, 2023 to 2033 & Y-o-Y Growth Trend Analysis

Figure 176: Eastern Europe Market Attractiveness Analysis, By Bleach Type, 2023 to 2033

Figure 177: Eastern Europe Market Attractiveness Analysis, By Whitening Pace, 2023 to 2033

Figure 178: Eastern Europe Market Attractiveness Analysis, By Sensitivity Type 2023 to 2033

Figure 179: Eastern Europe Market Attractiveness Analysis, By Distribution Channel, 2023 to 2033

Figure 180: Eastern Europe Market Attractiveness Analysis, By Country 2023 to 2033

Figure 181: Poland Market Share Analysis (%) By Bleach Type, 2022 to 2033

Figure 182: Poland Market Share Analysis (%) Whitening Pace, 2022 to 2033

Figure 183: Poland Market Share Analysis (%) By Sensitivity Type, 2022 to 2033

Figure 184: Poland Market Share Analysis (%) Distribution Channel, 2022 to 2033

Figure 185: Hungary Market Share Analysis (%) By Bleach Type, 2022 to 2033

Figure 186: Hungary Market Share Analysis (%) Whitening Pace, 2022 to 2033

Figure 187: Hungary Market Share Analysis (%) By Sensitivity Type, 2022 to 2033

Figure 188: Hungary Market Share Analysis (%) Distribution Channel, 2022 to 2033

Figure 189: Romania Market Share Analysis (%) By Bleach Type, 2022 to 2033

Figure 190: Romania Market Share Analysis (%) Whitening Pace, 2022 to 2033

Figure 191: Romania Market Share Analysis (%) By Sensitivity Type, 2022 to 2033

Figure 192: Romania Market Share Analysis (%) Distribution Channel, 2022 to 2033

Figure 193: Czech Republic Market Share Analysis (%) By Bleach Type, 2022 to 2033

Figure 194: Czech Republic Market Share Analysis (%) Whitening Pace, 2022 to 2033

Figure 195: Czech Republic Market Share Analysis (%) By Sensitivity Type, 2022 to 2033

Figure 196: Czech Republic Market Share Analysis (%) Distribution Channel, 2022 to 2033

Figure 197: Central Asia Market Value Share, By Bleach Type (2022 A)

Figure 198: Central Asia Market Value Share, By Whitening Pace (2022 A)

Figure 199: Central Asia Market Value Share, By Sensitivity Type (2022 A)

Figure 200: Central Asia Market Value Share, By Distribution Channel (2022 A)

Figure 201: Central Asia Market Value Analysis, 2017 to 2022

Figure 202: Central Asia Market Value, 2023 to 2033 & Y-o-Y Growth Trend Analysis

Figure 203: Central Asia Market Attractiveness Analysis, By Bleach Type, 2023 to 2033

Figure 204: Central Asia Market Attractiveness Analysis, By Whitening Pace, 2023 to 2033

Figure 205: Central Asia Market Attractiveness Analysis, By Sensitivity Type 2023 to 2033

Figure 206: Central Asia Market Attractiveness Analysis, By Distribution Channel, 2023 to 2033

Figure 208: Russia & Belarus Market Value Share, By Bleach Type (2022 A)

Figure 209: Russia & Belarus Market Value Share, By Whitening Pace (2022 A)

Figure 210: Russia & Belarus Market Value Share, By Sensitivity Type (2022 A)

Figure 212: Russia & Belarus Market Value Analysis, 2017 to 2022

Figure 213: Russia & Belarus Market Value, 2023 to 2033 & Y-o-Y Growth Trend Analysis

Figure 214: Russia & Belarus Market Attractiveness Analysis, By Bleach Type, 2023 to 2033

Figure 214: Russia & Belarus Market Attractiveness Analysis, By Whitening Pace, 2023 to 2033

Figure 215: Russia & Belarus Market Attractiveness Analysis, By Sensitivity Type 2023 to 2033

Figure 217: Russia & Belarus Market Attractiveness Analysis, By Distribution Channel, 2023 to 2033

Figure 218: Balkan & Baltic Countries Market Value Share, By Bleach Type (2022 A)

Figure 219: Balkan & Baltic Countries Market Value Share, By Whitening Pace (2022 A)

Figure 220: Balkan & Baltic Countries Market Value Share, By Sensitivity Type (2022 A)

Figure 222: Balkan & Baltic Countries Market Value Analysis, 2017 to 2022

Figure 223: Balkan & Baltic Countries Market Value, 2023 to 2033 & Y-o-Y Growth Trend Analysis

Figure 224: Balkan & Baltic Countries Market Attractiveness Analysis, By Bleach Type, 2023 to 2033

Figure 223: Balkan & Baltic Countries Market Attractiveness Analysis, By Bleach Type, 2023 to 2033

Figure 224: Balkan & Baltic Countries Market Attractiveness Analysis, By Whitening Pace, 2023 to 2033

Figure 227: Balkan & Baltic Countries Market Attractiveness Analysis, By Distribution Channel, 2023 to 2033

Figure 228: Middle East and Africa (MEA) Market Value Share, By Bleach Type (2022 A)

Figure 229: Middle East and Africa (MEA) Market Value Share, By Whitening Pace (2022 A)

Figure 230: Middle East and Africa (MEA) Market Value Share, By Sensitivity Type (2022 A)

Figure 231: Middle East and Africa (MEA) Market Value Share, By Distribution Channel (2022 A)

Figure 232: Middle East and Africa (MEA) Market Value Share, By Country (2022 A)

Figure 233: Middle East and Africa (MEA) Market Value Analysis, 2017 to 2022

Figure 234: Middle East and Africa (MEA) Market Value, 2023 to 2033 & Y-o-Y Growth Trend Analysis

Figure 235: Middle East and Africa (MEA) Market Attractiveness Analysis, By Bleach Type, 2023 to 2033

Figure 235: Middle East and Africa (MEA) Market Attractiveness Analysis, By Whitening Pace, 2023 to 2033

Figure 236: Middle East and Africa (MEA) Market Attractiveness Analysis, By Sensitivity Type 2023 to 2033

Figure 238: Middle East and Africa (MEA) Market Attractiveness Analysis, By Distribution Channel, 2023 to 2033

Figure 238: Middle East and Africa (MEA) Market Attractiveness Analysis, By Country 2023 to 2033

Figure 239: GCC Countries Market Share Analysis (%) By Bleach Type, 2022 to 2033

Figure 240: GCC Countries Market Share Analysis (%) Whitening Pace, 2022 to 2033

Figure 241: GCC Countries Market Share Analysis (%) By Sensitivity Type, 2022 to 2033

Figure 242: GCC Countries Market Share Analysis (%) Distribution Channel, 2022 to 2033

Figure 243: Kingdom of Saudi Arabia Market Share Analysis (%) By Bleach Type, 2022 to 2033

Figure 244: Kingdom of Saudi Arabia Market Share Analysis (%) Whitening Pace, 2022 to 2033

Figure 245: Kingdom of Saudi Arabia Market Share Analysis (%) By Sensitivity Type, 2022 to 2033

Figure 246: Kingdom of Saudi Arabia Market Share Analysis (%) Distribution Channel, 2022 to 2033

Figure 247: Türkiye Market Share Analysis (%) By Bleach Type, 2022 to 2033

Figure 248: Türkiye Market Share Analysis (%) Whitening Pace, 2022 to 2033

Figure 249: Türkiye Market Share Analysis (%) By Sensitivity Type, 2022 to 2033

Figure 250: Türkiye Market Share Analysis (%) Distribution Channel, 2022 to 2033

Figure 251: Northern Africa Market Share Analysis (%) By Bleach Type, 2022 to 2033

Figure 252: Northern Africa Market Share Analysis (%) Whitening Pace, 2022 to 2033

Figure 253: Northern Africa Market Share Analysis (%) By Sensitivity Type, 2022 to 2033

Figure 254: Northern Africa Market Share Analysis (%) Distribution Channel, 2022 to 2033

Figure 255: South Africa Market Share Analysis (%) By Bleach Type, 2022 to 2033

Figure 256: South Africa Market Share Analysis (%) Whitening Pace, 2022 to 2033

Figure 257: South Africa Market Share Analysis (%) By Sensitivity Type, 2022 to 2033

Figure 258: South Africa Market Share Analysis (%) Distribution Channel, 2022 to 2033

Figure 259: Israel Market Share Analysis (%) By Bleach Type, 2022 to 2033

Figure 260: Israel Market Share Analysis (%) Whitening Pace, 2022 to 2033

Figure 261: Israel Market Share Analysis (%) By Sensitivity Type, 2022 to 2033

Figure 262: Israel Market Share Analysis (%) Distribution Channel, 2022 to 2033

Explore Healthcare Insights

View Reports

Teeth Whitening Pens Market