Crude Oil Flow Improvers Market Size and Share Forecast Outlook 2025 to 2035

The Crude Oil Flow Improvers Market is estimated to be valued at USD 1.9 billion in 2025 and is projected to reach USD 3.1 billion by 2035, registering a compound annual growth rate (CAGR) of 5.3% over the forecast period.
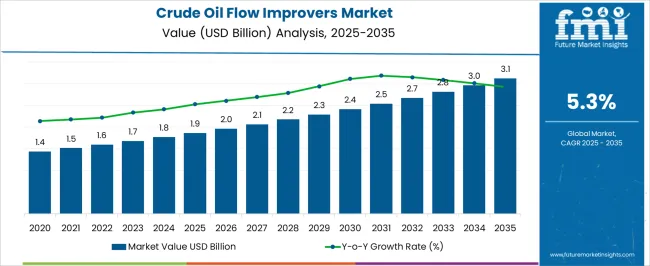
Quick Stats for Crude Oil Flow Improvers Market

  • Crude Oil Flow Improvers Market Value (2025): USD 1.9 billion
  • Crude Oil Flow Improvers Market Forecast Value (2035): USD 3.1 billion
  • Crude Oil Flow Improvers Market Forecast CAGR: 5.3%
  • Leading Segment in Crude Oil Flow Improvers Market in 2025: Paraffin Inhibitors (28.5%)
  • Key Growth Regions in Crude Oil Flow Improvers Market: North America, Asia-Pacific, Europe
  • Top Key Players in Crude Oil Flow Improvers Market: Dorf Ketal Chemicals India Private Limited (India), Schlumberger, Clariant, Halliburton, Lubrizol Specialty Products, Inc., BASF SE, Baker Hughes, Nalco Champion, Infineum, Evonik Industries, ExxonMobil, Total S.A, British Petroleum, Weatherford International, National Oil Varco

Crude Oil Flow Improvers Market Market Value Analysis

Crude Oil Flow Improvers Market Key Takeaways

Metric Value
Crude Oil Flow Improvers Market Estimated Value in (2025 E) USD 1.9 billion
Crude Oil Flow Improvers Market Forecast Value in (2035 F) USD 3.1 billion
Forecast CAGR (2025 to 2035) 5.3%

Why is the Crude Oil Flow Improvers Market Growing?

The Crude Oil Flow Improvers market is experiencing steady growth, driven by increasing demand for efficient and uninterrupted crude oil transportation across pipelines and production facilities. Flow improvers are being adopted to address challenges related to wax deposition, paraffin crystallization, and viscosity increase in crude oil under low-temperature conditions. Advanced chemical formulations enhance crude oil fluidity, reduce pipeline blockages, and improve overall operational efficiency.

The market is further supported by rising crude oil production in both established and emerging regions, coupled with the need to optimize transportation logistics and reduce maintenance costs. Environmental and regulatory considerations, including efforts to minimize energy consumption and carbon footprint during oil transport, are encouraging the use of performance-enhancing chemicals.

Technological innovations in polymeric additives, paraffin inhibitors, and multi-functional formulations are enhancing product effectiveness As pipeline infrastructure expands and the demand for uninterrupted crude oil supply grows, the market for flow improvers is expected to witness sustained growth, with continuous innovation and integration of advanced chemistries driving adoption.

Segmental Analysis

The crude oil flow improvers market is segmented by product type, application, and geographic regions. By product type, crude oil flow improvers market is divided into Paraffin Inhibitors, Asphaltene Inhibitors, Scale Inhibitors, Drag Reducing Agent, Hydrate Inhibitors, and Others. In terms of application, crude oil flow improvers market is classified into Extraction, Pipeline, Refinery, and Others. Regionally, the crude oil flow improvers industry is classified into North America, Latin America, Western Europe, Eastern Europe, Balkan & Baltic Countries, Russia & Belarus, Central Asia, East Asia, South Asia & Pacific, and the Middle East & Africa.
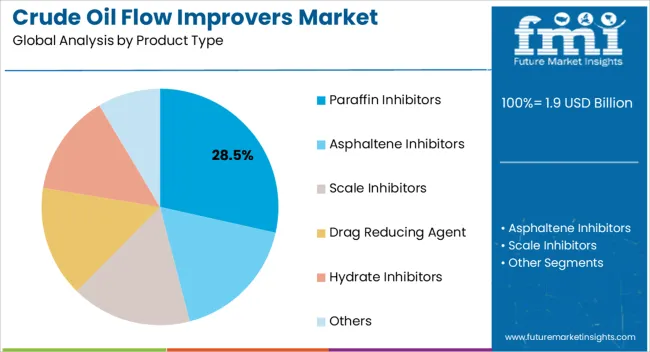
Insights into the Paraffin Inhibitors Product Type Segment

Crude Oil Flow Improvers Market Analysis By Product Type

The paraffin inhibitors segment is projected to hold 28.5% of the market revenue in 2025, establishing it as the leading product type. Growth is being driven by their effectiveness in controlling paraffin wax deposition, which is a primary cause of pipeline blockages and reduced crude oil flow. Paraffin inhibitors modify wax crystal formation, ensuring smooth flow at low temperatures and minimizing maintenance and operational downtime.

The ability to deploy these inhibitors across diverse crude oil types and varying pipeline conditions enhances their applicability and preference among oil producers and pipeline operators. Continuous research and development in additive formulations have improved thermal stability, performance consistency, and environmental compatibility, further reinforcing adoption.

These inhibitors enable significant cost savings by reducing energy consumption for heating and preventing expensive cleaning operations As the demand for reliable and energy-efficient crude oil transportation continues to rise, paraffin inhibitors are expected to maintain their leading position, driven by their proven performance and operational benefits.
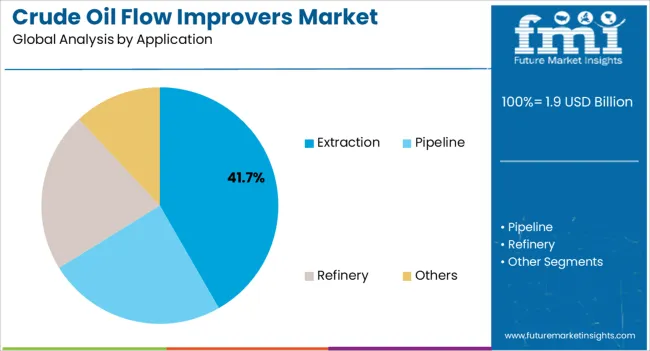
Insights into the Extraction Application Segment

Crude Oil Flow Improvers Market Analysis By Application

The extraction application segment is anticipated to account for 41.7% of the market revenue in 2025, making it the leading application area. Growth is being driven by the critical need to enhance crude oil recovery rates and maintain uninterrupted flow during production operations. Flow improvers facilitate the efficient transport of crude oil from wells to processing units by minimizing viscosity-related challenges and reducing pipeline blockages.

Adoption is further supported by the increasing complexity of extraction operations in mature and high-viscosity fields, where paraffin deposition and flow restrictions can significantly impact productivity. Continuous development of advanced chemical formulations and injection technologies has improved efficacy and operational flexibility.

The use of flow improvers in extraction also supports energy efficiency, reduces operational risks, and contributes to meeting regulatory standards As crude oil production continues to expand globally and operators seek cost-effective and reliable solutions, the extraction application segment is expected to remain the primary driver of market growth, supported by increasing operational efficiency and technological advancements.

Market Overview

Crude Oil Flow Improvers Market Outlook

According to Future Market Insights’ recent market study, the global market will be valued at US$ 1,679.9 Million by 2025. Crude Oil Improvers market value is expected to reach US$ 2,815.5 Million by 2035, with a steady growth rate of 5.3%.

Attributes Details
Market Size 2025 US$ 1,679.9 Million
Market Size 2035 US$ 2815.5 Million
Value CAGR (2025 to 2035) 5.3%
Collective Value Share: Top 3 Countries (2025E) 35% to 40%

Crude oil is one of the most commonly traded commodities with a steady growth rate on a global scale. It is extracted by rigs in an offshore and onshore crude exploration model. Due to its viscosity and the need for an economical and effective method of transfer, crude oil transportation by pipeline is challenging. Therefore, it is crucial to maintain the viscosity of heavy oil for long-distance transportation without compromising the quality or state. The viscosity of crude oil is preserved during processing and transportation by crude oil flow improvers. It serves as an additive that provides suitable solutions at each stage of the extraction of crude oil, from the reservoir to the refinery, and helps to increase production. This additive is used as a drag-reducing compound and it is added to pipeline fluids for minimizing turbulence, preventing blockages and decreasing energy loss.

The market for crude oil flow improvers is being driven by the increase in global crude oil production to meet the rising demand. The demand for crude oil is increasing globally, and a large share of the world's energy basket is met by crude oil. The other non-renewable energy sources cannot provide the demand for energy on a global scale. Crude oil is needed to be delivered and used in an effective and efficient way because it is the main source of energy around the globe. These factors support the growth of the global market for crude oil flow Improvers.

Crude oil flow improvers also offer the best option for the three stages of exploration, transportation, and production refining. It is anticipated that a steady drop in crude oil prices and environmental issues will obstruct market expansion shortly. it is expected that stepping up research initiatives would lead to the creation of efficient and enormous market growth opportunities over the course of the forecasted year.
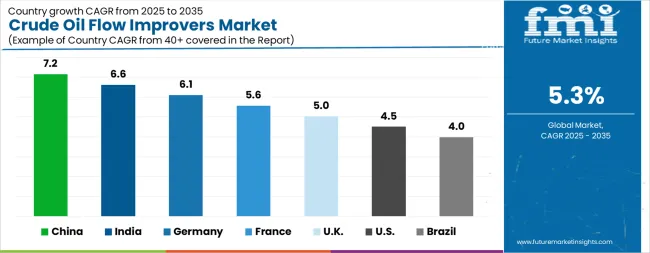
Analysis of Crude Oil Flow Improvers Market By Key Countries

Crude Oil Flow Improvers Market Cagr Analysis By Country

Country CAGR
China 7.2%
India 6.6%
Germany 6.1%
France 5.6%
UK 5.0%
USA 4.5%
Brazil 4.0%

Country-wise Analysis

The Crude Oil Flow Improvers Market is expected to register a CAGR of 5.3% during the forecast period, exhibiting varied country level momentum. China leads with the highest CAGR of 7.2%, followed by India at 6.6%. Developed markets such as Germany, France, and the UK continue to expand steadily, while the USA is likely to grow at consistent rates. Brazil posts the lowest CAGR at 4.0%, yet still underscores a broadly positive trajectory for the global Crude Oil Flow Improvers Market. In 2024, Germany held a dominant revenue in the Western Europe market and is expected to grow with a CAGR of 6.1%. The USA Crude Oil Flow Improvers Market is estimated to be valued at USD 654.4 million in 2025 and is anticipated to reach a valuation of USD 1.0 billion by 2035. Sales are projected to rise at a CAGR of 4.5% over the forecast period between 2025 and 2035. While Japan and South Korea markets are estimated to be valued at USD 94.8 million and USD 54.4 million respectively in 2025.
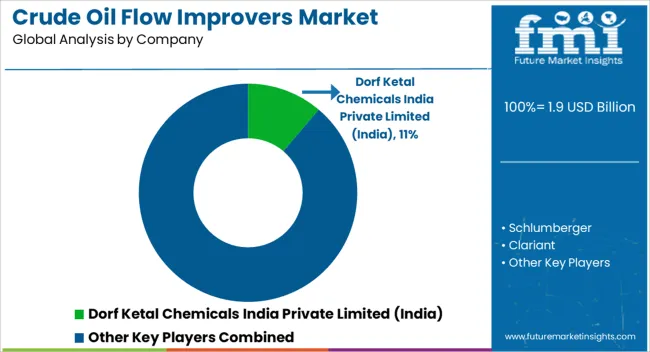
Key Players in the Crude Oil Flow Improvers Market

Crude Oil Flow Improvers Market Analysis By Company

  • Dorf Ketal Chemicals India Private Limited (India)
  • Schlumberger
  • Clariant
  • Halliburton
  • Lubrizol Specialty Products, Inc.
  • BASF SE
  • Baker Hughes
  • Nalco Champion
  • Infineum
  • Evonik Industries
  • ExxonMobil
  • Total S.A
  • British Petroleum
  • Weatherford International
  • National Oil Varco

Scope of the Report

Item Value
Quantitative Units USD 1.9 Billion
Product Type Paraffin Inhibitors, Asphaltene Inhibitors, Scale Inhibitors, Drag Reducing Agent, Hydrate Inhibitors, and Others
Application Extraction, Pipeline, Refinery, and Others
Regions Covered North America, Europe, Asia-Pacific, Latin America, Middle East & Africa
Country Covered United States, Canada, Germany, France, United Kingdom, China, Japan, India, Brazil, South Africa
Key Companies Profiled Dorf Ketal Chemicals India Private Limited (India), Schlumberger, Clariant, Halliburton, Lubrizol Specialty Products, Inc., BASF SE, Baker Hughes, Nalco Champion, Infineum, Evonik Industries, ExxonMobil, Total S.A, British Petroleum, Weatherford International, and National Oil Varco

Crude Oil Flow Improvers Market by Segments

Product Type:

  • Paraffin Inhibitors
  • Asphaltene Inhibitors
  • Scale Inhibitors
  • Drag Reducing Agent
  • Hydrate Inhibitors
  • Others

Application:

  • Extraction
  • Pipeline
  • Refinery
  • Others

Region:

  • North America
    • USA
    • Canada
    • Mexico
  • Latin America
    • Brazil
    • Chile
    • Rest of Latin America
  • Western Europe
    • Germany
    • UK
    • Italy
    • Spain
    • France
    • Nordic
    • BENELUX
    • Rest of Western Europe
  • Eastern Europe
    • Russia
    • Poland
    • Hungary
    • Balkan & Baltic
    • Rest of Eastern Europe
  • East Asia
    • China
    • Japan
    • South Korea
  • South Asia and Pacific
    • India
    • ASEAN
    • Australia & New Zealand
    • Rest of South Asia and Pacific
  • Middle East & Africa
    • Kingdom of Saudi Arabia
    • Other GCC Countries
    • Turkiye
    • South Africa
    • Other African Union
    • Rest of Middle East & Africa

Table of Content

  1. Executive Summary
    • Global Market Outlook
    • Demand-side Trends
    • Supply-side Trends
    • Technology Roadmap Analysis
    • Analysis and Recommendations
  2. Market Overview
    • Market Coverage / Taxonomy
    • Market Definition / Scope / Limitations
  3. Market Background
    • Market Dynamics
      • Drivers
      • Restraints
      • Opportunity
      • Trends
    • Scenario Forecast
      • Demand in Optimistic Scenario
      • Demand in Likely Scenario
      • Demand in Conservative Scenario
    • Opportunity Map Analysis
    • Product Life Cycle Analysis
    • Supply Chain Analysis
    • Investment Feasibility Matrix
    • Value Chain Analysis
    • PESTLE and Porter’s Analysis
    • Regulatory Landscape
    • Regional Parent Market Outlook
    • Production and Consumption Statistics
    • Import and Export Statistics
  4. Global Market Analysis 2020 to 2024 and Forecast, 2025 to 2035
    • Historical Market Size Value (USD Million) Analysis, 2020 to 2024
    • Current and Future Market Size Value (USD Million) Projections, 2025 to 2035
      • Y-o-Y Growth Trend Analysis
      • Absolute $ Opportunity Analysis
  5. Global Market Pricing Analysis 2020 to 2024 and Forecast 2025 to 2035
  6. Global Market Analysis 2020 to 2024 and Forecast 2025 to 2035, By Product Type
    • Introduction / Key Findings
    • Historical Market Size Value (USD Million) Analysis By Product Type , 2020 to 2024
    • Current and Future Market Size Value (USD Million) Analysis and Forecast By Product Type , 2025 to 2035
      • Paraffin Inhibitors
      • Asphaltene Inhibitors
      • Scale Inhibitors
      • Drag Reducing Agent
      • Hydrate Inhibitors
      • Others
    • Y-o-Y Growth Trend Analysis By Product Type , 2020 to 2024
    • Absolute $ Opportunity Analysis By Product Type , 2025 to 2035
  7. Global Market Analysis 2020 to 2024 and Forecast 2025 to 2035, By Application
    • Introduction / Key Findings
    • Historical Market Size Value (USD Million) Analysis By Application, 2020 to 2024
    • Current and Future Market Size Value (USD Million) Analysis and Forecast By Application, 2025 to 2035
      • Extraction
      • Pipeline
      • Refinery
      • Others
    • Y-o-Y Growth Trend Analysis By Application, 2020 to 2024
    • Absolute $ Opportunity Analysis By Application, 2025 to 2035
  8. Global Market Analysis 2020 to 2024 and Forecast 2025 to 2035, By Region
    • Introduction
    • Historical Market Size Value (USD Million) Analysis By Region, 2020 to 2024
    • Current Market Size Value (USD Million) Analysis and Forecast By Region, 2025 to 2035
      • North America
      • Latin America
      • Western Europe
      • Eastern Europe
      • East Asia
      • South Asia and Pacific
      • Middle East & Africa
    • Market Attractiveness Analysis By Region
  9. North America Market Analysis 2020 to 2024 and Forecast 2025 to 2035, By Country
    • Historical Market Size Value (USD Million) Trend Analysis By Market Taxonomy, 2020 to 2024
    • Market Size Value (USD Million) Forecast By Market Taxonomy, 2025 to 2035
      • By Country
        • USA
        • Canada
        • Mexico
      • By Product Type
      • By Application
    • Market Attractiveness Analysis
      • By Country
      • By Product Type
      • By Application
    • Key Takeaways
  10. Latin America Market Analysis 2020 to 2024 and Forecast 2025 to 2035, By Country
    • Historical Market Size Value (USD Million) Trend Analysis By Market Taxonomy, 2020 to 2024
    • Market Size Value (USD Million) Forecast By Market Taxonomy, 2025 to 2035
      • By Country
        • Brazil
        • Chile
        • Rest of Latin America
      • By Product Type
      • By Application
    • Market Attractiveness Analysis
      • By Country
      • By Product Type
      • By Application
    • Key Takeaways
  11. Western Europe Market Analysis 2020 to 2024 and Forecast 2025 to 2035, By Country
    • Historical Market Size Value (USD Million) Trend Analysis By Market Taxonomy, 2020 to 2024
    • Market Size Value (USD Million) Forecast By Market Taxonomy, 2025 to 2035
      • By Country
        • Germany
        • UK
        • Italy
        • Spain
        • France
        • Nordic
        • BENELUX
        • Rest of Western Europe
      • By Product Type
      • By Application
    • Market Attractiveness Analysis
      • By Country
      • By Product Type
      • By Application
    • Key Takeaways
  12. Eastern Europe Market Analysis 2020 to 2024 and Forecast 2025 to 2035, By Country
    • Historical Market Size Value (USD Million) Trend Analysis By Market Taxonomy, 2020 to 2024
    • Market Size Value (USD Million) Forecast By Market Taxonomy, 2025 to 2035
      • By Country
        • Russia
        • Poland
        • Hungary
        • Balkan & Baltic
        • Rest of Eastern Europe
      • By Product Type
      • By Application
    • Market Attractiveness Analysis
      • By Country
      • By Product Type
      • By Application
    • Key Takeaways
  13. East Asia Market Analysis 2020 to 2024 and Forecast 2025 to 2035, By Country
    • Historical Market Size Value (USD Million) Trend Analysis By Market Taxonomy, 2020 to 2024
    • Market Size Value (USD Million) Forecast By Market Taxonomy, 2025 to 2035
      • By Country
        • China
        • Japan
        • South Korea
      • By Product Type
      • By Application
    • Market Attractiveness Analysis
      • By Country
      • By Product Type
      • By Application
    • Key Takeaways
  14. South Asia and Pacific Market Analysis 2020 to 2024 and Forecast 2025 to 2035, By Country
    • Historical Market Size Value (USD Million) Trend Analysis By Market Taxonomy, 2020 to 2024
    • Market Size Value (USD Million) Forecast By Market Taxonomy, 2025 to 2035
      • By Country
        • India
        • ASEAN
        • Australia & New Zealand
        • Rest of South Asia and Pacific
      • By Product Type
      • By Application
    • Market Attractiveness Analysis
      • By Country
      • By Product Type
      • By Application
    • Key Takeaways
  15. Middle East & Africa Market Analysis 2020 to 2024 and Forecast 2025 to 2035, By Country
    • Historical Market Size Value (USD Million) Trend Analysis By Market Taxonomy, 2020 to 2024
    • Market Size Value (USD Million) Forecast By Market Taxonomy, 2025 to 2035
      • By Country
        • Kingdom of Saudi Arabia
        • Other GCC Countries
        • Turkiye
        • South Africa
        • Other African Union
        • Rest of Middle East & Africa
      • By Product Type
      • By Application
    • Market Attractiveness Analysis
      • By Country
      • By Product Type
      • By Application
    • Key Takeaways
  16. Key Countries Market Analysis
    • USA
      • Pricing Analysis
      • Market Share Analysis, 2024
        • By Product Type
        • By Application
    • Canada
      • Pricing Analysis
      • Market Share Analysis, 2024
        • By Product Type
        • By Application
    • Mexico
      • Pricing Analysis
      • Market Share Analysis, 2024
        • By Product Type
        • By Application
    • Brazil
      • Pricing Analysis
      • Market Share Analysis, 2024
        • By Product Type
        • By Application
    • Chile
      • Pricing Analysis
      • Market Share Analysis, 2024
        • By Product Type
        • By Application
    • Germany
      • Pricing Analysis
      • Market Share Analysis, 2024
        • By Product Type
        • By Application
    • UK
      • Pricing Analysis
      • Market Share Analysis, 2024
        • By Product Type
        • By Application
    • Italy
      • Pricing Analysis
      • Market Share Analysis, 2024
        • By Product Type
        • By Application
    • Spain
      • Pricing Analysis
      • Market Share Analysis, 2024
        • By Product Type
        • By Application
    • France
      • Pricing Analysis
      • Market Share Analysis, 2024
        • By Product Type
        • By Application
    • India
      • Pricing Analysis
      • Market Share Analysis, 2024
        • By Product Type
        • By Application
    • ASEAN
      • Pricing Analysis
      • Market Share Analysis, 2024
        • By Product Type
        • By Application
    • Australia & New Zealand
      • Pricing Analysis
      • Market Share Analysis, 2024
        • By Product Type
        • By Application
    • China
      • Pricing Analysis
      • Market Share Analysis, 2024
        • By Product Type
        • By Application
    • Japan
      • Pricing Analysis
      • Market Share Analysis, 2024
        • By Product Type
        • By Application
    • South Korea
      • Pricing Analysis
      • Market Share Analysis, 2024
        • By Product Type
        • By Application
    • Russia
      • Pricing Analysis
      • Market Share Analysis, 2024
        • By Product Type
        • By Application
    • Poland
      • Pricing Analysis
      • Market Share Analysis, 2024
        • By Product Type
        • By Application
    • Hungary
      • Pricing Analysis
      • Market Share Analysis, 2024
        • By Product Type
        • By Application
    • Kingdom of Saudi Arabia
      • Pricing Analysis
      • Market Share Analysis, 2024
        • By Product Type
        • By Application
    • Turkiye
      • Pricing Analysis
      • Market Share Analysis, 2024
        • By Product Type
        • By Application
    • South Africa
      • Pricing Analysis
      • Market Share Analysis, 2024
        • By Product Type
        • By Application
  17. Market Structure Analysis
    • Competition Dashboard
    • Competition Benchmarking
    • Market Share Analysis of Top Players
      • By Regional
      • By Product Type
      • By Application
  18. Competition Analysis
    • Competition Deep Dive
      • Dorf Ketal Chemicals India Private Limited (India)
        • Overview
        • Product Portfolio
        • Profitability by Market Segments (Product/Age /Sales Channel/Region)
        • Sales Footprint
        • Strategy Overview
          • Marketing Strategy
          • Product Strategy
          • Channel Strategy
      • Schlumberger
      • Clariant
      • Halliburton
      • Lubrizol Specialty Products, Inc.
      • BASF SE
      • Baker Hughes
      • Nalco Champion
      • Infineum
      • Evonik Industries
      • ExxonMobil
      • Total S.A
      • British Petroleum
      • Weatherford International
      • National Oil Varco
  19. Assumptions & Acronyms Used
  20. Research Methodology

List of Tables

  • Table 1: Global Market Value (USD Million) Forecast by Region, 2020 to 2035
  • Table 2: Global Market Value (USD Million) Forecast by Product Type , 2020 to 2035
  • Table 3: Global Market Value (USD Million) Forecast by Application, 2020 to 2035
  • Table 4: North America Market Value (USD Million) Forecast by Country, 2020 to 2035
  • Table 5: North America Market Value (USD Million) Forecast by Product Type , 2020 to 2035
  • Table 6: North America Market Value (USD Million) Forecast by Application, 2020 to 2035
  • Table 7: Latin America Market Value (USD Million) Forecast by Country, 2020 to 2035
  • Table 8: Latin America Market Value (USD Million) Forecast by Product Type , 2020 to 2035
  • Table 9: Latin America Market Value (USD Million) Forecast by Application, 2020 to 2035
  • Table 10: Western Europe Market Value (USD Million) Forecast by Country, 2020 to 2035
  • Table 11: Western Europe Market Value (USD Million) Forecast by Product Type , 2020 to 2035
  • Table 12: Western Europe Market Value (USD Million) Forecast by Application, 2020 to 2035
  • Table 13: Eastern Europe Market Value (USD Million) Forecast by Country, 2020 to 2035
  • Table 14: Eastern Europe Market Value (USD Million) Forecast by Product Type , 2020 to 2035
  • Table 15: Eastern Europe Market Value (USD Million) Forecast by Application, 2020 to 2035
  • Table 16: East Asia Market Value (USD Million) Forecast by Country, 2020 to 2035
  • Table 17: East Asia Market Value (USD Million) Forecast by Product Type , 2020 to 2035
  • Table 18: East Asia Market Value (USD Million) Forecast by Application, 2020 to 2035
  • Table 19: South Asia and Pacific Market Value (USD Million) Forecast by Country, 2020 to 2035
  • Table 20: South Asia and Pacific Market Value (USD Million) Forecast by Product Type , 2020 to 2035
  • Table 21: South Asia and Pacific Market Value (USD Million) Forecast by Application, 2020 to 2035
  • Table 22: Middle East & Africa Market Value (USD Million) Forecast by Country, 2020 to 2035
  • Table 23: Middle East & Africa Market Value (USD Million) Forecast by Product Type , 2020 to 2035
  • Table 24: Middle East & Africa Market Value (USD Million) Forecast by Application, 2020 to 2035

List of Figures

  • Figure 1: Global Market Pricing Analysis
  • Figure 2: Global Market Value (USD Million) Forecast 2020 to 2035
  • Figure 3: Global Market Value Share and BPS Analysis by Product Type , 2025 and 2035
  • Figure 4: Global Market Y-o-Y Growth Comparison by Product Type , 2025 to 2035
  • Figure 5: Global Market Attractiveness Analysis by Product Type
  • Figure 6: Global Market Value Share and BPS Analysis by Application, 2025 and 2035
  • Figure 7: Global Market Y-o-Y Growth Comparison by Application, 2025 to 2035
  • Figure 8: Global Market Attractiveness Analysis by Application
  • Figure 9: Global Market Value (USD Million) Share and BPS Analysis by Region, 2025 and 2035
  • Figure 10: Global Market Y-o-Y Growth Comparison by Region, 2025 to 2035
  • Figure 11: Global Market Attractiveness Analysis by Region
  • Figure 12: North America Market Incremental Dollar Opportunity, 2025 to 2035
  • Figure 13: Latin America Market Incremental Dollar Opportunity, 2025 to 2035
  • Figure 14: Western Europe Market Incremental Dollar Opportunity, 2025 to 2035
  • Figure 15: Eastern Europe Market Incremental Dollar Opportunity, 2025 to 2035
  • Figure 16: East Asia Market Incremental Dollar Opportunity, 2025 to 2035
  • Figure 17: South Asia and Pacific Market Incremental Dollar Opportunity, 2025 to 2035
  • Figure 18: Middle East & Africa Market Incremental Dollar Opportunity, 2025 to 2035
  • Figure 19: North America Market Value Share and BPS Analysis by Country, 2025 and 2035
  • Figure 20: North America Market Value Share and BPS Analysis by Product Type , 2025 and 2035
  • Figure 21: North America Market Y-o-Y Growth Comparison by Product Type , 2025 to 2035
  • Figure 22: North America Market Attractiveness Analysis by Product Type
  • Figure 23: North America Market Value Share and BPS Analysis by Application, 2025 and 2035
  • Figure 24: North America Market Y-o-Y Growth Comparison by Application, 2025 to 2035
  • Figure 25: North America Market Attractiveness Analysis by Application
  • Figure 26: Latin America Market Value Share and BPS Analysis by Country, 2025 and 2035
  • Figure 27: Latin America Market Value Share and BPS Analysis by Product Type , 2025 and 2035
  • Figure 28: Latin America Market Y-o-Y Growth Comparison by Product Type , 2025 to 2035
  • Figure 29: Latin America Market Attractiveness Analysis by Product Type
  • Figure 30: Latin America Market Value Share and BPS Analysis by Application, 2025 and 2035
  • Figure 31: Latin America Market Y-o-Y Growth Comparison by Application, 2025 to 2035
  • Figure 32: Latin America Market Attractiveness Analysis by Application
  • Figure 33: Western Europe Market Value Share and BPS Analysis by Country, 2025 and 2035
  • Figure 34: Western Europe Market Value Share and BPS Analysis by Product Type , 2025 and 2035
  • Figure 35: Western Europe Market Y-o-Y Growth Comparison by Product Type , 2025 to 2035
  • Figure 36: Western Europe Market Attractiveness Analysis by Product Type
  • Figure 37: Western Europe Market Value Share and BPS Analysis by Application, 2025 and 2035
  • Figure 38: Western Europe Market Y-o-Y Growth Comparison by Application, 2025 to 2035
  • Figure 39: Western Europe Market Attractiveness Analysis by Application
  • Figure 40: Eastern Europe Market Value Share and BPS Analysis by Country, 2025 and 2035
  • Figure 41: Eastern Europe Market Value Share and BPS Analysis by Product Type , 2025 and 2035
  • Figure 42: Eastern Europe Market Y-o-Y Growth Comparison by Product Type , 2025 to 2035
  • Figure 43: Eastern Europe Market Attractiveness Analysis by Product Type
  • Figure 44: Eastern Europe Market Value Share and BPS Analysis by Application, 2025 and 2035
  • Figure 45: Eastern Europe Market Y-o-Y Growth Comparison by Application, 2025 to 2035
  • Figure 46: Eastern Europe Market Attractiveness Analysis by Application
  • Figure 47: East Asia Market Value Share and BPS Analysis by Country, 2025 and 2035
  • Figure 48: East Asia Market Value Share and BPS Analysis by Product Type , 2025 and 2035
  • Figure 49: East Asia Market Y-o-Y Growth Comparison by Product Type , 2025 to 2035
  • Figure 50: East Asia Market Attractiveness Analysis by Product Type
  • Figure 51: East Asia Market Value Share and BPS Analysis by Application, 2025 and 2035
  • Figure 52: East Asia Market Y-o-Y Growth Comparison by Application, 2025 to 2035
  • Figure 53: East Asia Market Attractiveness Analysis by Application
  • Figure 54: South Asia and Pacific Market Value Share and BPS Analysis by Country, 2025 and 2035
  • Figure 55: South Asia and Pacific Market Value Share and BPS Analysis by Product Type , 2025 and 2035
  • Figure 56: South Asia and Pacific Market Y-o-Y Growth Comparison by Product Type , 2025 to 2035
  • Figure 57: South Asia and Pacific Market Attractiveness Analysis by Product Type
  • Figure 58: South Asia and Pacific Market Value Share and BPS Analysis by Application, 2025 and 2035
  • Figure 59: South Asia and Pacific Market Y-o-Y Growth Comparison by Application, 2025 to 2035
  • Figure 60: South Asia and Pacific Market Attractiveness Analysis by Application
  • Figure 61: Middle East & Africa Market Value Share and BPS Analysis by Country, 2025 and 2035
  • Figure 62: Middle East & Africa Market Value Share and BPS Analysis by Product Type , 2025 and 2035
  • Figure 63: Middle East & Africa Market Y-o-Y Growth Comparison by Product Type , 2025 to 2035
  • Figure 64: Middle East & Africa Market Attractiveness Analysis by Product Type
  • Figure 65: Middle East & Africa Market Value Share and BPS Analysis by Application, 2025 and 2035
  • Figure 66: Middle East & Africa Market Y-o-Y Growth Comparison by Application, 2025 to 2035
  • Figure 67: Middle East & Africa Market Attractiveness Analysis by Application
  • Figure 68: Global Market – Tier Structure Analysis
  • Figure 69: Global Market – Company Share Analysis

Frequently Asked Questions

How big is the crude oil flow improvers market in 2025?

The global crude oil flow improvers market is estimated to be valued at USD 1.9 billion in 2025.

What will be the size of crude oil flow improvers market in 2035?

The market size for the crude oil flow improvers market is projected to reach USD 3.1 billion by 2035.

How much will be the crude oil flow improvers market growth between 2025 and 2035?

The crude oil flow improvers market is expected to grow at a 5.3% CAGR between 2025 and 2035.

What are the key product types in the crude oil flow improvers market?

The key product types in crude oil flow improvers market are paraffin inhibitors, asphaltene inhibitors, scale inhibitors, drag reducing agent, hydrate inhibitors and others.

Which application segment to contribute significant share in the crude oil flow improvers market in 2025?

In terms of application, extraction segment to command 41.7% share in the crude oil flow improvers market in 2025.

Explore Similar Insights

Future Market Insights

Crude Oil Flow Improvers Market

Chat With MaRIA

Chat With

MaRIA

Hi There, I am MaRIA, Your Market Research Intelligence Assistant. How may I help you?