VVT Actuators Market Outlook (2022-2032)

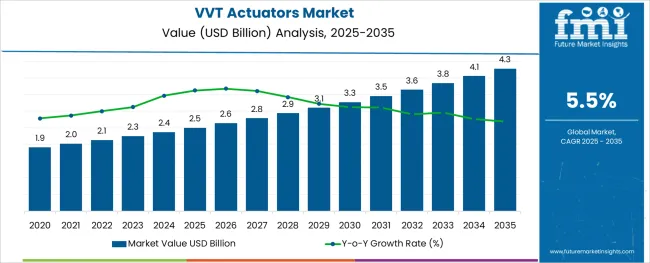
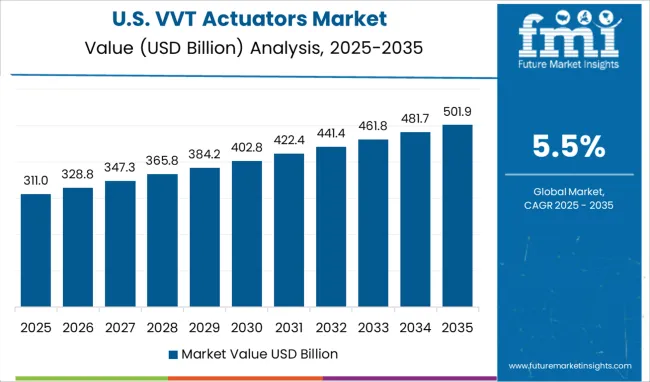
[324 Pages Report] The global VVT actuators market size is anticipated to be valued at US$ 2,134.3 Million in 2022 and is projected to surpass US$ 3,630 Million by 2032. The demand for VVT actuators is projected to rise at a steady CAGR of 5.5% during the forecast period.

The VVT actuators market share is anticipated to grow as they enable mechanisms like advancing or retarding valve timings, changing or overlapping valves, and in some situations, even lifting valves. VVT solenoid actuator aids in many ways. For example, it precisely changes the opening and closing timing of the intake and exhaust valves in accordance with the demands of driving conditions. Due to these factors, the sales of VVT actuators are rising rapidly over the forecast period.

VVT actuators regulate VVT actuator symptoms valve timing and greatly enhance fuel efficiency and reduce emissions. These actuators commonly use oil pressure and hydraulics to adjust the position of a phaser mechanism. As a result of the rising demand, VVT actuator replacement cost is anticipated to rise during 2022-2032.

Attribute Details
VVT Actuators Market Value (2022) US$ 2,134.3 Million
VVT Actuators Market Anticipated Value (2032) US$ 3,630.0 Million
VVT Actuators Projected Growth Rate (2022 to 2032) 5.5%

The VVT actuators market research suggests that Problems related to engine performance or valve timing-related fault codes are resolved with the help of VVT actuators. Without the necessary equipment, such conditions might be difficult to diagnose. Variable valve timing (VVT) actuators help to improve the engine's volumetric efficiency and reduce the number of exhaust gases the car produces. Due to these factors, the demand for VVT actuators is projected to witness a sharp rise throughout the forecast period.

Manufacturers of VVT actuators are continuously trying to make their products long-lasting so that technicians can activate a variable valve timing actuator using an actuator test and then listen for changes in the engine's auditory note and/or speed.

Don't pay for what you don't need

Customize your report by selecting specific countries or regions and save 30%!

What are the Key VVT Actuators Market Dynamics?

Rising automation in the automotive industry is one of the primary factors driving the sales of VVT actuators. Over the projection period, it is anticipated that the global automotive market is poised to grow steadily due to increased disposable income. As a result of this, it is projected that a sizable portion of demand for VVT actuators is anticipated to come from emerging economies.

The VVT actuators market size is anticipated to rise due to the growing emphasis on enhancing fuel efficiency and implementing automation for improved control. Furthermore, the demand is rising as a result of the increased use of VVT actuators by regional and local automakers. The sales of VVT actuator is likely to witness swift growth as many nations are likely to make it mandatory for VVT actuators to be used in passenger cars due to rising fuel efficiency. This factor is likely to have a positive impact on the global VVT actuators market.

Additionally, the demand for VVT actuators has increased with the development of autonomous automobiles, and this factor is anticipated to drive the global VVT actuators market throughout the forecast period. The rising cost of VVT Actuators, however, keeps the technology limited to expensive cars.

Applications of VVT Actuators Boosting the Overall Market Share 2022-2032

During the Actuator Test, Normal Idle

The waveform can be used to verify the proper operation of the variable valve timing circuit mechanically, hydraulically, and electrically. VVT actuators are essential for testing the engine's dynamic valve timing, which is another factor anticipated to boost the demand during the forecast period.

Tests of In-Cylinder Pressure

With the engine running, the in-cylinder conditions can be examined using a pressure transducer. This test can check the valve timing and look for problems with cylinder sealing.
Nikhil Kaitwade
Nikhil Kaitwade

Principal Consultant

Talk to Analyst

Find your sweet spots for generating winning opportunities in this market.

Regional Analysis

How is the Performance of the North America VVT Actuators Market?

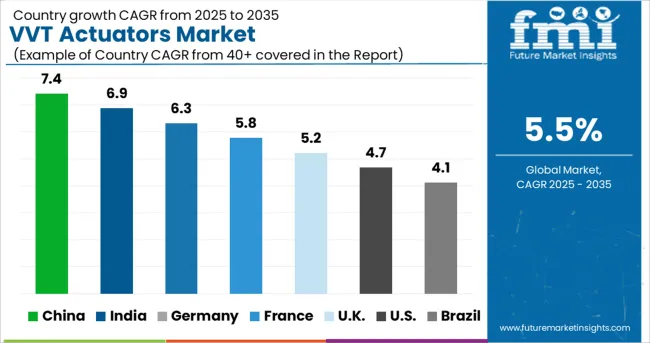
During the forecast period, North America is expected to hold the second largest share of 12.0% in the global VVT actuators market. The growth in the region is owing to the presence of some of the most cutting-edge automotive automation technology and the high rate of technological adoption.

Demand for VVT actuators in the USA is predicted to soar by the conclusion of the projection period as more businesses enter the autonomous vehicle market. Furthermore, it is anticipated that over the projection period, Latin America is projected to increase its demand for automobiles, which is likely to increase the region's sales of VVT actuators.
What is the Growth Outlook for the Europe VVT Actuators Market?

Europe is projected to hold the largest share of 22% in the VVT actuators market during the forecast period. Due to the presence of some of the most well-known manufacturers in this region, the demand for VVT actuators has increased. The majority of passenger buses and cars in the European areas have VVT actuators, which encourage fuel efficiency.

Furthermore, VVT Actuators are witnessing high demand in Eastern Europe, not just from the automotive and marine industries but also from the aerospace industry.

Get the data you need at a Fraction of the cost

Personalize your report by choosing insights you need
and save 40%!

Start-up Ecosystem

Startups Strengthening their Foothold in the Market by following Latest Trends

Installing twin VVT actuators in compact-size passenger car engines is one of the most recent innovations that are likely to take off in the global VVT actuators market. The startups in the VVT actuators market are concentrating on giving tiny-size cars dual VVT systems in order to increase their fuel efficiency and engine power output.

Furthermore, OEMs are increasingly working on downsizing engines to lower the overall curb weight and increase mileage numbers as customers are being compelled by fluctuating fuel prices to purchase fuel-efficient vehicles. In the forecast period, the VVT actuators market is projected to expand as a result of consumer demand for fuel-efficient automobiles since dual VVT systems provide a lightweight, affordable solution for increasing fuel efficiency and controlling emissions.
Competitive Landscape

What are the Growth Strategies followed by Key Players in the VVT Actuators Market?

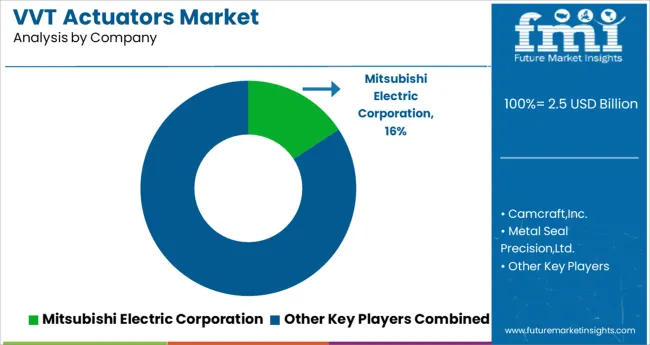
Few well-known companies dominate the global VVT actuators market. The major players in the market are concentrating on expanding their clientele and boosting their R&D expenditures. The level of competition in the market is likely to increase due to advancements in technology and governmental laws.

The majority of market developments are a result of the increase in sales of mid and full-size passenger cars, and manufacturers are gradually adding cruise control and VVT systems with the help of VVT actuators to compact cars to boost their performance and fuel economy.

The key market players profiled in the report include Mikuni American Corporation, Autorun, Delphi Automotive LLP, Mitsubishi Electric Corporation, Metal Seal Precision, Ltd., and Zhejiang DiMa Vehicle Industry Company.

Recent Developments in the VVT Actuators Market:

  • The standard line of precision RPC-1.00 connectors from Rosenberger, a global leader in the manufacture of connector solutions for high-frequency and fibre optic technology, has been redesigned and greatly enlarged.
  • A new partnership between 3D Systems and Fleet Space Technologies has resulted in the creation of ground-breaking RF patch antennas for use on Fleet Space Technologies' Alpha satellite constellation. 3D Systems is a market leader in providing additive manufacturing solutions and expertise to advanced applications and industries.

Report Scope

Report Attribute Details
Growth Rate CAGR of 5.5% from 2022 to 2032
Base Year for Estimation 2022
Historical Data 2016 to 2021
Forecast Period 2022 to 2032
Quantitative Units Revenue in US$ million and CAGR from 2022 to 2032
Report Coverage Revenue Forecast, Volume Forecast, Company Ranking, Competitive Landscape, Growth Factors, Trends and Pricing Analysis
Segments Covered
  • Placement Side
  • Implementation Method
  • End Use Application
  • Region
Regions Covered
  • North America
  • Latin America
  • Europe
  • East Asia
  • South Asia
  • Oceania
  • Middle East and Africa
Key Countries Profiled
  • U.S
  • Canada
  • Brazil
  • Argentina
  • Germany
  • U.K
  • France
  • Spain
  • Italy
  • Nordics
  • BENELUX
  • Australia & New Zealand
  • China
  • India
  • ASEAN
  • GCC
  • South Africa
Key Companies Profiled
  • Mitsubishi Electric Corporation
  • Camcraft, Inc.
  • Metal Seal Precision, Ltd.
  • Mikuni American Corporation
  • Zhejiang DiMa Vehicle Industry Company
  • Autorun
  • GOGO Automatic Company Ltd
  • Delphi Automotive LLP
Customization Available Upon Request

Key Market Segments in the VVT Actuators Market

By Placement Side:

  • Intake Side
  • Exhaust Side
  • Others

By Implementation Method:

  • Cam Switching
  • Cam Phasing
  • Oscillating Cam
  • Eccentric cam drive
  • Three-dimensional cam lobe
  • Two shaft combined cam lobe profile
  • Coaxial two shaft combined cam lobe profile
  • Helical camshaft
  • Camless engines

By End Use Application:

  • Automotive
  • Aerospace & Avionics
  • Marine
  • Others

By Region:

  • North America
  • Latin America
  • Asia Pacific
  • MEA
  • Europe

Frequently Asked Questions

What is the Growth Outlook for the VVT Actuators Market?

The VVT actuators market is predicted to register a CAGR of 5.5% from 2022-to 2032.

Which Region Leads the VVT Actuators Market?

Europe is anticipated to lead the VVT actuators market during the forecast period.

How much Growth Potential does the VVT Actuators Market hold?

The VVT actuators market is likely to hold a valuation of US$ 3,630.0 Mn by 2032.

Which Placement Side dominates the VVT Actuators Market?

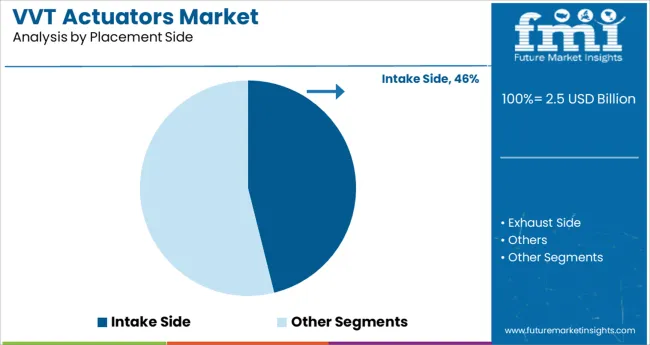
Intake side segment dominates VVT actuators market.

Table of Content
1. Executive Summary

    1.1. Global Market Outlook

    1.2. Demand-side Trends

    1.3. Supply-side Trends

    1.4. Technology Roadmap Analysis

    1.5. Analysis and Recommendations

2. Market Overview

    2.1. Market Coverage / Taxonomy

    2.2. Market Definition / Scope / Limitations

3. Market Background

    3.1. Market Dynamics

        3.1.1. Drivers

        3.1.2. Restraints

        3.1.3. Opportunity

        3.1.4. Trends

    3.2. Scenario Forecast

        3.2.1. Demand in Optimistic Scenario

        3.2.2. Demand in Likely Scenario

        3.2.3. Demand in Conservative Scenario

    3.3. Opportunity Map Analysis

    3.4. Product Life Cycle Analysis

    3.5. Supply Chain Analysis

        3.5.1. Supply Side Participants and their Roles

            3.5.1.1. Producers

            3.5.1.2. Mid-Level Participants (Traders/ Agents/ Brokers)

            3.5.1.3. Wholesalers and Distributors

        3.5.2. Value Added and Value Created at Node in the Supply Chain

        3.5.3. List of Raw Material Suppliers

        3.5.4. List of Existing and Potential Buyer’s

    3.6. Investment Feasibility Matrix

    3.7. Value Chain Analysis

        3.7.1. Profit Margin Analysis

        3.7.2. Wholesalers and Distributors

        3.7.3. Retailers

    3.8. PESTLE and Porter’s Analysis

    3.9. Regulatory Landscape

        3.9.1. By Key Regions

        3.9.2. By Key Countries

    3.10. Regional Parent Market Outlook

    3.11. Production and Consumption Statistics

    3.12. Import and Export Statistics

4. Global VVT Actuators Market Analysis 2017-2021 and Forecast, 2022-2032

    4.1. Historical Market Size Value (US$ Mn) & Volume (Units) Analysis, 2017-2021

    4.2. Current and Future Market Size Value (US$ Mn) & Volume (Units) Projections, 2022-2032

        4.2.1. Y-o-Y Growth Trend Analysis

        4.2.2. Absolute $ Opportunity Analysis

5. Global VVT Actuators Market Analysis 2017-2021 and Forecast 2022-2032, By Placement Side

    5.1. Introduction / Key Findings

    5.2. Historical Market Size Value (US$ Mn) & Volume (Units) Analysis By Placement Side, 2017-2021

    5.3. Current and Future Market Size Value (US$ Mn) & Volume (Units) Analysis and Forecast By Placement Side, 2022-2032

        5.3.1. Intake Side

        5.3.2. Exhaust Side

        5.3.3. Others

    5.4. Y-o-Y Growth Trend Analysis By Placement Side, 2017-2021

    5.5. Absolute $ Opportunity Analysis By Placement Side, 2022-2032

6. Global VVT Actuators Market Analysis 2017-2021 and Forecast 2022-2032, By Implementation method

    6.1. Introduction / Key Findings

    6.2. Historical Market Size Value (US$ Mn) & Volume (Units) Analysis By Implementation method, 2017-2021

    6.3. Current and Future Market Size Value (US$ Mn) & Volume (Units) Analysis and Forecast By Implementation method, 2022-2032

        6.3.1. Cam Switching

        6.3.2. Cam Phasing

        6.3.3. Oscillating Cam

        6.3.4. Eccentric cam drive

        6.3.5. Three-dimensional cam lobe

        6.3.6. Two shaft combined cam lobe profile

        6.3.7. Coaxial two shaft combined cam lobe profile

        6.3.8. Helical camshaft

        6.3.9. Camless engines

    6.4. Y-o-Y Growth Trend Analysis By Implementation method, 2017-2021

    6.5. Absolute $ Opportunity Analysis By Implementation method, 2022-2032

7. Global VVT Actuators Market Analysis 2017-2021 and Forecast 2022-2032, By End-Use

    7.1. Introduction / Key Findings

    7.2. Historical Market Size Value (US$ Mn) & Volume (Units) Analysis By End-Use, 2017-2021

    7.3. Current and Future Market Size Value (US$ Mn) & Volume (Units) Analysis and Forecast By End-Use, 2022-2032

        7.3.1. Automotive

        7.3.2. Aerospace & Avionics

        7.3.3. Marine

        7.3.4. Others

    7.4. Y-o-Y Growth Trend Analysis By End-Use, 2017-2021

    7.5. Absolute $ Opportunity Analysis By End-Use, 2022-2032

8. Global VVT Actuators Market Analysis 2017-2021 and Forecast 2022-2032, By Region

    8.1. Introduction

    8.2. Historical Market Size Value (US$ Mn) & Volume (Units) Analysis By Region, 2017-2021

    8.3. Current Market Size Value (US$ Mn) & Volume (Units) Analysis and Forecast By Region, 2022-2032

        8.3.1. North America

        8.3.2. Latin America

        8.3.3. Europe

        8.3.4. Asia Pacific

        8.3.5. MEA

    8.4. Market Attractiveness Analysis By Region

9. North America VVT Actuators Market Analysis 2017-2021 and Forecast 2022-2032, By Country

    9.1. Historical Market Size Value (US$ Mn) & Volume (Units) Trend Analysis By Market Taxonomy, 2017-2021

    9.2. Market Size Value (US$ Mn) & Volume (Units) Forecast By Market Taxonomy, 2022-2032

        9.2.1. By Country

            9.2.1.1. U.S.

            9.2.1.2. Canada

        9.2.2. By Placement Side

        9.2.3. By Implementation method

        9.2.4. By End-Use

    9.3. Market Attractiveness Analysis

        9.3.1. By Country

        9.3.2. By Placement Side

        9.3.3. By Implementation method

        9.3.4. By End-Use

    9.4. Key Takeaways

10. Latin America VVT Actuators Market Analysis 2017-2021 and Forecast 2022-2032, By Country

    10.1. Historical Market Size Value (US$ Mn) & Volume (Units) Trend Analysis By Market Taxonomy, 2017-2021

    10.2. Market Size Value (US$ Mn) & Volume (Units) Forecast By Market Taxonomy, 2022-2032

        10.2.1. By Country

            10.2.1.1. Brazil

            10.2.1.2. Mexico

            10.2.1.3. Rest of Latin America

        10.2.2. By Placement Side

        10.2.3. By Implementation method

        10.2.4. By End-Use

    10.3. Market Attractiveness Analysis

        10.3.1. By Country

        10.3.2. By Placement Side

        10.3.3. By Implementation method

        10.3.4. By End-Use

    10.4. Key Takeaways

11. Europe VVT Actuators Market Analysis 2017-2021 and Forecast 2022-2032, By Country

    11.1. Historical Market Size Value (US$ Mn) & Volume (Units) Trend Analysis By Market Taxonomy, 2017-2021

    11.2. Market Size Value (US$ Mn) & Volume (Units) Forecast By Market Taxonomy, 2022-2032

        11.2.1. By Country

            11.2.1.1. Germany

            11.2.1.2. U.K.

            11.2.1.3. France

            11.2.1.4. Spain

            11.2.1.5. Italy

            11.2.1.6. Rest of Europe

        11.2.2. By Placement Side

        11.2.3. By Implementation method

        11.2.4. By End-Use

    11.3. Market Attractiveness Analysis

        11.3.1. By Country

        11.3.2. By Placement Side

        11.3.3. By Implementation method

        11.3.4. By End-Use

    11.4. Key Takeaways

12. Asia Pacific VVT Actuators Market Analysis 2017-2021 and Forecast 2022-2032, By Country

    12.1. Historical Market Size Value (US$ Mn) & Volume (Units) Trend Analysis By Market Taxonomy, 2017-2021

    12.2. Market Size Value (US$ Mn) & Volume (Units) Forecast By Market Taxonomy, 2022-2032

        12.2.1. By Country

            12.2.1.1. China

            12.2.1.2. Japan

            12.2.1.3. South Korea

            12.2.1.4. Malaysia

            12.2.1.5. Singapore

            12.2.1.6. Australia

            12.2.1.7. New Zealand

            12.2.1.8. Rest of APAC

        12.2.2. By Placement Side

        12.2.3. By Implementation method

        12.2.4. By End-Use

    12.3. Market Attractiveness Analysis

        12.3.1. By Country

        12.3.2. By Placement Side

        12.3.3. By Implementation method

        12.3.4. By End-Use

    12.4. Key Takeaways

13. MEA VVT Actuators Market Analysis 2017-2021 and Forecast 2022-2032, By Country

    13.1. Historical Market Size Value (US$ Mn) & Volume (Units) Trend Analysis By Market Taxonomy, 2017-2021

    13.2. Market Size Value (US$ Mn) & Volume (Units) Forecast By Market Taxonomy, 2022-2032

        13.2.1. By Country

            13.2.1.1. GCC Countries

            13.2.1.2. South Africa

            13.2.1.3. Israel

            13.2.1.4. Rest of MEA

        13.2.2. By Placement Side

        13.2.3. By Implementation method

        13.2.4. By End-Use

    13.3. Market Attractiveness Analysis

        13.3.1. By Country

        13.3.2. By Placement Side

        13.3.3. By Implementation method

        13.3.4. By End-Use

    13.4. Key Takeaways

14. Key Countries VVT Actuators Market Analysis

    14.1. U.S.

        14.1.1. Pricing Analysis

        14.1.2. Market Share Analysis, 2021

            14.1.2.1. By Placement Side

            14.1.2.2. By Implementation method

            14.1.2.3. By End-Use

    14.2. Canada

        14.2.1. Pricing Analysis

        14.2.2. Market Share Analysis, 2021

            14.2.2.1. By Placement Side

            14.2.2.2. By Implementation method

            14.2.2.3. By End-Use

    14.3. Brazil

        14.3.1. Pricing Analysis

        14.3.2. Market Share Analysis, 2021

            14.3.2.1. By Placement Side

            14.3.2.2. By Implementation method

            14.3.2.3. By End-Use

    14.4. Mexico

        14.4.1. Pricing Analysis

        14.4.2. Market Share Analysis, 2021

            14.4.2.1. By Placement Side

            14.4.2.2. By Implementation method

            14.4.2.3. By End-Use

    14.5. Germany

        14.5.1. Pricing Analysis

        14.5.2. Market Share Analysis, 2021

            14.5.2.1. By Placement Side

            14.5.2.2. By Implementation method

            14.5.2.3. By End-Use

    14.6. U.K.

        14.6.1. Pricing Analysis

        14.6.2. Market Share Analysis, 2021

            14.6.2.1. By Placement Side

            14.6.2.2. By Implementation method

            14.6.2.3. By End-Use

    14.7. France

        14.7.1. Pricing Analysis

        14.7.2. Market Share Analysis, 2021

            14.7.2.1. By Placement Side

            14.7.2.2. By Implementation method

            14.7.2.3. By End-Use

    14.8. Spain

        14.8.1. Pricing Analysis

        14.8.2. Market Share Analysis, 2021

            14.8.2.1. By Placement Side

            14.8.2.2. By Implementation method

            14.8.2.3. By End-Use

    14.9. Italy

        14.9.1. Pricing Analysis

        14.9.2. Market Share Analysis, 2021

            14.9.2.1. By Placement Side

            14.9.2.2. By Implementation method

            14.9.2.3. By End-Use

    14.10. China

        14.10.1. Pricing Analysis

        14.10.2. Market Share Analysis, 2021

            14.10.2.1. By Placement Side

            14.10.2.2. By Implementation method

            14.10.2.3. By End-Use

    14.11. Japan

        14.11.1. Pricing Analysis

        14.11.2. Market Share Analysis, 2021

            14.11.2.1. By Placement Side

            14.11.2.2. By Implementation method

            14.11.2.3. By End-Use

    14.12. South Korea

        14.12.1. Pricing Analysis

        14.12.2. Market Share Analysis, 2021

            14.12.2.1. By Placement Side

            14.12.2.2. By Implementation method

            14.12.2.3. By End-Use

    14.13. Malaysia

        14.13.1. Pricing Analysis

        14.13.2. Market Share Analysis, 2021

            14.13.2.1. By Placement Side

            14.13.2.2. By Implementation method

            14.13.2.3. By End-Use

    14.14. Singapore

        14.14.1. Pricing Analysis

        14.14.2. Market Share Analysis, 2021

            14.14.2.1. By Placement Side

            14.14.2.2. By Implementation method

            14.14.2.3. By End-Use

    14.15. Australia

        14.15.1. Pricing Analysis

        14.15.2. Market Share Analysis, 2021

            14.15.2.1. By Placement Side

            14.15.2.2. By Implementation method

            14.15.2.3. By End-Use

    14.16. New Zealand

        14.16.1. Pricing Analysis

        14.16.2. Market Share Analysis, 2021

            14.16.2.1. By Placement Side

            14.16.2.2. By Implementation method

            14.16.2.3. By End-Use

    14.17. GCC Countries

        14.17.1. Pricing Analysis

        14.17.2. Market Share Analysis, 2021

            14.17.2.1. By Placement Side

            14.17.2.2. By Implementation method

            14.17.2.3. By End-Use

    14.18. South Africa

        14.18.1. Pricing Analysis

        14.18.2. Market Share Analysis, 2021

            14.18.2.1. By Placement Side

            14.18.2.2. By Implementation method

            14.18.2.3. By End-Use

    14.19. Israel

        14.19.1. Pricing Analysis

        14.19.2. Market Share Analysis, 2021

            14.19.2.1. By Placement Side

            14.19.2.2. By Implementation method

            14.19.2.3. By End-Use

15. Market Structure Analysis

    15.1. Competition Dashboard

    15.2. Competition Benchmarking

    15.3. Market Share Analysis of Top Players

        15.3.1. By Regional

        15.3.2. By Placement Side

        15.3.3. By Implementation method

        15.3.4. By End-Use

16. Competition Analysis

    16.1. Competition Deep Dive

        16.1.1. Mitsubishi Electric Corporation

            16.1.1.1. Overview

            16.1.1.2. Product Portfolio

            16.1.1.3. Profitability by Market Segments

            16.1.1.4. Sales Footprint

            16.1.1.5. Strategy Overview

                16.1.1.5.1. Marketing Strategy

                16.1.1.5.2. Product Strategy

                16.1.1.5.3. Channel Strategy

        16.1.2. Camcraft, Inc.

            16.1.2.1. Overview

            16.1.2.2. Product Portfolio

            16.1.2.3. Profitability by Market Segments

            16.1.2.4. Sales Footprint

            16.1.2.5. Strategy Overview

                16.1.2.5.1. Marketing Strategy

                16.1.2.5.2. Product Strategy

                16.1.2.5.3. Channel Strategy

        16.1.3. Metal Seal Precision, Ltd.

            16.1.3.1. Overview

            16.1.3.2. Product Portfolio

            16.1.3.3. Profitability by Market Segments

            16.1.3.4. Sales Footprint

            16.1.3.5. Strategy Overview

                16.1.3.5.1. Marketing Strategy

                16.1.3.5.2. Product Strategy

                16.1.3.5.3. Channel Strategy

        16.1.4. Mikuni American Corporation

            16.1.4.1. Overview

            16.1.4.2. Product Portfolio

            16.1.4.3. Profitability by Market Segments

            16.1.4.4. Sales Footprint

            16.1.4.5. Strategy Overview

                16.1.4.5.1. Marketing Strategy

                16.1.4.5.2. Product Strategy

                16.1.4.5.3. Channel Strategy

        16.1.5. Zhejiang DiMa Vehicle Industry Company

            16.1.5.1. Overview

            16.1.5.2. Product Portfolio

            16.1.5.3. Profitability by Market Segments

            16.1.5.4. Sales Footprint

            16.1.5.5. Strategy Overview

                16.1.5.5.1. Marketing Strategy

                16.1.5.5.2. Product Strategy

                16.1.5.5.3. Channel Strategy

        16.1.6. Autorun

            16.1.6.1. Overview

            16.1.6.2. Product Portfolio

            16.1.6.3. Profitability by Market Segments

            16.1.6.4. Sales Footprint

            16.1.6.5. Strategy Overview

                16.1.6.5.1. Marketing Strategy

                16.1.6.5.2. Product Strategy

                16.1.6.5.3. Channel Strategy

        16.1.7. GOGO Automatic Company Ltd

            16.1.7.1. Overview

            16.1.7.2. Product Portfolio

            16.1.7.3. Profitability by Market Segments

            16.1.7.4. Sales Footprint

            16.1.7.5. Strategy Overview

                16.1.7.5.1. Marketing Strategy

                16.1.7.5.2. Product Strategy

                16.1.7.5.3. Channel Strategy

        16.1.8. Delphi Automotive LLP

            16.1.8.1. Overview

            16.1.8.2. Product Portfolio

            16.1.8.3. Profitability by Market Segments

            16.1.8.4. Sales Footprint

            16.1.8.5. Strategy Overview

                16.1.8.5.1. Marketing Strategy

                16.1.8.5.2. Product Strategy

                16.1.8.5.3. Channel Strategy

        16.1.9. DiMa Vehicle Industry

            16.1.9.1. Overview

            16.1.9.2. Product Portfolio

            16.1.9.3. Profitability by Market Segments

            16.1.9.4. Sales Footprint

            16.1.9.5. Strategy Overview

                16.1.9.5.1. Marketing Strategy

                16.1.9.5.2. Product Strategy

                16.1.9.5.3. Channel Strategy

        16.1.10. Johnson Controls, Inc.

            16.1.10.1. Overview

            16.1.10.2. Product Portfolio

            16.1.10.3. Profitability by Market Segments

            16.1.10.4. Sales Footprint

            16.1.10.5. Strategy Overview

                16.1.10.5.1. Marketing Strategy

                16.1.10.5.2. Product Strategy

                16.1.10.5.3. Channel Strategy

17. Assumptions & Acronyms Used

18. Research Methodology

Explore Industrial Automation Insights

View Reports