
- Market Size (2026)
- USD 9082.0 Mn
- Forecast (2036)
- USD 12565.0 Mn
- CAGR (2026 to 2036)
- 3.3%
How big is the Whole Milk Powder Market in 2026?
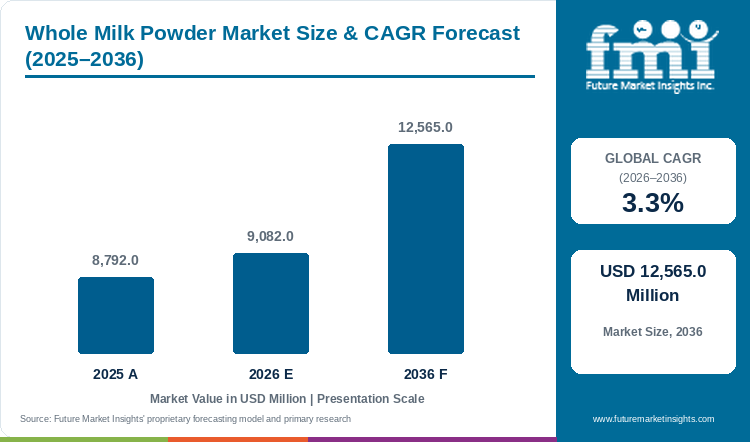
The Whole Milk Powder Market is projected to reach USD 12,565 million by 2036, growing at a 3.3% CAGR from 2026 to 2036. FMI estimates the market at USD 9,082 million in 2026, after it was valued at USD 8,792 million in 2025. The product is mostly a traded commodity, and the OECD and FAO report that around 50.0% of world production of whole and skimmed milk powder is traded [1]. Prices recovered in 2025 and 2026. Whole milk powder averaged USD 3,971 per tonne at a Global Dairy Trade auction in early November 2026, up 5.9% on the previous event [2]. Revenue therefore follows the milk supply of New Zealand, the European Union and the United States, and the import budgets of China, Africa and the Middle East.
USDA forecasts New Zealand's 2026 exports of whole milk powder at 1.50 million tonnes [10]. That is 80.0% of the 1.88 million tonnes shipped by the four major exporters [10]. European Union and Australian shipments are each forecast to fall 10%, so buyers have few alternatives [10]. Among tracked importers, China is forecast to buy 415 thousand tonnes and Algeria 270 thousand [10].
Key Market Trends & Insights
- New Zealand is shifting more of its milk from whole milk powder into protein products. A New Zealand cooperative announced an extra NZD 1.0 billion for South Island protein plants on 24 September 2026 [3]. The three-year programme will move more milk from whole milk powder and commodities into high-value products [3]. New Zealand supplied 53.0% of global full cream powder exports in 2025 [4]. A shift of capacity there can tighten commodity supply.
- China's role as the main buyer is easing, because the OECD and FAO project that whole milk powder imports into China will fall to 15.0% of global imports in 2035, 2.7 percentage points below the base period, as Chinese milk output grows [1]. Imports of milk powder into China have already halved over four years since the 2021 peak [4].
- Africa and the Middle East are taking more powder, as the OECD and FAO expect Africa to increase whole milk powder imports considerably over ten years, and Saudi Arabia increased dairy imports in 2025 while Algeria, Iraq and Mexico cut theirs [1].
Regional Highlights
- In Oceania, supply is large but growth is slow. The OECD and FAO project New Zealand milk output to grow 1.0% a year over the next decade [1]. Fonterra forecasts 2026/27 milk collections of just over 1.6 billion kgMS [3]. On 30 October 2026 it raised its farmgate milk price midpoint to NZD 9.75 per kgMS [17].
- In the Middle East and North Africa, imports consist mainly of milk powders and functional dairy ingredients. The Middle East dairy market was estimated at USD 19.5 billion in 2025 [5].
Whole Milk Powder Market Size and Forecast
Table 1: Whole Milk Powder Market Size and Forecast
| Market size and forecast | Value |
|---|---|
| Market size in 2025 | USD 8,792.0 million |
| Estimated market size in 2026 | USD 9,082.0 million |
| Projected market size by 2036 | USD 12,565.0 million |
| CAGR from 2026 to 2036 | 3.3% |
Source: Future Market Insights analysis of the whole milk powder market, 2026.
Analyst Perspective
“Whole milk powder is bought on price, fat specification and delivery date, and most contracts follow the Global Dairy Trade price. Buyers in confectionery, infant formula and reconstitution plants keep several approved origins to protect supply. For sellers, the product is a storage form of milk, so revenue rises when milk supply and demand are both firm and falls when new supply arrives, while exporters that move milk into higher-value proteins reduce powder supply and import-dependent regions will absorb more powder as they grow faster than their own milk output.”
- Nandini Roy Choudhury, Principal Analyst at Future Market Insights
How is the Whole Milk Powder Market segmented?
- By end use: Confectionery, Dairy Products, Bakery, Infant Formula, Reconstituted Milk and Retail Packs.
- By distribution channel: B2B and Direct Sales, B2C Retail.
- By source: Cow Milk, Buffalo Milk, Goat, Sheep and Other Milk.
- By region: North America, Latin America, Europe, East Asia, South Asia, Oceania, Middle East and Africa.
Why does Confectionery lead by End Use in the Whole Milk Powder Market in 2026?
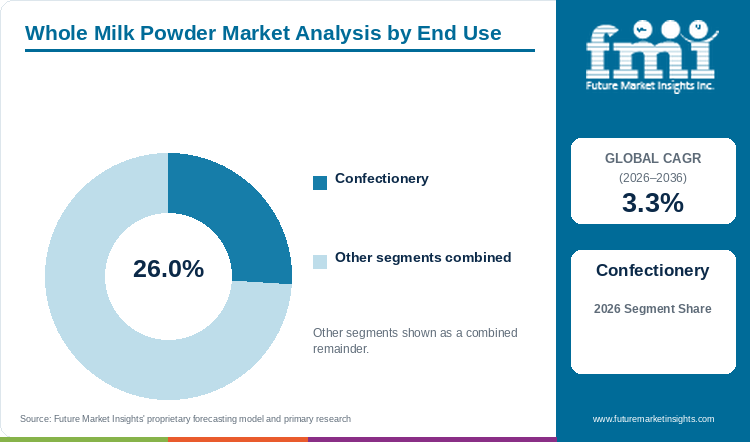
Confectionery is estimated to account for 26.0% of the Whole Milk Powder Market by end use in 2026.
The OECD and FAO name manufacturing as the main use of skimmed and whole milk powder [1]. This covers confectionery, infant formula and bakery products [1]. Chocolate makers value whole milk powder for steady milk solids and flavor, and the price premium of fat-rich powder over skim milk powder is supported by strong demand for milk fat [1]. Dairy products, bakery, infant formula and reconstituted retail milk hold the remaining 74.0%. In regions with limited milk production, milk powders are the main route for supply [1].
Table 2: End Use, 2026 Share
| Leading Share | 2026 market share |
|---|---|
| Confectionery | 26.0% |
| All Other Segments Combined Share | 74.0% |
Source: Future Market Insights analysis of the whole milk powder market, 2026.
Why does B2B and Direct Sales lead by Distribution Channel in the Whole Milk Powder Market in 2026?
B2B and direct sales are estimated to account for 82.0% of the Whole Milk Powder Market by distribution channel in 2026.
Most whole milk powder is sold in bulk by exporters to food makers, traders and reconstitution plants [1]. Prices follow the Global Dairy Trade benchmark [2]. The Global Dairy Trade event of 4 November 2026 drew 166 participating bidders, of which 111 won product [2]. B2C retail holds the remaining 18.0%. Branded consumer packs such as Nestle's Nido and Bear Brand fortified milk powders reach households [20].
Table 3: Distribution Channel, 2026 Share
| Leading Share | 2026 market share |
|---|---|
| B2B and Direct Sales | 82.0% |
| All Other Segments Combined Share | 18.0% |
Source: Future Market Insights analysis of the whole milk powder market, 2026.
Why does Cow Milk lead by Source in the Whole Milk Powder Market in 2026?
Cow milk is estimated to account for 96.0% of the Whole Milk Powder Market by source in 2026.
Cow milk makes up 81.0% of world milk production, buffalo milk 16.0% and goat, sheep and camel milk combined 3.0% [1], and powder for export comes from large grass-based and feed-based cow herds in New Zealand, the European Union, the United States and Argentina, which together are projected to supply 64.0% of world whole milk powder exports in 2035 [1]. Buffalo and other milks hold the remaining 4.0%. Buffalo milk is mostly consumed in India and Pakistan, which the OECD and FAO describe as self-sufficient with little trade [1], and goat and sheep powders are niche products in infant and specialty nutrition.
Table 4: Source, 2026 Share
| Leading Share | 2026 market share |
|---|---|
| Cow Milk | 96.0% |
| All Other Segments Combined Share | 4.0% |
Source: Future Market Insights analysis of the whole milk powder market, 2026.
What are the key drivers, restraints and opportunities?
Driver
Import demand in milk-short regions. The OECD and FAO project that dairy consumption in Africa, Southeast Asia and the Near East and North Africa will grow faster than production, so imports will rise and be met largely by milk powders [1].
Firm prices in 2026. Whole milk powder prices have kept rising at Global Dairy Trade auctions [2]. Fonterra lifted its 2026/27 milk price midpoint on 30 October 2026 [17]. It cited whole milk powder demand from Southeast Asia, the Middle East, Africa and China [17].
Restraint
Lower Chinese import growth. The OECD and FAO expect growth in Chinese milk output to limit growth in whole milk powder imports [1], so exporters that depend on China face slower volume.
Supply and policy shocks. Dairy prices fell in the second half of 2025 when milk output in the main exporters exceeded expectations [1]. China has applied countervailing duties of 7.4% to 11.7% to EU cheese and high-fat milk and cream since 13 February 2026 [24]. Milk powders sit outside that case [25]. The Middle East conflict of 2026 has disrupted trade routes to a large dairy-importing region [5].
Opportunity
Africa's growing import market. Dairy imports into Nigeria are mostly powdered milk and cream that are reconstituted locally [7], a reconstituted milk route in which exporters that build local blending and packaging can capture more value per tonne.
Fortified and branded powders. Nestle lists Nido and Bear Brand among its fortified milk powders [20]. FMI expects fortified and branded powders to give exporters a route out of commodity pricing.
Whole Milk Powder Market by Country (2026 to 2036)
Table 5: Whole Milk Powder Market Country Growth Forecast
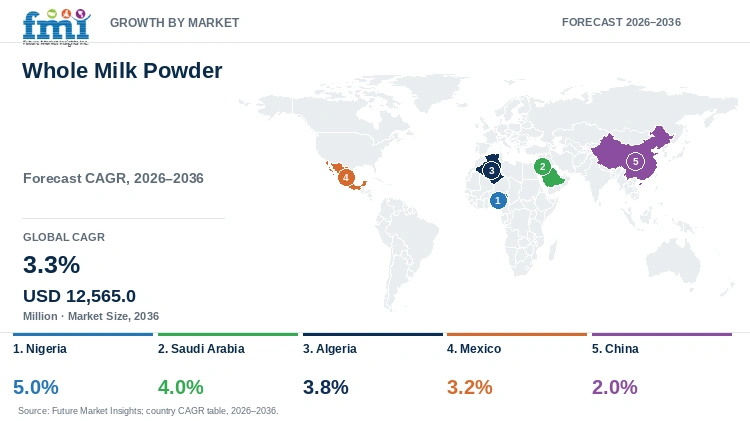
| Country | CAGR, 2026 to 2036 |
|---|---|
| Nigeria | 5.0% |
| Saudi Arabia | 4.0% |
| Algeria | 3.8% |
| Mexico | 3.2% |
| China | 2.0% |
Source: Future Market Insights analysis of the whole milk powder market, 2026.
Nigeria
Nigeria imported USD 267 million of dairy in 2024 [7]. Population growth and low domestic milk output keep import demand high. FMI projects the fastest rate among the profiled countries, at 5.0% from 2026 to 2036.
Nigerian cattle supply about 570 million liters a year against a requirement of 1.6 billion, or 35.6% of demand [7]. Pastoralists hold at least 95% of dairy cows, and yields run at 0.5 to 1 liter per cow daily [7]. Weak cold chains and intermittent household power are the two main reasons households use powder over fresh milk [7]. The OECD and FAO expect African whole milk powder imports to rise considerably over the next ten years [1].
Price shapes the product mix as much as volume. Importers prefer fat-filled powder because its retail price is below skim and whole milk powder [7]. Whole milk powder therefore grows inside a price-sensitive segment, which limits the premium it can earn. The European Union holds 45% and New Zealand 42% of concentrated milk and cream exports to Nigeria in 2024 [7]. The 2023 to 2028 Dairy Development Policy asks powder importers to add 5% local content yearly [7]. Enforcement is rare, so the effect on trade is smaller than intended [7]. Landed cost against fat-filled powder therefore decides what importers buy [7]. Private traders carry the import risk, and no state office buys on their behalf [7][14].
Saudi Arabia
Saudi Arabia increased its dairy imports in 2025 [1]. Imports into the Middle East consist mainly of milk powders and functional dairy ingredients [5]. A 4.0% CAGR is projected for the Saudi market over 2026 to 2036.
Foodservice growth and import reliance explain Saudi demand. The Kingdom imports about 70% of its food needs, and its population is 33.1 million [15]. Hotel, restaurant and institutional revenue reached USD 29 billion in 2024, with 10% yearly growth projected [16]. That sector sources about 70% of its ingredients abroad [15]. Labor camps, tourists and religious visitors drive that growth, and about 13 million expatriates live in the country [15]. Dairy imports were USD 1.5 billion in 2024, with New Zealand named the main exporter of milk powder [16].
Logistics add a cost risk to Saudi imports in 2026. The Middle East war has removed the Red Sea, Suez and at times Hormuz from normal dairy trade [5]. Jeddah and other ports are sidelined, so dairy flows shift to longer Cape routes [5]. The European Union and New Zealand supply 33% and 17% of Middle East dairy imports, or half combined [5]. Hotel and catering buyers therefore depend on Cape routing for the two origins that supply half of regional dairy imports [5][15]. Demand has held through the disruption. A New Zealand dairy cooperative cited sustained Middle East demand for whole milk powder on 30 October 2026 [17].
Algeria
USDA forecasts Algerian whole milk powder imports at 270 thousand tonnes in 2026 [10]. Only China imports more among the countries USDA tracks [10]. Total milk powder imports fell in 2025, according to the OECD and FAO [1]. Algeria is projected to post a 3.8% CAGR for 2026 to 2036, as state-managed purchasing keeps volumes broadly steady.
State policy sets the volume of Algerian powder demand. USDA forecasts whole milk powder use of 268 thousand tonnes in 2026 against imports of 270 thousand tonnes [10]. Imports therefore cover all use [10]. The state office ONIL imported 46% of national milk powder needs in 2021, while private dairies imported the rest [14]. Dairies obtain subsidized powder only if they collect raw milk [14]. Dairies collected 879 million liters of milk in 2021, which is 26.7% of the 3.29 billion liters produced [14].
USDA data show whole milk powder use of 260 thousand tonnes in 2022 [10]. The forecast for 2026 is 268 thousand tonnes [10]. Volume is nearly flat, so the 3.8% CAGR depends mostly on price and mix. The state subsidizes imported powder, and Algerian researchers call powder imports a considerable cost to the budget [14]. Baladna of Qatar and the Algerian National Investment Fund are building a USD 3.5 billion dairy complex in Adrar [22]. It is scheduled to start milk powder production in late 2027 and to meet about 50% of Algerian needs [22]. Its powder plant was 28% built in October 2026 [23]. Until it ramps up, imports keep covering domestic use, so the budget stays exposed to world powder prices [10][14].
Mexico
Mexico reduced dairy imports in 2025 [1]. Domestic plants already supply most of the whole milk powder it uses [11]. Compound annual growth of 3.2% is projected for Mexico between 2026 and 2036.
Whole milk powder is a niche beside skim powder in Mexico. USDA forecasts 2026 imports of 390 thousand tonnes of skim powder but only 10 thousand of whole milk powder [11]. Processors prefer the skim product because it is cheaper and lets them add their own fat [11]. Domestic plants make 125 thousand tonnes against 133 thousand tonnes used, a coverage of 94.0% [11]. Confectionery, bakery and infant formula makers form the core of that demand [11]. Hotels, restaurants and cafes add to it, and 63.7 million international visitors arrived from January to August 2025 [11].
Growth stays moderate because domestic supply is flat and imports cover only the shortfall [11]. Production has stayed at 125 thousand tonnes since 2024 because processors direct additional milk to cheese and yogurt [11]. The government plans MXN 13.5 billion for drying and pasteurization plants, but the focus is skim powder [11]. Use rises from 126 thousand tonnes in 2024 to 133 thousand tonnes in 2026 [11]. USDA forecasts whole milk powder imports of 10 thousand tonnes in 2026, up 43% from 7 thousand [11]. It ties that rise to hotel, restaurant and bakery demand, which flat local output cannot meet [11].
China
China remains the principal importer of New Zealand whole milk powder [1]. Imports are projected to keep falling as domestic milk output grows [1]. New Zealand supplies 45.0% of China's dairy imports and the European Union 28.0%, on 2023 to 2025 averages [6]. FMI projects the slowest rate among the profiled countries, at 2.0% from 2026 to 2036.
Chinese whole milk powder imports fall from 699 thousand tonnes in 2022 to a forecast 415 thousand in 2026 [10]. Domestic use falls from 1.75 million to 1.50 million tonnes over the same period [10]. Imports fall from 40.0% of use in 2022 to 27.7% in 2026 [10]. A standard effective 16 September 2025 requires UHT pure milk to come from raw milk and bans reconstitution [12].
Remaining imports are hard to replace. Most beverage, ice cream and bakery programs already use domestic powder, so substitution is largely complete [12]. Infant formula and brand-locked inputs still require qualified foreign powder, which anchors the import base [12]. Processors direct milk to butter, cream and cheese because powder underperforms on cost against price [12]. USDA forecasts production of 1.14 million tonnes in 2026, 3.0% below 2024 [10]. Provinces such as Inner Mongolia and Shanxi still subsidize powder to absorb seasonal surplus milk [13]. AHDB notes that China remains heavily reliant on imports for infant formula, whole milk powder and whey proteins [6]. Suppliers qualified for brand-locked programs therefore keep access while total volume falls [12].
Who are the notable companies in the Whole Milk Powder Market?
Notable companies in the Whole Milk Powder Market include Fonterra, Lactalis, Arla, Nestle and FrieslandCampina.
Access to surplus milk, and the freedom to divert it to other products, separates whole milk powder suppliers. Fonterra reported FY26 Ingredients operating profit of NZD 1,293 million [3]. On 24 September 2026 it announced a further NZD 1.0 billion for South Island protein plants [3]. The plants are due to operate in 2029 and will take more New Zealand milk out of whole milk powder [3]. Many buyers list New Zealand as a primary origin and add secondary origins [4].
Lactalis and Arla sell powder as one part of larger dairy businesses. Lactalis completed the purchase of Fonterra's Mainland Group on 31 March 2026 [18]. It buys New Zealand raw milk under a supply agreement of at least 10 years [18]. Arla and DMK merged with effect from 1 June 2026, creating a milk pool of about 20 billion kg [19]. Arla sold 35.4% of its milk solids through Global Industry Sales in the first half of 2026 [19]. A year earlier the share was 28.5% [19].
Nestle and Royal FrieslandCampina sell branded powder in import markets. Nestle lists Nido and Bear Brand among its fortified milk powders [20]. FrieslandCampina WAMCO has sold Peak milk in Nigeria since 1954, and its range includes Peak Instant Milk Powder [21]. FrieslandCampina signed 411 million kg of new milk in 2025 from 182 dairy farms [8].
Key Developments in the Whole Milk Powder Market
- Arla and DMK completed their merger on 1 June 2026 [19]. The cooperative has a milk pool of about 20 billion kg [19].
- On 24 September 2026 Fonterra announced a NZD 1.0 billion South Island protein investment [3]. More New Zealand milk is planned to shift from whole milk powder into higher-value proteins from 2029.
- In October 2026 construction of the milk powder plant in the Baladna project in Adrar, Algeria, reached 28% [23]. The plant is scheduled to start production in late 2027 and to meet about 50% of Algerian needs [22].
Key Players in the Whole Milk Powder Market
- Fonterra Co-operative Group Limited
- Groupe Lactalis
- Arla Foods amba
- Nestle S.A. (NIDO)
- Royal FrieslandCampina N.V.
Whole Milk Powder Market Report Scope
Table 6: Whole Milk Powder Market Report Scope
| Coverage field | Report scope |
|---|---|
| Market definition | Spray-dried whole milk powder, including instant and regular grades, sold to food manufacturers, traders and consumers, valued at manufacturer selling prices. Skim milk powder, infant formula and fat-filled powders are excluded. |
| End Use | Confectionery; Dairy Products; Bakery; Infant Formula; Reconstituted Milk and Retail Packs |
| Distribution Channel | B2B and Direct Sales; B2C Retail |
| Source | Cow Milk; Buffalo Milk; Goat, Sheep and Other Milk |
| Regions and profiled countries | North America, Latin America, Europe, East Asia, South Asia, Oceania, Middle East and Africa |
| Companies covered | Fonterra Co-operative Group Limited; Groupe Lactalis; Arla Foods amba; Nestle S.A. (NIDO); Royal FrieslandCampina N.V. |
| Quantitative Units | USD million |
Whole Milk Powder Market by Segments
Whole Milk Powder Market segmented by End Use:
- Confectionery
- Dairy Products
- Bakery
- Infant Formula
- Reconstituted Milk and Retail Packs
Whole Milk Powder Market segmented by Distribution Channel:
- B2B and Direct Sales
- B2C Retail
Whole Milk Powder Market segmented by Source:
- Cow Milk
- Buffalo Milk
- Goat, Sheep and Other Milk
Whole Milk Powder Market by Region
- North America
- Latin America
- Europe
- East Asia
- South Asia
- Oceania
- Middle East
- Africa
- Nigeria
- Saudi Arabia
- Algeria
- Mexico
- China
Research Sources and Bibliography
- [1] OECD and FAO. (2026, June 29). Dairy and dairy products, in OECD-FAO Agricultural Outlook 2026-2035. https://www.oecd.org/en/publications/2026/06/oecd-fao-agricultural-outlook-2026-2035_5610f218/full-report/dairy-and-dairy-products_5e1ae8f8.html
- [2] Cheese Reporter. (2026, November 4). Global Dairy Trade price index posts third straight increase. https://cheesereporter.com/news/global-trade-tariffs/2026/11/04/global-dairy-trade-price-index-posts-third-straight-increase-2/
- [3] Fonterra Co-operative Group. (2026, September 24). Fonterra delivers strong FY26 performance. https://www.fonterra.com/americas/en/our-stories/media/fonterra-delivers-strong-fy26-performance.html
- [4] Dairy News Today. (2026, July 21). Shifts in global dairy trade dynamics by 2026. https://dairynews.today/news/shifts_in_global_dairy_trade_dynamics_by_2026_6513904.html
- [5] Agriculture and Horticulture Development Board. (2026, May 6). Impact of Middle East war on dairy sector. https://ahdb.org.uk/news/impact-of-middle-east-war-on-dairy-sector
- [6] Agriculture and Horticulture Development Board. (2026, January 15). Impact of China's import tariffs on EU dairy. https://ahdb.org.uk/news/impact-of-china-s-import-tariffs-on-eu-dairy
- [7] USDA Foreign Agricultural Service. (2025, June 3). Overview of the dairy market and US export opportunities: Nigeria. https://apps.fas.usda.gov/newgainapi/api/Report/DownloadReportByFileName?fileName=Overview+of+the+Dairy+Market+and+US+Export+Opportunities_Lagos_Nigeria_NI2025-0012.pdf
- [8] Royal FrieslandCampina N.V. (2026, March 11). Global Investor Update: Year-end 2025. https://www.frieslandcampina.com/uploads/2026/03/260311_Global_Investor-Update_YE2025_web.pdf
- [9] Rabobank. (2026, August 27). 2026 Global Dairy Top 20 report: Lactalis reigns supreme while Fonterra drops to tenth. https://www.rabobank.co.nz/media-releases/2026/27082026-2026-rabobank-global-dairy-top-20-report-lactilis-reigns-supreme-while-fonterra-drops-to-tenth
- [10] USDA Foreign Agricultural Service. (2026, July). Dairy: World Markets and Trade. https://apps.fas.usda.gov/psdonline/circulars/dairy.pdf
- [11] USDA Foreign Agricultural Service. (2025, December 10). Dairy and Products Annual: Mexico (Report MX2025-0058). https://apps.fas.usda.gov/newgainapi/api/Report/DownloadReportByFileName?fileName=Dairy%20and%20Products%20Annual_Mexico%20City_Mexico_MX2025-0058.pdf
- [12] USDA Foreign Agricultural Service. (2025, November 21). Dairy and Products Annual: China (Report CH2025-0218). https://apps.fas.usda.gov/newgainapi/api/Report/DownloadReportByFileName?fileName=Dairy%20and%20Products%20Annual_Beijing_China%20-%20People%27s%20Republic%20of_CH2025-0218
- [13] OECD. (2026, November 2). China, in Agricultural Policy Monitoring and Evaluation 2026. https://www.oecd.org/en/publications/agricultural-policy-monitoring-and-evaluation-2026_2c7f3be1-en/full-report/china_1931dabe.html
- [14] Kacimi El Hassani S and Belmahdi T. (2025). Dairy policies in Algeria in search of sustainability and autonomy: reforms, challenges and results. Revue Le Manager, volume 12, issue 1. https://asjp.cerist.dz/en/downArticle/451/12/1/273111
- [15] USDA Foreign Agricultural Service. (2025, June 11). Exporter Guide Annual: Saudi Arabia (Report SA2025-0010). https://apps.fas.usda.gov/newgainapi/api/Report/DownloadReportByFileName?fileName=Exporter+Guide+Annual_Riyadh_Saudi+Arabia_SA2025-0010.pdf
- [16] USDA Foreign Agricultural Service. (2025, September 24). Retail Foods Annual: Saudi Arabia (Report SA2025-0015). https://apps.fas.usda.gov/newgainapi/api/Report/DownloadReportByFileName?fileName=Retail+Foods+Annual_Riyadh_Saudi+Arabia_SA2025-0015
- [17] Fonterra Co-operative Group. (2026, October 30). Fonterra lifts forecast 2026/27 Farmgate Milk Price. https://www.fonterra.com/nz/en/our-stories/media/fonterra-lifts-forecast-2026-27-farmgate-milk-price.html
- [18] Fonterra Co-operative Group. (2026, March 31). Fonterra completes sale of Mainland Group to Lactalis. https://www.fonterra.com/americas/en/our-stories/media/fonterra-completes-sale-of-mainland-group-to-lactalis.html
- [19] Arla Foods. (2026, August 27). Surging brands and strong protein demand drive Arla Foods to a standout first half. https://www.arla.com/company/news-and-press/2026/pressrelease/surging-brands-and-strong-protein-demand-drive-arla-foods-to-a-standout-first-half/
- [20] Nestle. (2026, February). Annual Review 2025. https://www.nestle.com/sites/default/files/2026-02/annual-review-2025-en.pdf
- [21] FrieslandCampina WAMCO Nigeria PLC. Peak Milk brand profile. https://www.peakmilk.com.ng/
- [22] FPT Industrial. (2026, June 23). FPT and Green Power Systems help boost Algeria's powdered milk production. https://www.fptindustrial.com/en/media/press-releases/2026/06/23/08/45/PG-North-Africa
- [23] Dairy Business Middle East and Africa. (2026, October 24). Baladna powdered milk plant in Algeria hits 28% construction completion. https://dairybusinessmea.com/2026/10/24/baladna-powdered-milk-plant-in-algeria-hits-28-construction-completion/
- [24] Xinhua. (2026, February 12). China to impose countervailing measures on certain EU dairy imports. https://en.chinadiplomacy.org.cn/2026-02/13/content_118331945.shtml
- [25] DairyReporter. (2026, January 5). EU dairy hit by Chinese tariffs: All you need to know. https://www.dairyreporter.com/Article/2026/01/05/chinas-new-eu-dairy-tariffs-all-you-need-to-know/
Table of Content
Table of Content
- Key Takeaways
- Market Size and CAGR
- Top Growth Driver
- Fastest Growing Segment
- Leading Region
- Key Companies
- Emerging Opportunities
- Executive Summary
- Global Market Outlook
- Demand-side Trends
- Supply-side Trends
- Technology Roadmap Analysis
- Analysis and Recommendations
- Analyst Perspective (What is happening? Why now? What should investors know?)
- Key Questions Answered
- How large is the market?
- What is the CAGR?
- What are key trends?
- Which region dominates?
- Who are the leaders?
Read More...
- Market Overview
- Market Coverage / Taxonomy
- Market Definition / Scope / Limitations
- Research Methodology
- Chapter Orientation
- Analytical Lens and Working Hypotheses
- Market Structure, Signals, and Trend Drivers
- Benchmarking and Cross-market Comparability
- Market Sizing, Forecasting, and Opportunity Mapping
- Research Design and Evidence Framework
- Desk Research Programme (Secondary Evidence)
- Expert Input and Fieldwork (Primary Evidence)
- Tooling, Models, and Reference Databases
- Data Engineering and Model Build
- Quality Assurance and Audit Trail
- Market Background
- Market Dynamics (Drivers, Restraints, Opportunity, Trends)
- Scenario Forecast (Optimistic, Likely, Conservative)
- Impact Analysis
- AI Impact
- Sustainability Impact
- Regulatory Impact
- Technology Impact
- Consumer / Buyer Analysis
- Purchase Drivers
- Adoption Barriers
- Buyer Journey
- Opportunity Map Analysis
- Product Life Cycle Analysis
- Supply Chain Analysis
- Investment Feasibility Matrix
- Value Chain Analysis
- PESTLE and Porter's Analysis
- Regulatory Landscape
- Regional Parent Market Outlook
- Production and Consumption Statistics
- Import and Export Statistics
- Global Market Analysis and Forecast, 2021 to 2036
- Historical Market Size Value (USD Million) Analysis, 2021 to 2025
- Current and Future Market Size Value (USD Million) Projections, 2026 to 2036
- Y-o-Y Growth Trend Analysis
- Absolute $ Opportunity Analysis
- Global Market Pricing Analysis, 2021 to 2036
- Global Market Analysis and Forecast, By End Use, 2021 to 2036
- Introduction / Key Findings
- Historical Market Size Value (USD Million) Analysis By End Use, 2021 to 2025
- Current and Future Market Size Value (USD Million) Analysis and Forecast By End Use, 2026 to 2036
- Confectionery
- Dairy Products
- Bakery
- Infant Formula
- Reconstituted Milk and Retail Packs
- Y-o-Y Growth Trend Analysis By End Use, 2021 to 2025
- Absolute $ Opportunity Analysis By End Use, 2026 to 2036
- Global Market Analysis and Forecast, By Distribution Channel, 2021 to 2036
- Introduction / Key Findings
- Historical Market Size Value (USD Million) Analysis By Distribution Channel, 2021 to 2025
- Current and Future Market Size Value (USD Million) Analysis and Forecast By Distribution Channel, 2026 to 2036
- B2B and Direct Sales
- B2C Retail
- Y-o-Y Growth Trend Analysis By Distribution Channel, 2021 to 2025
- Absolute $ Opportunity Analysis By Distribution Channel, 2026 to 2036
- Global Market Analysis and Forecast, By Source, 2021 to 2036
- Introduction / Key Findings
- Historical Market Size Value (USD Million) Analysis By Source, 2021 to 2025
- Current and Future Market Size Value (USD Million) Analysis and Forecast By Source, 2026 to 2036
- Cow Milk
- Buffalo Milk
- Goat, Sheep and Other Milk
- Y-o-Y Growth Trend Analysis By Source, 2021 to 2025
- Absolute $ Opportunity Analysis By Source, 2026 to 2036
- Global Market Analysis and Forecast, By Region, 2021 to 2036
- Introduction
- Historical Market Size Value (USD Million) Analysis By Region, 2021 to 2025
- Current Market Size Value (USD Million) Analysis and Forecast By Region, 2026 to 2036
- North America
- Latin America
- Europe
- East Asia
- South Asia
- Oceania
- Middle East
- Africa
- Market Attractiveness Analysis By Region
- North America Market Analysis and Forecast, By Country, 2021 to 2036
- Historical Market Size Value (USD Million) Trend Analysis By Market Taxonomy, 2021 to 2025
- Market Size Value (USD Million) Forecast By Market Taxonomy, 2026 to 2036
- By Country
- By End Use
- By Distribution Channel
- By Source
- Market Attractiveness Analysis
- By Country
- By End Use
- By Distribution Channel
- By Source
- Key Takeaways
- Latin America Market Analysis and Forecast, By Country
- Historical Market Size Value (USD Million) Trend Analysis By Market Taxonomy, 2021 to 2025
- Market Size Value (USD Million) Forecast By Market Taxonomy, 2026 to 2036
- By Country
- By End Use
- By Distribution Channel
- By Source
- Market Attractiveness Analysis
- By Country
- By End Use
- By Distribution Channel
- By Source
- Key Takeaways
- Europe Market Analysis and Forecast, By Country
- Historical Market Size Value (USD Million) Trend Analysis By Market Taxonomy, 2021 to 2025
- Market Size Value (USD Million) Forecast By Market Taxonomy, 2026 to 2036
- By Country
- By End Use
- By Distribution Channel
- By Source
- Market Attractiveness Analysis
- By Country
- By End Use
- By Distribution Channel
- By Source
- Key Takeaways
- East Asia Market Analysis and Forecast, By Country
- Historical Market Size Value (USD Million) Trend Analysis By Market Taxonomy, 2021 to 2025
- Market Size Value (USD Million) Forecast By Market Taxonomy, 2026 to 2036
- By Country
- By End Use
- By Distribution Channel
- By Source
- Market Attractiveness Analysis
- By Country
- By End Use
- By Distribution Channel
- By Source
- Key Takeaways
- South Asia Market Analysis and Forecast, By Country
- Historical Market Size Value (USD Million) Trend Analysis By Market Taxonomy, 2021 to 2025
- Market Size Value (USD Million) Forecast By Market Taxonomy, 2026 to 2036
- By Country
- By End Use
- By Distribution Channel
- By Source
- Market Attractiveness Analysis
- By Country
- By End Use
- By Distribution Channel
- By Source
- Key Takeaways
- Oceania Market Analysis and Forecast, By Country
- Historical Market Size Value (USD Million) Trend Analysis By Market Taxonomy, 2021 to 2025
- Market Size Value (USD Million) Forecast By Market Taxonomy, 2026 to 2036
- By Country
- By End Use
- By Distribution Channel
- By Source
- Market Attractiveness Analysis
- By Country
- By End Use
- By Distribution Channel
- By Source
- Key Takeaways
- Middle East Market Analysis and Forecast, By Country
- Historical Market Size Value (USD Million) Trend Analysis By Market Taxonomy, 2021 to 2025
- Market Size Value (USD Million) Forecast By Market Taxonomy, 2026 to 2036
- By Country
- By End Use
- By Distribution Channel
- By Source
- Market Attractiveness Analysis
- By Country
- By End Use
- By Distribution Channel
- By Source
- Key Takeaways
- Africa Market Analysis and Forecast, By Country
- Historical Market Size Value (USD Million) Trend Analysis By Market Taxonomy, 2021 to 2025
- Market Size Value (USD Million) Forecast By Market Taxonomy, 2026 to 2036
- By Country
- Nigeria
- Saudi Arabia
- Algeria
- Mexico
- China
- By End Use
- By Distribution Channel
- By Source
- By Country
- Market Attractiveness Analysis
- By Country
- By End Use
- By Distribution Channel
- By Source
- Key Takeaways
- Key Countries Market Analysis
- Mexico
- Pricing Analysis
- Market Share Analysis, 2025
- By End Use
- By Distribution Channel
- By Source
- China
- Pricing Analysis
- Market Share Analysis, 2025
- By End Use
- By Distribution Channel
- By Source
- Nigeria
- Pricing Analysis
- Market Share Analysis, 2025
- By End Use
- By Distribution Channel
- By Source
- Saudi Arabia
- Pricing Analysis
- Market Share Analysis, 2025
- By End Use
- By Distribution Channel
- By Source
- Algeria
- Pricing Analysis
- Market Share Analysis, 2025
- By End Use
- By Distribution Channel
- By Source
- Mexico
- Market Structure Analysis
- Competition Dashboard
- Competition Benchmarking
- Market Share Analysis of Top Players
- By Regional
- By End Use
- By Distribution Channel
- By Source
- Emerging Startups
- Innovation Benchmarking
- Competition Analysis
- Competition Deep Dive
- Fonterra Co-operative Group Limited
- Overview
- Product Portfolio
- Profitability by Market Segments
- Sales Footprint
- Strategy Overview
- Marketing Strategy
- Product Strategy
- Channel Strategy
- Groupe Lactalis
- Arla Foods amba
- Nestle S.A. (NIDO)
- Royal FrieslandCampina N.V.
- Fonterra Co-operative Group Limited
- Case Studies
- Success Stories
- Recent Developments
- Competition Deep Dive
- Assumptions & Acronyms Used
List of Tables
- Table 1: Global Market Value (USD Million) Forecast by Region, 2021 to 2036
- Table 2: Global Market Value (USD Million) Forecast by End Use, 2021 to 2036
- Table 3: Global Market Value (USD Million) Forecast by Distribution Channel, 2021 to 2036
- Table 4: Global Market Value (USD Million) Forecast by Source, 2021 to 2036
- Table 5: North America Market Value (USD Million) Forecast by Country, 2021 to 2036
- Table 6: North America Market Value (USD Million) Forecast by End Use, 2021 to 2036
- Table 7: North America Market Value (USD Million) Forecast by Distribution Channel, 2021 to 2036
- Table 8: North America Market Value (USD Million) Forecast by Source, 2021 to 2036
- Table 9: Latin America Market Value (USD Million) Forecast by Country, 2021 to 2036
- Table 10: Latin America Market Value (USD Million) Forecast by End Use, 2021 to 2036
- Table 11: Latin America Market Value (USD Million) Forecast by Distribution Channel, 2021 to 2036
- Table 12: Latin America Market Value (USD Million) Forecast by Source, 2021 to 2036
- Table 13: Europe Market Value (USD Million) Forecast by Country, 2021 to 2036
- Table 14: Europe Market Value (USD Million) Forecast by End Use, 2021 to 2036
- Table 15: Europe Market Value (USD Million) Forecast by Distribution Channel, 2021 to 2036
- Table 16: Europe Market Value (USD Million) Forecast by Source, 2021 to 2036
- Table 17: East Asia Market Value (USD Million) Forecast by Country, 2021 to 2036
- Table 18: East Asia Market Value (USD Million) Forecast by End Use, 2021 to 2036
- Table 19: East Asia Market Value (USD Million) Forecast by Distribution Channel, 2021 to 2036
- Table 20: East Asia Market Value (USD Million) Forecast by Source, 2021 to 2036
- Table 21: South Asia Market Value (USD Million) Forecast by Country, 2021 to 2036
- Table 22: South Asia Market Value (USD Million) Forecast by End Use, 2021 to 2036
- Table 23: South Asia Market Value (USD Million) Forecast by Distribution Channel, 2021 to 2036
- Table 24: South Asia Market Value (USD Million) Forecast by Source, 2021 to 2036
- Table 25: Oceania Market Value (USD Million) Forecast by Country, 2021 to 2036
- Table 26: Oceania Market Value (USD Million) Forecast by End Use, 2021 to 2036
- Table 27: Oceania Market Value (USD Million) Forecast by Distribution Channel, 2021 to 2036
- Table 28: Oceania Market Value (USD Million) Forecast by Source, 2021 to 2036
- Table 29: Middle East Market Value (USD Million) Forecast by Country, 2021 to 2036
- Table 30: Middle East Market Value (USD Million) Forecast by End Use, 2021 to 2036
- Table 31: Middle East Market Value (USD Million) Forecast by Distribution Channel, 2021 to 2036
- Table 32: Middle East Market Value (USD Million) Forecast by Source, 2021 to 2036
- Table 33: Africa Market Value (USD Million) Forecast by Country, 2021 to 2036
- Table 34: Africa Market Value (USD Million) Forecast by End Use, 2021 to 2036
- Table 35: Africa Market Value (USD Million) Forecast by Distribution Channel, 2021 to 2036
- Table 36: Africa Market Value (USD Million) Forecast by Source, 2021 to 2036
List of Figures
- Figure 1: Global Market Pricing Analysis
- Figure 2: Global Market Value (USD Million) Forecast 2021-2036
- Figure 3: Global Market Value Share and BPS Analysis by End Use, 2026 and 2036
- Figure 4: Global Market Y-o-Y Growth Comparison by End Use, 2026-2036
- Figure 5: Global Market Attractiveness Analysis by End Use
- Figure 6: Global Market Value Share and BPS Analysis by Distribution Channel, 2026 and 2036
- Figure 7: Global Market Y-o-Y Growth Comparison by Distribution Channel, 2026-2036
- Figure 8: Global Market Attractiveness Analysis by Distribution Channel
- Figure 9: Global Market Value Share and BPS Analysis by Source, 2026 and 2036
- Figure 10: Global Market Y-o-Y Growth Comparison by Source, 2026-2036
- Figure 11: Global Market Attractiveness Analysis by Source
- Figure 12: Global Market Value (USD Million) Share and BPS Analysis by Region, 2026 and 2036
- Figure 13: Global Market Y-o-Y Growth Comparison by Region, 2026-2036
- Figure 14: Global Market Attractiveness Analysis by Region
- Figure 15: North America Market Incremental Dollar Opportunity, 2026-2036
- Figure 16: Latin America Market Incremental Dollar Opportunity, 2026-2036
- Figure 17: Europe Market Incremental Dollar Opportunity, 2026-2036
- Figure 18: East Asia Market Incremental Dollar Opportunity, 2026-2036
- Figure 19: South Asia Market Incremental Dollar Opportunity, 2026-2036
- Figure 20: Oceania Market Incremental Dollar Opportunity, 2026-2036
- Figure 21: Middle East Market Incremental Dollar Opportunity, 2026-2036
- Figure 22: Africa Market Incremental Dollar Opportunity, 2026-2036
- Figure 23: North America Market Value Share and BPS Analysis by Country, 2026 and 2036
- Figure 24: North America Market Value Share and BPS Analysis by End Use, 2026 and 2036
- Figure 25: North America Market Y-o-Y Growth Comparison by End Use, 2026-2036
- Figure 26: North America Market Attractiveness Analysis by End Use
- Figure 27: North America Market Value Share and BPS Analysis by Distribution Channel, 2026 and 2036
- Figure 28: North America Market Y-o-Y Growth Comparison by Distribution Channel, 2026-2036
- Figure 29: North America Market Attractiveness Analysis by Distribution Channel
- Figure 30: North America Market Value Share and BPS Analysis by Source, 2026 and 2036
- Figure 31: North America Market Y-o-Y Growth Comparison by Source, 2026-2036
- Figure 32: North America Market Attractiveness Analysis by Source
- Figure 33: Latin America Market Value Share and BPS Analysis by Country, 2026 and 2036
- Figure 34: Latin America Market Value Share and BPS Analysis by End Use, 2026 and 2036
- Figure 35: Latin America Market Y-o-Y Growth Comparison by End Use, 2026-2036
- Figure 36: Latin America Market Attractiveness Analysis by End Use
- Figure 37: Latin America Market Value Share and BPS Analysis by Distribution Channel, 2026 and 2036
- Figure 38: Latin America Market Y-o-Y Growth Comparison by Distribution Channel, 2026-2036
- Figure 39: Latin America Market Attractiveness Analysis by Distribution Channel
- Figure 40: Latin America Market Value Share and BPS Analysis by Source, 2026 and 2036
- Figure 41: Latin America Market Y-o-Y Growth Comparison by Source, 2026-2036
- Figure 42: Latin America Market Attractiveness Analysis by Source
- Figure 43: Europe Market Value Share and BPS Analysis by Country, 2026 and 2036
- Figure 44: Europe Market Value Share and BPS Analysis by End Use, 2026 and 2036
- Figure 45: Europe Market Y-o-Y Growth Comparison by End Use, 2026-2036
- Figure 46: Europe Market Attractiveness Analysis by End Use
- Figure 47: Europe Market Value Share and BPS Analysis by Distribution Channel, 2026 and 2036
- Figure 48: Europe Market Y-o-Y Growth Comparison by Distribution Channel, 2026-2036
- Figure 49: Europe Market Attractiveness Analysis by Distribution Channel
- Figure 50: Europe Market Value Share and BPS Analysis by Source, 2026 and 2036
- Figure 51: Europe Market Y-o-Y Growth Comparison by Source, 2026-2036
- Figure 52: Europe Market Attractiveness Analysis by Source
- Figure 53: East Asia Market Value Share and BPS Analysis by Country, 2026 and 2036
- Figure 54: East Asia Market Value Share and BPS Analysis by End Use, 2026 and 2036
- Figure 55: East Asia Market Y-o-Y Growth Comparison by End Use, 2026-2036
- Figure 56: East Asia Market Attractiveness Analysis by End Use
- Figure 57: East Asia Market Value Share and BPS Analysis by Distribution Channel, 2026 and 2036
- Figure 58: East Asia Market Y-o-Y Growth Comparison by Distribution Channel, 2026-2036
- Figure 59: East Asia Market Attractiveness Analysis by Distribution Channel
- Figure 60: East Asia Market Value Share and BPS Analysis by Source, 2026 and 2036
- Figure 61: East Asia Market Y-o-Y Growth Comparison by Source, 2026-2036
- Figure 62: East Asia Market Attractiveness Analysis by Source
- Figure 63: South Asia Market Value Share and BPS Analysis by Country, 2026 and 2036
- Figure 64: South Asia Market Value Share and BPS Analysis by End Use, 2026 and 2036
- Figure 65: South Asia Market Y-o-Y Growth Comparison by End Use, 2026-2036
- Figure 66: South Asia Market Attractiveness Analysis by End Use
- Figure 67: South Asia Market Value Share and BPS Analysis by Distribution Channel, 2026 and 2036
- Figure 68: South Asia Market Y-o-Y Growth Comparison by Distribution Channel, 2026-2036
- Figure 69: South Asia Market Attractiveness Analysis by Distribution Channel
- Figure 70: South Asia Market Value Share and BPS Analysis by Source, 2026 and 2036
- Figure 71: South Asia Market Y-o-Y Growth Comparison by Source, 2026-2036
- Figure 72: South Asia Market Attractiveness Analysis by Source
- Figure 73: Oceania Market Value Share and BPS Analysis by Country, 2026 and 2036
- Figure 74: Oceania Market Value Share and BPS Analysis by End Use, 2026 and 2036
- Figure 75: Oceania Market Y-o-Y Growth Comparison by End Use, 2026-2036
- Figure 76: Oceania Market Attractiveness Analysis by End Use
- Figure 77: Oceania Market Value Share and BPS Analysis by Distribution Channel, 2026 and 2036
- Figure 78: Oceania Market Y-o-Y Growth Comparison by Distribution Channel, 2026-2036
- Figure 79: Oceania Market Attractiveness Analysis by Distribution Channel
- Figure 80: Oceania Market Value Share and BPS Analysis by Source, 2026 and 2036
- Figure 81: Oceania Market Y-o-Y Growth Comparison by Source, 2026-2036
- Figure 82: Oceania Market Attractiveness Analysis by Source
- Figure 83: Middle East Market Value Share and BPS Analysis by Country, 2026 and 2036
- Figure 84: Middle East Market Value Share and BPS Analysis by End Use, 2026 and 2036
- Figure 85: Middle East Market Y-o-Y Growth Comparison by End Use, 2026-2036
- Figure 86: Middle East Market Attractiveness Analysis by End Use
- Figure 87: Middle East Market Value Share and BPS Analysis by Distribution Channel, 2026 and 2036
- Figure 88: Middle East Market Y-o-Y Growth Comparison by Distribution Channel, 2026-2036
- Figure 89: Middle East Market Attractiveness Analysis by Distribution Channel
- Figure 90: Middle East Market Value Share and BPS Analysis by Source, 2026 and 2036
- Figure 91: Middle East Market Y-o-Y Growth Comparison by Source, 2026-2036
- Figure 92: Middle East Market Attractiveness Analysis by Source
- Figure 93: Africa Market Value Share and BPS Analysis by Country, 2026 and 2036
- Figure 94: Africa Market Value Share and BPS Analysis by End Use, 2026 and 2036
- Figure 95: Africa Market Y-o-Y Growth Comparison by End Use, 2026-2036
- Figure 96: Africa Market Attractiveness Analysis by End Use
- Figure 97: Africa Market Value Share and BPS Analysis by Distribution Channel, 2026 and 2036
- Figure 98: Africa Market Y-o-Y Growth Comparison by Distribution Channel, 2026-2036
- Figure 99: Africa Market Attractiveness Analysis by Distribution Channel
- Figure 100: Africa Market Value Share and BPS Analysis by Source, 2026 and 2036
- Figure 101: Africa Market Y-o-Y Growth Comparison by Source, 2026-2036
- Figure 102: Africa Market Attractiveness Analysis by Source
- Figure 103: Global Market - Tier Structure Analysis
- Figure 104: Global Market - Company Share Analysis
Frequently Asked Questions
How big is the whole milk powder market in 2026?
FMI estimates the market at USD 9,082 million in 2026, up from USD 8,792 million in 2025. It is forecast to reach USD 12,565 million by 2036 at a 3.3% CAGR.
Which end use leads the market?
Confectionery leads with 26.0% of 2026 revenue by end use. Dairy products, bakery, infant formula and reconstituted retail milk hold 74.0%.
Who are the main exporters of whole milk powder?
New Zealand supplied 53.0% of global full cream milk powder exports in 2025 [4]. The OECD and FAO expect New Zealand, the European Union and the United States to supply 64.0% of exports in 2035 [1].
Which country is forecast to grow fastest through 2036?
Nigeria has the highest forecast CAGR among the profiled countries at 5.0% during 2026 to 2036, followed by Saudi Arabia at 4.0%.
What is the current price of whole milk powder?
Whole milk powder averaged USD 3,971 per tonne at a Global Dairy Trade event in early November 2026, up 5.9% [2].
Why is China important for whole milk powder?
China is the principal importer of New Zealand whole milk powder, but its share of global imports is projected to fall to 15.0% by 2035 [1].
Preview the report firsthand - request a free sample
Get SampleGet the brochure for pricing and purchase details.
Get PDF
