
- Market Size (2026)
- USD 3.7 Bn
- Forecast (2036)
- USD 5.7 Bn
- CAGR (2026 to 2036)
- 4.6%
How big is the Wrenches Market in 2026?
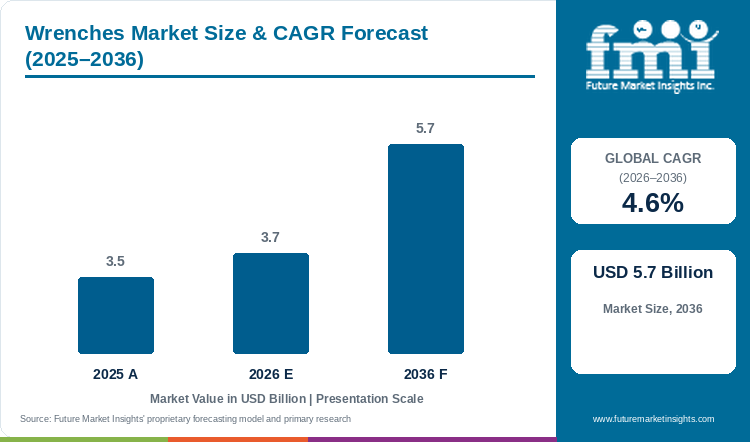
The global wrenches market is estimated at USD 3.66 billion in 2026, compared with USD 3.50 billion in 2025, and is forecast to reach USD 5.74 billion by 2036, expanding at a CAGR of 4.6% from 2026 to 2036.
Demand for wrenches is driven by vehicle assembly and is expanding to the servicing of the much larger fleet already on the road. Rules on tool condition and calibration standards for torque tools are supporting this demand, and the market is expected to grow at a mid-single-digit rate through 2036. For example, OICA recorded 96.4 million vehicles produced worldwide in 2025. Similarly, ACEA's January 2026 report counted 256.0 million cars on EU roads in 2024. New production creates fastener work in factories, and servicing the established fleet supports purchases of workshop sets and individual replacement tools, since workshops buy worn-tool replacements and sizes absent from their original kits. Production and fleet counts describe the work in which wrenches are used and not the number of wrenches bought, because a workshop reuses a suitable tool until it wears out or goes missing.
Tool condition and calibration are a second driver. In the United States, OSHA's construction rule prohibits the use of adjustable, pipe, end and socket wrenches whose jaws have sprung enough to slip. This supports replacement orders while existing tool kits remain in service. For instance, ISO 6789-2:2017 specifies calibration methods and measurement-uncertainty calculations for hand torque tools. According to FMI analysis, suppliers serving controlled-tightening work therefore compete on calibration support as well as the initial wrench sale. The OSHA rule covers construction work, so it is not a universal requirement for every workshop.
Market Size & Forecast
Table 1: Wrenches Market Size and Forecast (USD billion and CAGR percentage), 2025 to 2036
| Market size and forecast | Value |
|---|---|
| 2025 Value | USD 3.50 billion |
| Estimated market size in 2026 | USD 3.66 billion |
| Projected market size by 2036 | USD 5.74 billion |
| CAGR (2026-2036) | 4.6% |
| Added revenue, 2026 to 2036 | USD 2.08 billion |
Key Market Trends & Insights
- Adjustable wrenches are estimated to account for 34.7% of revenue by product type in 2026, because one tool covers several fastener sizes for maintenance staff moving between repairs.
- Steel is expected to hold 82.6% of revenue by material in 2026, so load-bearing strength sets the base of sales.
- Vehicle output feeds factory maintenance. OICA recorded 96.4 million vehicles produced worldwide in 2025, which supports wrench orders for production equipment and later vehicle servicing.
- Tool-condition rules drive replacement. OSHA prohibits construction use of wrenches whose sprung jaws allow slippage, so removing worn tools from use supports orders for individual replacements.
- Calibration supports torque-tool sales. ISO 6789-2:2017 sets out calibration methods for hand torque tools and the calculation of measurement uncertainty, so accessible calibration support affects supplier choice for controlled-tightening work.
- The installed fleet sustains repeat orders. ACEA counted 256.0 million cars on EU roads in 2024, which keeps workshops buying replacement wrenches and sets.
Regional Highlights
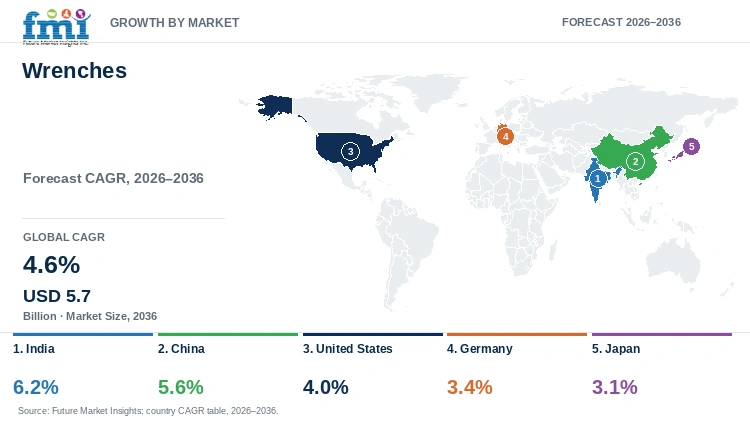
- India is likely to grow at a 6.2% CAGR during the forecast period, followed by China at 5.6%, the United States at 4.0%, Germany at 3.4% and Japan at 3.1%.
Analyst Perspective
“Wrench suppliers have a continuing opportunity in worn-tool replacements and missing sizes across existing workshop kits. Workshop buyers need consistent fit and access to individual replacements, while calibration and repair support strengthen the offer for torque tools used in controlled tightening.”
- Nikhil Kaitwade, Principal Consultant, FMI
How is the Wrenches Market segmented?
The Wrenches Market is segmented by product type, material, application, distribution channel and region.
- By Product Type: Adjustable, Box-end, Open-end, Socket and Torque.
- By Material: Steel, Aluminum and Plastic or Composite.
- By Application: Automotive, Industrial, Home Improvement and Construction.
- By Distribution Channel: Offline and Online.
- By Region: North America, Latin America, Western Europe, Eastern Europe, East Asia, South Asia and Pacific, and Middle East and Africa.
Why are Adjustable Wrenches the Leading Product Type in the Wrenches Market?
Adjustable wrenches account for an estimated 34.7% of wrenches revenue by product type in 2026, equal to about USD 1.27 billion, as per FMI's analysis.
Table 2: Product Type Share for the Wrenches Market (percentage share of revenue), 2026
| Segment | Share (2026) |
|---|---|
| Adjustable | 34.7% |
| Other segments combined | 65.3% |
An adjustable wrench covers several fastener sizes, so its value depends on a jaw that moves smoothly and holds the required fit. OSHA's construction rule gives a defined example of why condition matters, since it prohibits the use of adjustable, pipe, end and socket wrenches when their jaws are sprung to the point that slippage occurs. Versatility supports demand only while the tool can engage the fastener securely.
However, a wide jaw opening does not make one wrench suitable for every load or working space. Handle length, the adjustment mechanism and the room available around the fastener still decide whether it can do the job, and replacement purchases follow wear and loss as well as the creation of new kits. Box-end, open-end, socket and torque products together hold the remaining 65.3%.
Suppliers best placed to hold this share provide consistent jaw fit, clear dimensions and common sizes as individual replacements. That allows a workshop to retain a useful assortment without replacing a complete set when one tool is lost or worn.
Why is Steel the Leading Material in the Wrenches Market?
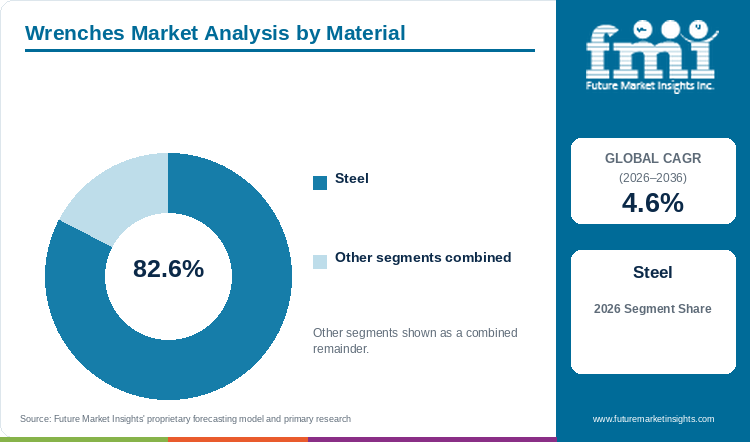
Steel is expected to hold 82.6% of wrenches revenue by material in 2026.
Table 3: Material Share for the Wrenches Market (percentage share of revenue), 2026
| Segment | Share (2026) |
|---|---|
| Steel | 82.6% |
| Other segments combined | 17.4% |
Demand centres on the strength and durability needed in tools that carry repeated loads. The steel description alone does not show working quality, because the shape of the head, the condition of the working surfaces and the quality of manufacture all affect fit and behaviour in use.
However, aluminum and plastic or composite designs retain roles where their properties suit the work. A covering on a steel wrench does not change the load-bearing material used for this segmentation, so buyers need to distinguish the construction of the tool from its finish or grip.
Suppliers best placed make steel tools with consistent working surfaces and offer specialised shapes where access is difficult. Their opportunity includes dependable standard wrenches and designs that make repeated work easier, and not a material claim alone.
What are the Key Drivers, Restraints and Opportunities in the Wrenches Market?
The wrenches market is expected to grow from USD 3.66 billion in 2026 to USD 5.74 billion by 2036, which adds USD 2.08 billion over the forecast period. Installed equipment supports recurring demand, while poor fit and tool wear limit useful service, and torque-tool support and practical replacement offers create further opportunities.
Driver: assembly and continuing maintenance. Both new assemblies and the fleet already in use require fastener work. Workshops buy worn-tool replacements and sizes absent from their original kits, although they can reuse suitable tools, so the range of jobs and the condition of an existing assortment matter more than vehicle counts alone.
Restraint: poor fit and restricted access. A wrench can appear adequate until it meets a difficult fastener in a confined space. Loose fit can slow work or damage a component, and OSHA specifically addresses jaws sprung enough to permit slippage in construction work. A low purchase price loses its appeal when the tool cannot complete the intended task, and a large set count gives little value if the included sizes do not match the workshop's work.
Opportunity: replacement and torque-tool service. A workshop may need only one missing size, while a customer performing specified tightening work needs confidence in the torque tool over its working life. ISO 6789-2 addresses calibration and measurement uncertainty, so individual replacements, accessible calibration and repair, and training where needed give suppliers a continuing relationship with professional users.
Suppliers that keep useful sizes available and support the tools that require measurement control are well placed to secure repeat purchases. The offer needs to follow the work a customer performs, because a household repair and a repeated professional tightening task call for different products and support.
How do Tool Rules and Calibration Standards Influence Wrench Demand?
Tool-condition rules and calibration standards affect different parts of the wrench purchase. One concerns whether a wrench remains safe to use in a defined workplace setting, and the other concerns confidence in the measurement made by a hand torque tool.
Rules on wrench condition in construction work
OSHA 1926.301 prohibits use of adjustable, pipe, end and socket wrenches when the jaws are sprung to the point that slippage occurs. That creates a clear reason for inspection and replacement in construction tool management. The rule applies to construction work and is not a universal product approval for every wrench or every workshop.
Standards for hand torque-tool calibration
ISO 6789-2:2017 sets out requirements for calibration and the determination of measurement uncertainty for hand torque tools. A buyer using a wrench for a specified tightening task needs an appropriate working range and a route for maintaining measurement confidence. The standard makes calibration support commercially relevant, while the required service arrangement still follows the customer's task and process.
These requirements do not make every general-purpose wrench a measuring instrument. They give buyers separate reasons to replace an unsuitable tool or service a torque wrench, and suppliers that explain the intended duty, identify products clearly and provide an accessible service route can support both decisions without treating them as the same purchase.
What Technical and Operational Constraints Affect Wrench Use?
The constraints on wrench use sit at the fastener, in the surrounding space and in the condition of the tool, and a design that addresses one constraint may still be unsuitable for another.
The first is engagement. The working surfaces must fit the fastener, and an adjustable jaw must hold its setting under use. A loose or damaged tool can slip even if its opening is large enough, and OSHA's construction rule on sprung jaws gives a specific example of a condition that requires the tool to be taken out of use.
The second is access. Head dimensions, handle length and the movement available around the fastener determine whether the user can position and turn a wrench. That makes specialised shapes useful in restricted spaces, while the same tool may offer little advantage on an exposed fastener.
The third is manufacture and wear. Steel supplies the load-bearing construction of much of the market, but two steel tools can differ in their geometry and finished working surfaces. A workshop also needs replacements for lost or worn pieces, and set size and packaging do not show whether the assortment will remain useful through repeated work.
The fourth is measurement support. A torque wrench must work within the range appropriate to its task, and its owner needs access to calibration or repair. ISO 6789-2 addresses calibration and measurement uncertainty, and digital readings and recorded information can help where the process needs them, but those features still have to serve the actual tightening requirement.
These constraints favour suppliers that describe dimensions and working ranges clearly, maintain consistent manufacture and make replacements and service practical. They also explain why a customer may buy a particular wrench alongside a general set.
Where are the Commercial Opportunities for Wrench Suppliers?
The opportunity lies in keeping a working kit useful, choosing its contents for real tasks and supporting controlled tightening after the sale.
The first is replacement during active work. A missing or damaged wrench can interrupt a repair already under way, and a supplier that holds common sizes as individual items can solve that problem without requiring the customer to buy a complete set. The large installed vehicle fleet described by ACEA provides a continuing setting for such maintenance work.
The second is assortment. Smaller repair shops may prefer common sizes at an accessible cost, while professional users may pay more for a shape that reaches a difficult fastener or reduces repeated repositioning. A useful selection is worth more to either customer than extra pieces that see little use. Offline supply offers immediate access, while online catalogues can broaden choice when dimensions and product identity are clear.
The third is torque-tool service. Calibration, repair and training can support a tool throughout its working life, and digital features add value where the customer needs readings or records as part of the job. The wider automotive torque tools category includes assembly equipment beyond the hand-wrench boundary used here, so suppliers need to match the offer to the actual process.
Wrenches Market by Country (2026 to 2036)
Table 4: Country Growth Outlook for the Wrenches Market (CAGR percentage), 2026 to 2036
| Country | CAGR (2026-2036) |
|---|---|
| India | 6.2% |
| China | 5.6% |
| United States | 4.0% |
| Germany | 3.4% |
| Japan | 3.1% |
What is supporting wrench demand in India?
India is likely to grow at a 6.2% CAGR during the forecast period, the highest rate among the countries analysed.
OICA records approximately 6.5 million vehicles produced in the country in 2025. Assembly work sits alongside continuing repair of vehicles and industrial equipment, which is an advantage for suppliers of workshop tools. The disadvantage is price sensitivity: smaller workshops need common sizes without tying up cash in rarely used pieces, and accessible pricing needs to be matched by dependable performance in daily use.
Growth is likely to follow vehicle output and the repair base. Suppliers that make individual replacements readily available and distribute them close to working technicians can serve that need, with selected torque tools added where controlled tightening is required.
What is shaping wrench purchases in China?
China is likely to grow at a 5.6% CAGR during the forecast period.
Its vehicle production reached approximately 34.5 million units in OICA's 2025 table, 10% above 2024. Demand spans high-volume operations seeking consistent specifications and smaller workshops seeking a particular size or access shape, which is an advantage for suppliers with a broad range. The disadvantage is that these buyers do not require one uniform assortment.
Clear online catalogues can widen selection, while local repair or calibration remains useful for tools that need service. Suppliers are best placed when they keep quality consistent across the chosen range and match the support to the customer's work.
What is driving wrench replacement in the United States?
The United States is likely to grow at a 4.0% CAGR during the forecast period.
A professional technician often buys a wrench to replace a missing item or finish work already in progress, so distribution and retail availability matter alongside price. The OSHA construction rule noted above also gives a defined reason for inspection and replacement. Both are advantages for suppliers with dependable access to individual sizes. The disadvantage is that torque-tool users need a further route for calibration or repair.
Suppliers that offer clear warranty procedures and dependable access to individual sizes reduce interruptions and help customers retain a useful kit.
What supports professional wrench purchases in Germany?
Germany is likely to grow at a 3.4% CAGR during the forecast period.
ACEA counted 49.3 million cars on German roads in 2024. Servicing a fleet of that size supports repeat orders for replacement wrenches and workshop sets, which is an advantage. The disadvantage is that industrial and vehicle-service users performing specified tightening work may require calibration support and traceable tool identification, while general wrenches face a separate assessment of fit and access.
A broad catalogue helps only if the required individual items remain available. Suppliers can serve replacement demand and additions for new equipment by giving clear working ranges and dimensions and by making it practical for a workshop to maintain its established assortment.
What influences wrench selection in Japan?
Japan is likely to grow at a 3.1% CAGR during the forecast period, the lowest rate among the countries analysed.
OICA recorded 8.4 million vehicles produced there in 2025. Maintaining that production equipment supports demand for hand wrenches alongside tools used in vehicle servicing, which is an advantage. The disadvantage is space: compact machinery and closely arranged assemblies give head dimensions and available movement a clear role in tool selection, and a wrench can be strong enough yet awkward to use in the actual space.
Specialised shapes and clear size markings can help with repeated work, while general-purpose products continue to serve less demanding tasks at a different price point. Suppliers have the strongest opportunity where a particular design improves access or handling and where replacements follow wear or changes in the equipment serviced.
Who are the notable companies in the Wrenches Market?
Companies differ by the breadth of their wrench ranges, the work those tools serve and the support available after purchase. The suppliers named in this report include large tool groups and professional workshop specialists. A broad brand portfolio gives customers a choice of assortments, while individual product dimensions and service still decide suitability.
Stanley Black & Decker supplies wrenches through brands including FACOM and PROTO. Apex Tool Group is active through GEARWRENCH and other tool brands. These groups give workshop and industrial buyers access to broad hand-tool ranges, and the report groups brands under their supplier organisations and assigns no independent manufacturer share to each brand.
Snap-on Incorporated offers general hand tools and electronic torque wrenches, including TechAngle products. HAZET offers workshop and SYSTEM torque-wrench families, while Beta Utensili supplies general and specialised wrench and torque-tool ranges. Torque-tool buyers have a continuing service need, while users of general wrenches place more weight on fit, access and the availability of individual sizes.
However, catalogue breadth does not show that every product meets a particular duty, and the report assigns no company revenue shares. The companies best placed for repeat business are those whose tools suit the customer's work and whose replacement, warranty and service arrangements can be used in that customer's market.
Key Developments in the Wrenches Market
- On 15 January 2026, ACEA released Vehicles on European Roads 2026, reporting 256.0 million cars on EU roads in 2024.
- For 2025, OICA reported worldwide vehicle production of 96.4 million units, including 34.5 million in China and 6.5 million in India.
- In February 2017, ISO published ISO 6789-2 on calibration and the determination of measurement uncertainty for hand torque tools.
- OSHA's construction rule 1926.301 prohibits use of adjustable, pipe, end and socket wrenches whose jaws are sprung to the point that slippage occurs.
Key Players in the Wrenches Market
- Stanley Black & Decker
- Apex Tool Group
- Snap-on Incorporated
- HAZET
- Beta Utensili
Wrenches Market Report Scope
Table 5: Report Scope for the Wrenches Market (coverage fields and definitions), 2026 to 2036
| Coverage Field | Report Scope |
|---|---|
| Market Breakdown | Product Type (Adjustable, Box-end, Open-end, Socket, Torque); Material (Steel, Aluminum, Plastic or Composite); Application (Automotive, Industrial, Home Improvement, Construction); Distribution Channel (Offline, Online) |
| Quantitative Units | Revenue in USD billion and CAGR from 2026 to 2036 |
| Market Definition | Revenue from hand-operated adjustable, box-end, open-end, socket and torque wrenches used for assembly, repair and maintenance, including relevant socket-wrench assemblies. It excludes powered impact wrenches, full automated fastening systems and the value of a complete workshop kit where the non-wrench tools are not separable. Material follows the principal load-bearing construction, and a product with several working ends is counted once under its principal commercial type. |
| Regions Covered | North America, Latin America, Western Europe, Eastern Europe, East Asia, South Asia and Pacific, Middle East and Africa |
| Countries Covered | India, China, United States, Germany and Japan |
| Key Companies Covered | Stanley Black & Decker, Apex Tool Group, Snap-on Incorporated, HAZET and Beta Utensili |
| Forecast Period | 2026 to 2036 (with 2025 historical baseline) |
| Approach | Combined primary interviews, secondary literature analysis, and top-down data triangulation |
Wrenches Market - Research Methodology
The market assessment combines primary interviews with industry participants and secondary research drawn from company disclosures, trade data and industry publications. Market size is built from supply-side and demand-side estimates and validated top-down, and segment shares and competitive positioning are checked through data triangulation before publication.
Wrenches Market by Segments
By Product Type
- Adjustable
- Box-end
- Open-end
- Socket
- Torque
By Material
- Steel
- Aluminum
- Plastic or Composite
By Application
- Automotive
- Industrial
- Home Improvement
- Construction
By Distribution Channel
- Offline
- Online
By Region
- North America
- United States
- Canada
- Latin America
- Brazil
- Mexico
- Argentina
- Chile
- Western Europe
- Germany
- France
- United Kingdom
- Italy
- Spain
- Benelux
- Nordics
- Eastern Europe
- Poland
- Czech Republic
- Romania
- Hungary
- East Asia
- China
- Japan
- South Korea
- South Asia and Pacific
- India
- ASEAN
- Australia and New Zealand
- Middle East and Africa
- GCC Countries
- South Africa
- Turkiye
- Israel
Research Sources and Bibliography
- [1] International Organization of Motor Vehicle Manufacturers. World Motor Vehicle Production by Country/Region and Type: 2025. n.d.
- [2] European Automobile Manufacturers' Association. Report - Vehicles on European roads 2026. 15 January 2026.
- [3] Occupational Safety and Health Administration. 1926.301 - Hand tools. n.d.
- [4] International Organization for Standardization. ISO 6789-2:2017: Assembly tools for screws and nuts - Hand torque tools - Part 2: Requirements for calibration and determination of measurement uncertainty. February 2017.
Table of Content
- Key Takeaways
- Market Size and CAGR
- Top Growth Driver
- Fastest Growing Segment
- Leading Region
- Key Companies
- Emerging Opportunities
- Executive Summary
- Global Market Outlook
- Demand-side Trends
- Supply-side Trends
- Technology Roadmap Analysis
- Analysis and Recommendations
- Analyst Perspective (What is happening? Why now? What should investors know?)
- Key Questions Answered
- How large is the market?
- What is the CAGR?
- What are key trends?
- Which region dominates?
- Who are the leaders?
Read More...
- Market Overview
- Market Coverage / Taxonomy
- Market Definition / Scope / Limitations
- Research Methodology
- Chapter Orientation
- Analytical Lens and Working Hypotheses
- Market Structure, Signals, and Trend Drivers
- Benchmarking and Cross-market Comparability
- Market Sizing, Forecasting, and Opportunity Mapping
- Research Design and Evidence Framework
- Desk Research Programme (Secondary Evidence)
- Expert Input and Fieldwork (Primary Evidence)
- Tooling, Models, and Reference Databases
- Data Engineering and Model Build
- Quality Assurance and Audit Trail
- Market Background
- Market Dynamics (Drivers, Restraints, Opportunity, Trends)
- Scenario Forecast (Optimistic, Likely, Conservative)
- Impact Analysis
- AI Impact
- Sustainability Impact
- Regulatory Impact
- Technology Impact
- Consumer / Buyer Analysis
- Purchase Drivers
- Adoption Barriers
- Buyer Journey
- Opportunity Map Analysis
- Product Life Cycle Analysis
- Supply Chain Analysis
- Investment Feasibility Matrix
- Value Chain Analysis
- PESTLE and Porter's Analysis
- Regulatory Landscape
- Regional Parent Market Outlook
- Production and Consumption Statistics
- Import and Export Statistics
- Global Market Analysis and Forecast, 2021 to 2036
- Historical Market Size Value (USD Billion) Analysis, 2021 to 2025
- Current and Future Market Size Value (USD Billion) Projections, 2026 to 2036
- Y-o-Y Growth Trend Analysis
- Absolute $ Opportunity Analysis
- Global Market Pricing Analysis, 2021 to 2036
- Global Market Analysis and Forecast, By Product Type, 2021 to 2036
- Introduction / Key Findings
- Historical Market Size Value (USD Billion) Analysis By Product Type, 2021 to 2025
- Current and Future Market Size Value (USD Billion) Analysis and Forecast By Product Type, 2026 to 2036
- Adjustable
- Box-end
- Open-end
- Socket
- Torque
- Y-o-Y Growth Trend Analysis By Product Type, 2021 to 2025
- Absolute $ Opportunity Analysis By Product Type, 2026 to 2036
- Global Market Analysis and Forecast, By Material, 2021 to 2036
- Introduction / Key Findings
- Historical Market Size Value (USD Billion) Analysis By Material, 2021 to 2025
- Current and Future Market Size Value (USD Billion) Analysis and Forecast By Material, 2026 to 2036
- Steel
- Aluminum
- Plastic or Composite
- Y-o-Y Growth Trend Analysis By Material, 2021 to 2025
- Absolute $ Opportunity Analysis By Material, 2026 to 2036
- Global Market Analysis and Forecast, By Application, 2021 to 2036
- Introduction / Key Findings
- Historical Market Size Value (USD Billion) Analysis By Application, 2021 to 2025
- Current and Future Market Size Value (USD Billion) Analysis and Forecast By Application, 2026 to 2036
- Automotive
- Industrial
- Home Improvement
- Construction
- Y-o-Y Growth Trend Analysis By Application, 2021 to 2025
- Absolute $ Opportunity Analysis By Application, 2026 to 2036
- Global Market Analysis and Forecast, By Distribution Channel, 2021 to 2036
- Introduction / Key Findings
- Historical Market Size Value (USD Billion) Analysis By Distribution Channel, 2021 to 2025
- Current and Future Market Size Value (USD Billion) Analysis and Forecast By Distribution Channel, 2026 to 2036
- Offline
- Online
- Y-o-Y Growth Trend Analysis By Distribution Channel, 2021 to 2025
- Absolute $ Opportunity Analysis By Distribution Channel, 2026 to 2036
- Global Market Analysis and Forecast, By Region, 2021 to 2036
- Introduction
- Historical Market Size Value (USD Billion) Analysis By Region, 2021 to 2025
- Current Market Size Value (USD Billion) Analysis and Forecast By Region, 2026 to 2036
- North America
- Latin America
- Western Europe
- Eastern Europe
- East Asia
- South Asia and Pacific
- Middle East and Africa
- Market Attractiveness Analysis By Region
- North America Market Analysis and Forecast, By Country, 2021 to 2036
- Historical Market Size Value (USD Billion) Trend Analysis By Market Taxonomy, 2021 to 2025
- Market Size Value (USD Billion) Forecast By Market Taxonomy, 2026 to 2036
- By Country
- United States
- Canada
- By Product Type
- By Material
- By Application
- By Distribution Channel
- By Country
- Market Attractiveness Analysis
- By Country
- By Product Type
- By Material
- By Application
- By Distribution Channel
- Key Takeaways
- Latin America Market Analysis and Forecast, By Country
- Historical Market Size Value (USD Billion) Trend Analysis By Market Taxonomy, 2021 to 2025
- Market Size Value (USD Billion) Forecast By Market Taxonomy, 2026 to 2036
- By Country
- Brazil
- Mexico
- Argentina
- Chile
- By Product Type
- By Material
- By Application
- By Distribution Channel
- By Country
- Market Attractiveness Analysis
- By Country
- By Product Type
- By Material
- By Application
- By Distribution Channel
- Key Takeaways
- Western Europe Market Analysis and Forecast, By Country
- Historical Market Size Value (USD Billion) Trend Analysis By Market Taxonomy, 2021 to 2025
- Market Size Value (USD Billion) Forecast By Market Taxonomy, 2026 to 2036
- By Country
- Germany
- France
- United Kingdom
- Italy
- Spain
- Benelux
- Nordics
- By Product Type
- By Material
- By Application
- By Distribution Channel
- By Country
- Market Attractiveness Analysis
- By Country
- By Product Type
- By Material
- By Application
- By Distribution Channel
- Key Takeaways
- Eastern Europe Market Analysis and Forecast, By Country
- Historical Market Size Value (USD Billion) Trend Analysis By Market Taxonomy, 2021 to 2025
- Market Size Value (USD Billion) Forecast By Market Taxonomy, 2026 to 2036
- By Country
- Poland
- Czech Republic
- Romania
- Hungary
- By Product Type
- By Material
- By Application
- By Distribution Channel
- By Country
- Market Attractiveness Analysis
- By Country
- By Product Type
- By Material
- By Application
- By Distribution Channel
- Key Takeaways
- East Asia Market Analysis and Forecast, By Country
- Historical Market Size Value (USD Billion) Trend Analysis By Market Taxonomy, 2021 to 2025
- Market Size Value (USD Billion) Forecast By Market Taxonomy, 2026 to 2036
- By Country
- China
- Japan
- South Korea
- By Product Type
- By Material
- By Application
- By Distribution Channel
- By Country
- Market Attractiveness Analysis
- By Country
- By Product Type
- By Material
- By Application
- By Distribution Channel
- Key Takeaways
- South Asia and Pacific Market Analysis and Forecast, By Country
- Historical Market Size Value (USD Billion) Trend Analysis By Market Taxonomy, 2021 to 2025
- Market Size Value (USD Billion) Forecast By Market Taxonomy, 2026 to 2036
- By Country
- India
- ASEAN
- Australia and New Zealand
- By Product Type
- By Material
- By Application
- By Distribution Channel
- By Country
- Market Attractiveness Analysis
- By Country
- By Product Type
- By Material
- By Application
- By Distribution Channel
- Key Takeaways
- Middle East and Africa Market Analysis and Forecast, By Country
- Historical Market Size Value (USD Billion) Trend Analysis By Market Taxonomy, 2021 to 2025
- Market Size Value (USD Billion) Forecast By Market Taxonomy, 2026 to 2036
- By Country
- GCC Countries
- South Africa
- Turkiye
- Israel
- By Product Type
- By Material
- By Application
- By Distribution Channel
- By Country
- Market Attractiveness Analysis
- By Country
- By Product Type
- By Material
- By Application
- By Distribution Channel
- Key Takeaways
- Key Countries Market Analysis
- United States
- Pricing Analysis
- Market Share Analysis, 2025
- By Product Type
- By Material
- By Application
- By Distribution Channel
- Canada
- Pricing Analysis
- Market Share Analysis, 2025
- By Product Type
- By Material
- By Application
- By Distribution Channel
- Mexico
- Pricing Analysis
- Market Share Analysis, 2025
- By Product Type
- By Material
- By Application
- By Distribution Channel
- Brazil
- Pricing Analysis
- Market Share Analysis, 2025
- By Product Type
- By Material
- By Application
- By Distribution Channel
- Chile
- Pricing Analysis
- Market Share Analysis, 2025
- By Product Type
- By Material
- By Application
- By Distribution Channel
- Germany
- Pricing Analysis
- Market Share Analysis, 2025
- By Product Type
- By Material
- By Application
- By Distribution Channel
- United Kingdom
- Pricing Analysis
- Market Share Analysis, 2025
- By Product Type
- By Material
- By Application
- By Distribution Channel
- Italy
- Pricing Analysis
- Market Share Analysis, 2025
- By Product Type
- By Material
- By Application
- By Distribution Channel
- Spain
- Pricing Analysis
- Market Share Analysis, 2025
- By Product Type
- By Material
- By Application
- By Distribution Channel
- France
- Pricing Analysis
- Market Share Analysis, 2025
- By Product Type
- By Material
- By Application
- By Distribution Channel
- India
- Pricing Analysis
- Market Share Analysis, 2025
- By Product Type
- By Material
- By Application
- By Distribution Channel
- ASEAN
- Pricing Analysis
- Market Share Analysis, 2025
- By Product Type
- By Material
- By Application
- By Distribution Channel
- Australia and New Zealand
- Pricing Analysis
- Market Share Analysis, 2025
- By Product Type
- By Material
- By Application
- By Distribution Channel
- China
- Pricing Analysis
- Market Share Analysis, 2025
- By Product Type
- By Material
- By Application
- By Distribution Channel
- Japan
- Pricing Analysis
- Market Share Analysis, 2025
- By Product Type
- By Material
- By Application
- By Distribution Channel
- South Korea
- Pricing Analysis
- Market Share Analysis, 2025
- By Product Type
- By Material
- By Application
- By Distribution Channel
- Poland
- Pricing Analysis
- Market Share Analysis, 2025
- By Product Type
- By Material
- By Application
- By Distribution Channel
- Hungary
- Pricing Analysis
- Market Share Analysis, 2025
- By Product Type
- By Material
- By Application
- By Distribution Channel
- South Africa
- Pricing Analysis
- Market Share Analysis, 2025
- By Product Type
- By Material
- By Application
- By Distribution Channel
- United States
- Market Structure Analysis
- Competition Dashboard
- Competition Benchmarking
- Market Share Analysis of Top Players
- By Regional
- By Product Type
- By Material
- By Application
- By Distribution Channel
- Emerging Startups
- Innovation Benchmarking
- Competition Analysis
- Competition Deep Dive
- Stanley Black & Decker
- Overview
- Product Portfolio
- Profitability by Market Segments
- Sales Footprint
- Strategy Overview
- Marketing Strategy
- Product Strategy
- Channel Strategy
- Apex Tool Group
- Snap-on Incorporated
- HAZET
- Beta Utensili
- Stanley Black & Decker
- Case Studies
- Success Stories
- Recent Developments
- Competition Deep Dive
- Assumptions & Acronyms Used
List of Tables
- Table 1: Global Market Value (USD Billion) Forecast by Region, 2021 to 2036
- Table 2: Global Market Value (USD Billion) Forecast by Product Type, 2021 to 2036
- Table 3: Global Market Value (USD Billion) Forecast by Material, 2021 to 2036
- Table 4: Global Market Value (USD Billion) Forecast by Application, 2021 to 2036
- Table 5: Global Market Value (USD Billion) Forecast by Distribution Channel, 2021 to 2036
- Table 6: North America Market Value (USD Billion) Forecast by Country, 2021 to 2036
- Table 7: North America Market Value (USD Billion) Forecast by Product Type, 2021 to 2036
- Table 8: North America Market Value (USD Billion) Forecast by Material, 2021 to 2036
- Table 9: North America Market Value (USD Billion) Forecast by Application, 2021 to 2036
- Table 10: North America Market Value (USD Billion) Forecast by Distribution Channel, 2021 to 2036
- Table 11: Latin America Market Value (USD Billion) Forecast by Country, 2021 to 2036
- Table 12: Latin America Market Value (USD Billion) Forecast by Product Type, 2021 to 2036
- Table 13: Latin America Market Value (USD Billion) Forecast by Material, 2021 to 2036
- Table 14: Latin America Market Value (USD Billion) Forecast by Application, 2021 to 2036
- Table 15: Latin America Market Value (USD Billion) Forecast by Distribution Channel, 2021 to 2036
- Table 16: Western Europe Market Value (USD Billion) Forecast by Country, 2021 to 2036
- Table 17: Western Europe Market Value (USD Billion) Forecast by Product Type, 2021 to 2036
- Table 18: Western Europe Market Value (USD Billion) Forecast by Material, 2021 to 2036
- Table 19: Western Europe Market Value (USD Billion) Forecast by Application, 2021 to 2036
- Table 20: Western Europe Market Value (USD Billion) Forecast by Distribution Channel, 2021 to 2036
- Table 21: Eastern Europe Market Value (USD Billion) Forecast by Country, 2021 to 2036
- Table 22: Eastern Europe Market Value (USD Billion) Forecast by Product Type, 2021 to 2036
- Table 23: Eastern Europe Market Value (USD Billion) Forecast by Material, 2021 to 2036
- Table 24: Eastern Europe Market Value (USD Billion) Forecast by Application, 2021 to 2036
- Table 25: Eastern Europe Market Value (USD Billion) Forecast by Distribution Channel, 2021 to 2036
- Table 26: East Asia Market Value (USD Billion) Forecast by Country, 2021 to 2036
- Table 27: East Asia Market Value (USD Billion) Forecast by Product Type, 2021 to 2036
- Table 28: East Asia Market Value (USD Billion) Forecast by Material, 2021 to 2036
- Table 29: East Asia Market Value (USD Billion) Forecast by Application, 2021 to 2036
- Table 30: East Asia Market Value (USD Billion) Forecast by Distribution Channel, 2021 to 2036
- Table 31: South Asia and Pacific Market Value (USD Billion) Forecast by Country, 2021 to 2036
- Table 32: South Asia and Pacific Market Value (USD Billion) Forecast by Product Type, 2021 to 2036
- Table 33: South Asia and Pacific Market Value (USD Billion) Forecast by Material, 2021 to 2036
- Table 34: South Asia and Pacific Market Value (USD Billion) Forecast by Application, 2021 to 2036
- Table 35: South Asia and Pacific Market Value (USD Billion) Forecast by Distribution Channel, 2021 to 2036
- Table 36: Middle East and Africa Market Value (USD Billion) Forecast by Country, 2021 to 2036
- Table 37: Middle East and Africa Market Value (USD Billion) Forecast by Product Type, 2021 to 2036
- Table 38: Middle East and Africa Market Value (USD Billion) Forecast by Material, 2021 to 2036
- Table 39: Middle East and Africa Market Value (USD Billion) Forecast by Application, 2021 to 2036
- Table 40: Middle East and Africa Market Value (USD Billion) Forecast by Distribution Channel, 2021 to 2036
List of Figures
- Figure 1: Global Market Pricing Analysis
- Figure 2: Global Market Value (USD Billion) Forecast 2021-2036
- Figure 3: Global Market Value Share and BPS Analysis by Product Type, 2026 and 2036
- Figure 4: Global Market Y-o-Y Growth Comparison by Product Type, 2026-2036
- Figure 5: Global Market Attractiveness Analysis by Product Type
- Figure 6: Global Market Value Share and BPS Analysis by Material, 2026 and 2036
- Figure 7: Global Market Y-o-Y Growth Comparison by Material, 2026-2036
- Figure 8: Global Market Attractiveness Analysis by Material
- Figure 9: Global Market Value Share and BPS Analysis by Application, 2026 and 2036
- Figure 10: Global Market Y-o-Y Growth Comparison by Application, 2026-2036
- Figure 11: Global Market Attractiveness Analysis by Application
- Figure 12: Global Market Value Share and BPS Analysis by Distribution Channel, 2026 and 2036
- Figure 13: Global Market Y-o-Y Growth Comparison by Distribution Channel, 2026-2036
- Figure 14: Global Market Attractiveness Analysis by Distribution Channel
- Figure 15: Global Market Value (USD Billion) Share and BPS Analysis by Region, 2026 and 2036
- Figure 16: Global Market Y-o-Y Growth Comparison by Region, 2026-2036
- Figure 17: Global Market Attractiveness Analysis by Region
- Figure 18: North America Market Incremental Dollar Opportunity, 2026-2036
- Figure 19: Latin America Market Incremental Dollar Opportunity, 2026-2036
- Figure 20: Western Europe Market Incremental Dollar Opportunity, 2026-2036
- Figure 21: Eastern Europe Market Incremental Dollar Opportunity, 2026-2036
- Figure 22: East Asia Market Incremental Dollar Opportunity, 2026-2036
- Figure 23: South Asia and Pacific Market Incremental Dollar Opportunity, 2026-2036
- Figure 24: Middle East and Africa Market Incremental Dollar Opportunity, 2026-2036
- Figure 25: North America Market Value Share and BPS Analysis by Country, 2026 and 2036
- Figure 26: North America Market Value Share and BPS Analysis by Product Type, 2026 and 2036
- Figure 27: North America Market Y-o-Y Growth Comparison by Product Type, 2026-2036
- Figure 28: North America Market Attractiveness Analysis by Product Type
- Figure 29: North America Market Value Share and BPS Analysis by Material, 2026 and 2036
- Figure 30: North America Market Y-o-Y Growth Comparison by Material, 2026-2036
- Figure 31: North America Market Attractiveness Analysis by Material
- Figure 32: North America Market Value Share and BPS Analysis by Application, 2026 and 2036
- Figure 33: North America Market Y-o-Y Growth Comparison by Application, 2026-2036
- Figure 34: North America Market Attractiveness Analysis by Application
- Figure 35: North America Market Value Share and BPS Analysis by Distribution Channel, 2026 and 2036
- Figure 36: North America Market Y-o-Y Growth Comparison by Distribution Channel, 2026-2036
- Figure 37: North America Market Attractiveness Analysis by Distribution Channel
- Figure 38: Latin America Market Value Share and BPS Analysis by Country, 2026 and 2036
- Figure 39: Latin America Market Value Share and BPS Analysis by Product Type, 2026 and 2036
- Figure 40: Latin America Market Y-o-Y Growth Comparison by Product Type, 2026-2036
- Figure 41: Latin America Market Attractiveness Analysis by Product Type
- Figure 42: Latin America Market Value Share and BPS Analysis by Material, 2026 and 2036
- Figure 43: Latin America Market Y-o-Y Growth Comparison by Material, 2026-2036
- Figure 44: Latin America Market Attractiveness Analysis by Material
- Figure 45: Latin America Market Value Share and BPS Analysis by Application, 2026 and 2036
- Figure 46: Latin America Market Y-o-Y Growth Comparison by Application, 2026-2036
- Figure 47: Latin America Market Attractiveness Analysis by Application
- Figure 48: Latin America Market Value Share and BPS Analysis by Distribution Channel, 2026 and 2036
- Figure 49: Latin America Market Y-o-Y Growth Comparison by Distribution Channel, 2026-2036
- Figure 50: Latin America Market Attractiveness Analysis by Distribution Channel
- Figure 51: Western Europe Market Value Share and BPS Analysis by Country, 2026 and 2036
- Figure 52: Western Europe Market Value Share and BPS Analysis by Product Type, 2026 and 2036
- Figure 53: Western Europe Market Y-o-Y Growth Comparison by Product Type, 2026-2036
- Figure 54: Western Europe Market Attractiveness Analysis by Product Type
- Figure 55: Western Europe Market Value Share and BPS Analysis by Material, 2026 and 2036
- Figure 56: Western Europe Market Y-o-Y Growth Comparison by Material, 2026-2036
- Figure 57: Western Europe Market Attractiveness Analysis by Material
- Figure 58: Western Europe Market Value Share and BPS Analysis by Application, 2026 and 2036
- Figure 59: Western Europe Market Y-o-Y Growth Comparison by Application, 2026-2036
- Figure 60: Western Europe Market Attractiveness Analysis by Application
- Figure 61: Western Europe Market Value Share and BPS Analysis by Distribution Channel, 2026 and 2036
- Figure 62: Western Europe Market Y-o-Y Growth Comparison by Distribution Channel, 2026-2036
- Figure 63: Western Europe Market Attractiveness Analysis by Distribution Channel
- Figure 64: Eastern Europe Market Value Share and BPS Analysis by Country, 2026 and 2036
- Figure 65: Eastern Europe Market Value Share and BPS Analysis by Product Type, 2026 and 2036
- Figure 66: Eastern Europe Market Y-o-Y Growth Comparison by Product Type, 2026-2036
- Figure 67: Eastern Europe Market Attractiveness Analysis by Product Type
- Figure 68: Eastern Europe Market Value Share and BPS Analysis by Material, 2026 and 2036
- Figure 69: Eastern Europe Market Y-o-Y Growth Comparison by Material, 2026-2036
- Figure 70: Eastern Europe Market Attractiveness Analysis by Material
- Figure 71: Eastern Europe Market Value Share and BPS Analysis by Application, 2026 and 2036
- Figure 72: Eastern Europe Market Y-o-Y Growth Comparison by Application, 2026-2036
- Figure 73: Eastern Europe Market Attractiveness Analysis by Application
- Figure 74: Eastern Europe Market Value Share and BPS Analysis by Distribution Channel, 2026 and 2036
- Figure 75: Eastern Europe Market Y-o-Y Growth Comparison by Distribution Channel, 2026-2036
- Figure 76: Eastern Europe Market Attractiveness Analysis by Distribution Channel
- Figure 77: East Asia Market Value Share and BPS Analysis by Country, 2026 and 2036
- Figure 78: East Asia Market Value Share and BPS Analysis by Product Type, 2026 and 2036
- Figure 79: East Asia Market Y-o-Y Growth Comparison by Product Type, 2026-2036
- Figure 80: East Asia Market Attractiveness Analysis by Product Type
- Figure 81: East Asia Market Value Share and BPS Analysis by Material, 2026 and 2036
- Figure 82: East Asia Market Y-o-Y Growth Comparison by Material, 2026-2036
- Figure 83: East Asia Market Attractiveness Analysis by Material
- Figure 84: East Asia Market Value Share and BPS Analysis by Application, 2026 and 2036
- Figure 85: East Asia Market Y-o-Y Growth Comparison by Application, 2026-2036
- Figure 86: East Asia Market Attractiveness Analysis by Application
- Figure 87: East Asia Market Value Share and BPS Analysis by Distribution Channel, 2026 and 2036
- Figure 88: East Asia Market Y-o-Y Growth Comparison by Distribution Channel, 2026-2036
- Figure 89: East Asia Market Attractiveness Analysis by Distribution Channel
- Figure 90: South Asia and Pacific Market Value Share and BPS Analysis by Country, 2026 and 2036
- Figure 91: South Asia and Pacific Market Value Share and BPS Analysis by Product Type, 2026 and 2036
- Figure 92: South Asia and Pacific Market Y-o-Y Growth Comparison by Product Type, 2026-2036
- Figure 93: South Asia and Pacific Market Attractiveness Analysis by Product Type
- Figure 94: South Asia and Pacific Market Value Share and BPS Analysis by Material, 2026 and 2036
- Figure 95: South Asia and Pacific Market Y-o-Y Growth Comparison by Material, 2026-2036
- Figure 96: South Asia and Pacific Market Attractiveness Analysis by Material
- Figure 97: South Asia and Pacific Market Value Share and BPS Analysis by Application, 2026 and 2036
- Figure 98: South Asia and Pacific Market Y-o-Y Growth Comparison by Application, 2026-2036
- Figure 99: South Asia and Pacific Market Attractiveness Analysis by Application
- Figure 100: South Asia and Pacific Market Value Share and BPS Analysis by Distribution Channel, 2026 and 2036
- Figure 101: South Asia and Pacific Market Y-o-Y Growth Comparison by Distribution Channel, 2026-2036
- Figure 102: South Asia and Pacific Market Attractiveness Analysis by Distribution Channel
- Figure 103: Middle East and Africa Market Value Share and BPS Analysis by Country, 2026 and 2036
- Figure 104: Middle East and Africa Market Value Share and BPS Analysis by Product Type, 2026 and 2036
- Figure 105: Middle East and Africa Market Y-o-Y Growth Comparison by Product Type, 2026-2036
- Figure 106: Middle East and Africa Market Attractiveness Analysis by Product Type
- Figure 107: Middle East and Africa Market Value Share and BPS Analysis by Material, 2026 and 2036
- Figure 108: Middle East and Africa Market Y-o-Y Growth Comparison by Material, 2026-2036
- Figure 109: Middle East and Africa Market Attractiveness Analysis by Material
- Figure 110: Middle East and Africa Market Value Share and BPS Analysis by Application, 2026 and 2036
- Figure 111: Middle East and Africa Market Y-o-Y Growth Comparison by Application, 2026-2036
- Figure 112: Middle East and Africa Market Attractiveness Analysis by Application
- Figure 113: Middle East and Africa Market Value Share and BPS Analysis by Distribution Channel, 2026 and 2036
- Figure 114: Middle East and Africa Market Y-o-Y Growth Comparison by Distribution Channel, 2026-2036
- Figure 115: Middle East and Africa Market Attractiveness Analysis by Distribution Channel
- Figure 116: Global Market - Tier Structure Analysis
- Figure 117: Global Market - Company Share Analysis
Frequently Asked Questions
What is the size of the Wrenches Market?
The global wrenches market was valued at USD 3.50 billion in 2025 and is estimated at USD 3.66 billion in 2026. It is forecast to reach USD 5.74 billion by 2036, expanding at a CAGR of 4.6% from 2026 to 2036.
Which product type and material lead the Wrenches Market?
Adjustable wrenches are estimated to hold 34.7% of revenue by product type in 2026, while steel is estimated to account for 82.6% by material.
Which country is likely to grow fastest in the Wrenches Market?
India is likely to grow at a 6.2% CAGR during the forecast period, followed by China at 5.6%, the United States at 4.0%, Germany at 3.4% and Japan at 3.1%.
Are powered impact wrenches included?
No. The market covers hand-operated wrenches and relevant socket-wrench assemblies, and powered impact wrenches and full automated fastening systems are excluded.
Does an insulated or coated steel wrench count as a plastic tool?
No. Material classification follows the principal load-bearing construction, and a covering does not move a steel wrench into the plastic or composite category.
Why does a torque wrench need a service plan?
The user needs confidence that the tool remains suitable for the required measurement. Calibration and repair support help maintain that confidence, and ISO 6789-2 addresses calibration and measurement uncertainty for hand torque tools. [4] Should every workshop buy the largest available set? No. Set composition should follow the sizes and access requirements of the work, and individual replacements can be more useful than additional pieces that are rarely used. Competitive Analysis of the Wrenches Market Key Players
Preview the report firsthand - request a free sample
Get SampleGet the brochure for pricing and purchase details.
Get PDF
