

- Industry Size (2026)
- USD 36.7 Bn
- Forecast (2036)
- USD 49.8 Bn
- CAGR (2026 to 2036)
- 3.1%
Compact Construction Equipment Market Size, Market Forecast and Outlook By FMI
The compact construction equipment market was valued at USD 35.6 billion in 2025. Market value is set to reach USD 36.7 billion by 2026-end and expand at a CAGR of 3.1% between 2026 and 2036 to reach USD 49.8 billion by 2036. Diesel powered equipment will dominate with a 68.0% power source share, and <100 HP machines will lead the power output segment with a 52.0% share.
Summary of the Compact Construction Equipment Market
- Demand and Growth Drivers
- Urban construction sites need smaller machines as contractors manage tight entry points and shorter work windows.
- Rental fleet replacement backs demand as smaller contractors prefer project-based machine access over full ownership.
- Public works repair activity keeps compact loaders and mini excavators in use across utility jobs.
- Product and Segment View
- Mini Excavators are expected to lead the product type segment with 38.0% share in 2026, reflecting trenching demand across utility and housing projects.
- <100 HP machines are estimated to contribute the highest to the power output demand with 52.0% share in 2026, as small contractors focus on fuel control and transport ease.
- Excavation is expected to account for a 42.0% share of the application segment in 2026, driven by the need for compact digging depth in foundation work and pipe trenching.
- Below 5 Ton Equipment is projected to lead operating weight demand with 47.0% share in 2026, backed by trailer movement and narrow site access.
- Geography and Competitive Outlook
- China is expected to record a CAGR of 4.0% through 2036, backed by urban renewal and public housing repair activity.
- India is projected to expand at 3.7% CAGR by 2036, as infrastructure spending and local equipment manufacturing improve buyer access.
- Caterpillar Inc. and Komatsu Ltd. hold strong positions with broad compact product depth and dealer service reach.
- Analyst Opinion
- Nikhil Kaitwade, Associate Vice President at FMI, says, “Compact construction equipment now shapes access and uptime for contractors on crowded sites. Buyers need transportable machines with reliable service support. Rental demand favors high utilization and attachment changeovers. Fleet selection should test dealer response and parts availability before purchase.”
- Compact Construction Equipment Market Value Analysis
- The compact construction equipment market is moving from USD 36.7 billion in 2026 to USD 49.8 billion by 2036.
- Mini Excavators are leading product demand as compact digging machines reduce manual trenching on restricted worksites.
- Demand for construction equipment attachments improves machine utilization as contractors add buckets and breakers.
- Rental channels influence pricing as buyers compare project use rates with full ownership cost.
- Diesel platforms keep strong demand as parts access and field repair familiarity reduce downtime risk.
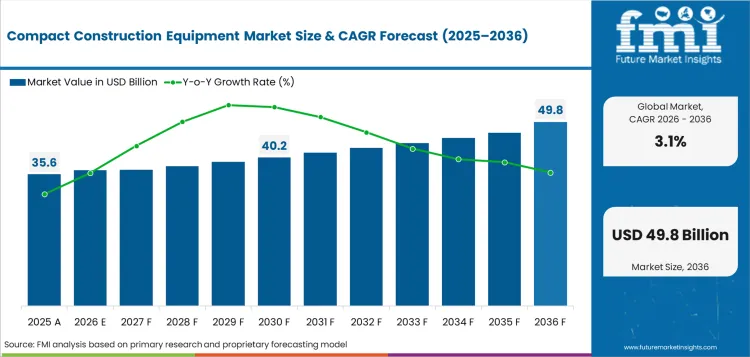
Key Takeaways
| Metric | Value |
|---|---|
| Market Size (2025) | USD 35.6 Billion |
| Market Size (2036) | USD 49.8 Billion |
| CAGR (2026–2036) | 3.1% |
| Incremental Opportunity (2026–2036) | USD 13.1 Billion |
| Leading Product Type (2026) | Mini Excavators |
| Mini Excavators Share (2026) | 38.0% |
| Fastest-Growing Country | China |
| China CAGR | 4.0% |
| 2nd Fastest-Growing Country | India |
| India CAGR | 3.7% |
Tight jobsites and emissions rules are changing how contractors choose compact construction equipment. Volvo Construction Equipment stated in January 2024 that the 3.5-ton EC37 and 4-ton ECR40 offer 10% more fuel efficiency. That makes compact excavators more relevant for urban utility work where operating cost and maneuverability matter together. CASE Construction Equipment stated in August 2024 that the CX25EV electric mini excavator and CL36EV electric compact wheel loader will expand its EV lineup to five machines.
Electric models are likely to gain traction in indoor projects and city jobs with noise limits. Caterpillar launched eight next-generation skid steer and compact track loader models in September 2024. Higher lift height and operating capacity support broader attachment use. Bobcat stated in September 2024 that the T7X all-electric compact track loader is available through select dealers and rental channels. Rental access is expected to speed contractor testing before full fleet replacement.
Compact Construction Equipment Market Definition
The compact construction equipment market includes small earthmoving and jobsite machines used for excavation, loading, materials handling, and lifting work. Scope includes mini excavators, skid steers, track loaders, compact wheel loaders, backhoe loaders, and telehandlers used across construction and rental applications. Heavy mining trucks, large crawler excavators, tower cranes, and road pavers are outside the scope.
Compact Construction Equipment Market Inclusions
Market scope covers all commercially traded compact construction equipment categorized by product type, including track loaders, mini excavators, skid steers, compact wheel loaders, backhoe loaders, telehandlers, and others; power output, including <100 HP, 101-200 HP, 201-400 HP, and >400 HP; applications, including excavation, loading, materials handling, lifting and hoisting, and other site uses; operating weight, including below 5 ton equipment, 5 to 8 ton equipment, and above 8 ton compact equipment; power source, including diesel powered equipment, electric powered equipment, and hybrid equipment. Revenue scope covers 2026 to 2036. Key stakeholders include compact equipment manufacturers, engine and component suppliers, hydraulic system providers, attachment manufacturers, construction contractors, rental fleet operators, equipment dealers, infrastructure developers, agriculture users, industrial site operators, financing partners, and service providers.
Compact Construction Equipment Market Exclusions
Scope does not include heavy mining equipment, large earthmoving fleets, cranes, road paving systems, used equipment resale, or standalone repair service revenue.
Compact Construction Equipment Market Research Methodology
- Primary Research: FMI analysts talked to construction contractors, rental companies, equipment dealers, and fleet managers in important markets.
- Desk Research: Combined data from public construction indicators, government infrastructure records, equipment portfolios, and product specifications.
- Market sizing and forecasting: Added product demand across application groups and country-level replacement patterns from the bottom up.
- Data validation: Cross-checked the forecast against construction spending, rental fleet behavior, company product coverage, and country CAGR patterns.
Why is the Compact Construction Equipment Market Growing?
- Contractors are using compact machines to finish digging and loading work inside smaller plots.
- Rental firms are adding compact units as machines can move across housing and municipal repair jobs.
- Attachment use improves revenue hours for loaders and excavators on mixed work sites.
USA construction activity continues to give compact equipment buyers a large and steady project base. Public and private work volumes create recurring use for compact loaders and mini excavators across small work fronts. Contractors value machines to move quickly between repair sites and active construction areas. Dealer service depth will guide repeat purchases across rental fleets and contractor-owned equipment.
India is adding a policy-backed equipment angle to infrastructure spending. Public capital expenditure moved to a Budget Estimate of ₹12.2 lakh crore for FY2026-27, and the budget introduced a Scheme for Enhancement of Construction and Infrastructure Equipment. Compact equipment suppliers serving road projects and urban work gain a stronger policy signal from this spending base. Local production plans can lower import exposure over time for machines used across public works. Machine price and dealer reach will guide order decisions. Parts cost will carry weight as smaller contractors protect project margins.
Market Segmentation Analysis
- Mini Excavators are estimated to make up 38.0% of product type revenue in 2026, due to trenching and small excavation work across compact sites.
- <100 HP machines are projected to hold 52.0% of power output sales in 2026, reflecting practical use across contractor-owned compact fleets.
- Excavation is expected to capture 42.0% of application share in 2026, backed by foundation digging and utility repair needs.
- Below 5 Ton Equipment is poised to represent 47.0% of operating weight volume in 2026, helped by easier trailer movement across urban sites.
- Diesel Powered Equipment is predicted to contribute 68.0% of power source demand in 2026, reflecting deeper service access across rural and urban fleets.
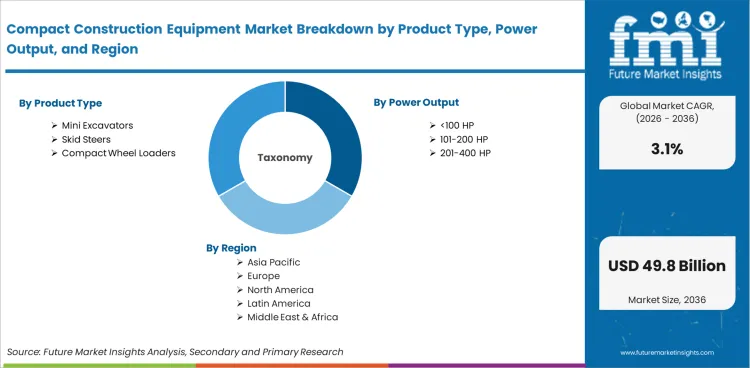
Compact construction equipment market is divided into five main segment groups based on product type, power output, application, operating weight, and power source. Product type includes Track Loaders, Mini Excavators, Skid Steers, Compact Wheel Loaders, Backhoe Loaders, Telehandlers, and Others. Power output includes <100 HP, 101-200 HP, 201-400 HP, and >400 HP. Application includes Excavation, Loading, Materials Handling, Lifting and Hoisting, and Other Applications. Operating weight includes Below 5 Ton Equipment, 5 to 8 Ton Equipment, and Above 8 Ton Compact Equipment. Power source includes Diesel Powered Equipment, Electric Powered Equipment, and Hybrid Equipment.
Insights into the Mini Excavators Product Type Segment
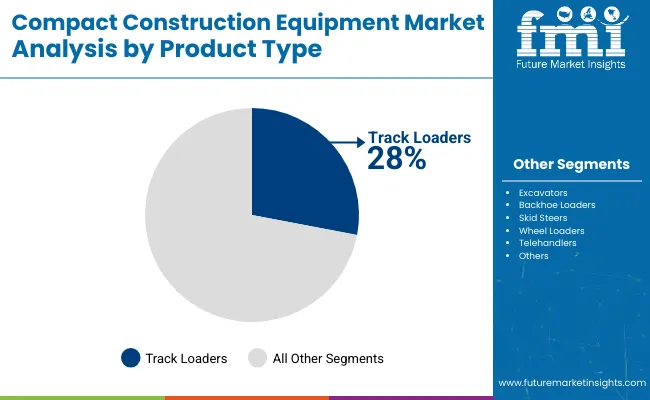
- In 2026, Mini Excavators are expected to make up 38.0% of the product type segment. Their use is strongest across trenching and small foundation work requiring compact digging depth.
- Track loaders and skid steers serve loading and grading jobs. Mini excavators carry higher value in sites requiring deeper cuts and controlled bucket movement.
Insights into the <100 HP Power Output Segment
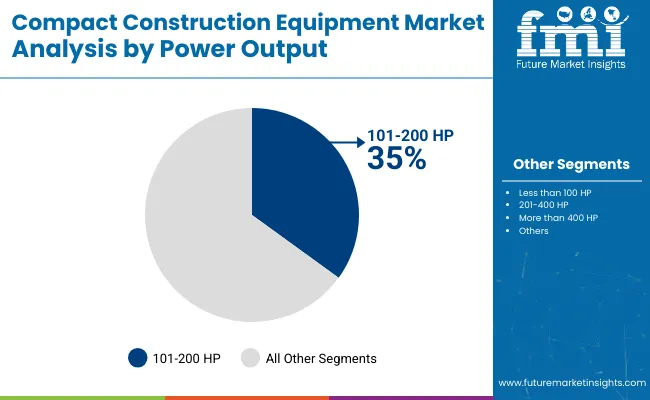
- <100 HP machines are projected to account for 52.0% of the power output segment in 2026. Smaller contractors prefer this range for manageable fuel use and easier transport planning.
- Higher horsepower machines serve heavier site work and larger handling tasks. Lower horsepower units keep ownership costs easier to manage for rental fleets and small builders.
Insights into the Excavation Application Segment
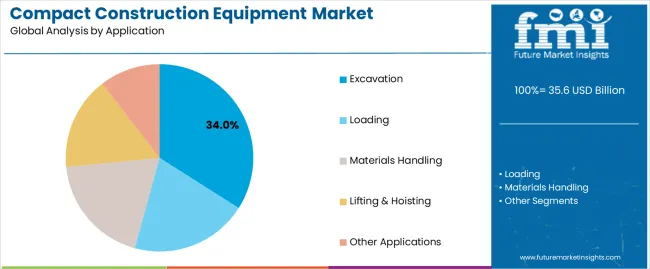
- Excavation is estimated to account for 42.0% share of the application segment in 2026. Foundation digging and utility trenching keep compact excavators central to jobsite planning.
- Loading and materials handling applications use compact wheel loaders and skid steers. Excavation carries higher priority in projects requiring depth control and limited site movement.
Insights into the Below 5 Ton Equipment Operating Weight Segment
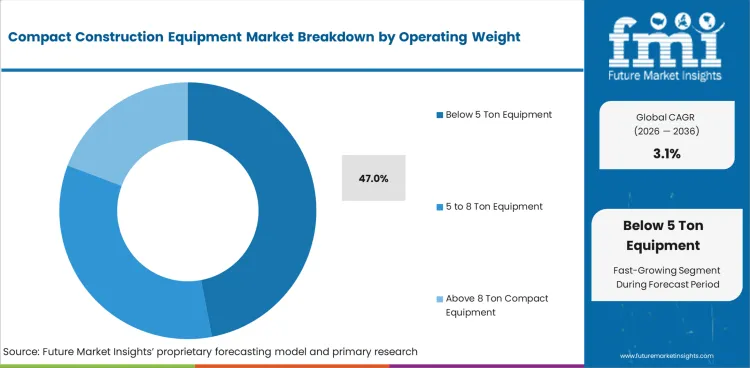
- Below 5 Ton Equipment is expected to represent 47.0% share in 2026. Lighter machines suit trailer movement and restricted entry points across urban repair work.
- Heavier compact machines address industrial sites and larger infrastructure jobs. Below 5 Ton units gain preference in landscaping and residential projects requiring easier machine placement.
Insights into the Diesel-Powered Equipment Power Source Segment
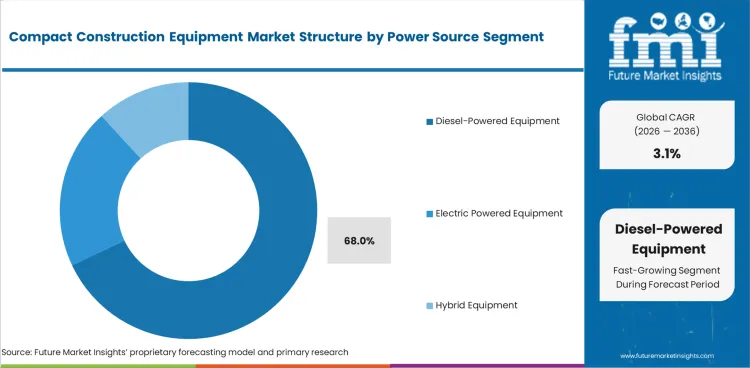
- In 2026, Diesel Powered Equipment is projected to hold 68.0% share. Established service networks and field repair familiarity keep diesel units preferred across active fleets.
- Electric and hybrid options address selected indoor projects and low-noise municipal jobs. Diesel machines retain broader use across outdoor sites requiring longer operating hours.
Compact Construction Equipment Market Drivers, Restraints, and Opportunities
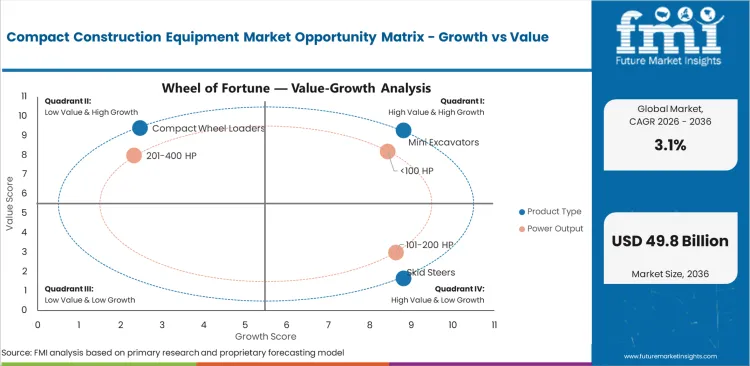
- Urban site access is creating structured demand for compact machines across repair and housing projects.
- Rental fleet utilization is increasing the need for durable loaders and easy-to-service mini excavators.
- Battery charging gaps create a restraint for electric compact machines across remote and multi-site work.
Compact construction equipment demand keeps growing as contractors need smaller machines for trenching and urban site work. High purchase costs and pressure on rental margins can slow faster fleet replacement among smaller contractors. Market expansion continues through mini excavators and rental fleet replacement across housing and municipal repair projects.
Utilization Floors Are Limiting Dealer Discounting
Compact construction equipment pricing is being supported by work-site utilization instead of broad equipment scarcity alone. In January 2026, the USA Census Bureau reported total construction spending at a seasonally adjusted annual rate of USD 2,190.4 billion, while highway construction reached $148.5 billion. Compact excavators and skid steers gain steady use across highway repair and utility work. Compact track loaders and small loaders also benefit from residential improvements and urban infill projects. Higher fleet utilization reduces dealer pressure to discount new machines. Firmer rental resale values can hold as financing costs shape buyer negotiations.
Financing Strength Is Protecting Equipment Prices
Compact construction equipment prices are also being influenced by the availability of financing, especially for contractors choosing between purchase, lease, and rental-to-own structures. As per ELFA’s April 2026 report, March 2026 total new business volume among surveyed member companies was $10.8 billion, with year-to-date NBV up 18.6% versus the same period in 2025. This supports pricing because finance-backed demand allows dealers to defend transaction values instead of relying heavily on cash discounts. Compact machine buyers now treat monthly payment design with the same importance as list-price reduction during negotiations.
Analysis of Compact Construction Equipment Market By Key Countries
.webp "Top Country Growth Comparison Compact Construction Equipment Market Cagr (2026 2036)")
| Country | CAGR |
|---|---|
| China | 4.0% |
| India | 3.7% |
| Germany | 3.4% |
| Brazil | 3.1% |
| USA | 2.8% |
| UK | 2.5% |
| Japan | 2.2% |
Source: Future Market Insights, 2026.
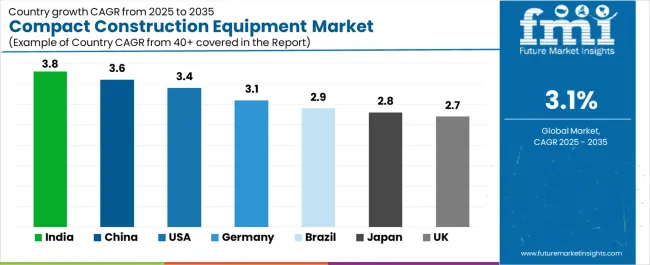
Compact Construction Equipment Market CAGR Analysis By Country
- China is projected to record 4.0% CAGR through 2036, backed by public housing repair and urban renewal programs.
- India is expected to expand at 3.7% CAGR as infrastructure capital spending lifts local equipment orders.
- Germany is forecast at 3.4% CAGR, supported by civil engineering work and efficient compact machine needs.
- Brazil is projected to advance at 3.1% CAGR, with cost-sensitive builders favoring smaller site equipment.
- USA is expected to post 2.8% CAGR, as rental fleets and highway repair work sustain compact machine use.
- UK is forecast to grow at 2.5% CAGR, helped by repair activity across a mature construction base.
- Japan is expected to record 2.2% CAGR, as urban renewal work creates measured replacement demand.
Demand for compact construction equipment is forecast to rise at 3.1% CAGR from 2026 to 2036. Country-level analysis covers the major markets contributing to this forecast, with the key markets listed below.
Demand Outlook for Compact Construction Equipment Market in China
China’s compact construction equipment industry is projected to record a CAGR of 4.0% through 2036. China’s construction sector keeps a large project base despite softer building activity across several work areas. Public housing repair and municipal projects keep compact machines important for trenching and loading work. Real estate softness creates pressure on new equipment orders, but repair programs keep demand active. Suppliers with compact excavator depth and dealer reach can protect volume across public works packages.
- Public housing repair improves demand for compact excavation and loading machines in dense urban areas.
- Renovation of old residential compounds favors machines with low site disruption and short movement radius.
- Local suppliers need service strength as buyers compare uptime across recurring municipal work.
Sales Analysis of Compact Construction Equipment Market in India
The compact construction equipment sector in India is expected to expand at a CAGR of 3.7% during the assessment period. India’s infrastructure spending is creating a stronger base for equipment used across public works and construction projects. The construction and infrastructure equipment scheme adds a local manufacturing focus for advanced machines used by contractors and rental fleets. This can improve availability for compact equipment buyers outside large metro areas.
- Road and urban infrastructure spending creates demand for compact machines across small work packages.
- Domestic equipment manufacturing plans can reduce buyer exposure to imported compact machine prices.
- Contractors need dealer networks to handle parts replacement outside major construction centers.
Demand Outlook for Compact Construction Equipment Market in Germany
The Germany compact construction equipment industry is forecast to grow at a CAGR of 3.4% by 2036. German production data showed construction industry output down 1.2% month on month in February 2026, which underlines near-term pressure on equipment orders. Machinery and equipment orders rose 6.9% in March 2026, pointing to some recovery in industrial buying. Compact machines can benefit as contractors focus on productivity and lower operating risk.
- Civil engineering work can keep compact loaders active despite weaker building activity.
- Rental firms are expected to refresh selectively around higher-use compact excavators and loaders.
- Buyers favor machines with lower fuel use and dependable service documentation.
Opportunity Analysis of Compact Construction Equipment Market in Brazil
The compact construction equipment segment in Brazil is expected to advance at 3.1% CAGR over the forecast years. Brazil’s National Index of Civil Construction increased 1.54% in January 2026, and twelve-month construction cost inflation reached 6.71%. This cost base makes ownership planning more sensitive for smaller contractors. Compact equipment demand benefits from machines to reduce hand labor and limit idle time on site.
- Cost-sensitive buyers evaluate compact machines through fuel use and service exposure.
- Regional construction firms need machines to move across housing and repair projects.
- Rental and leasing companies can improve access for smaller contractors facing tighter cash flow.
Future Outlook for Compact Construction Equipment Market in the United States
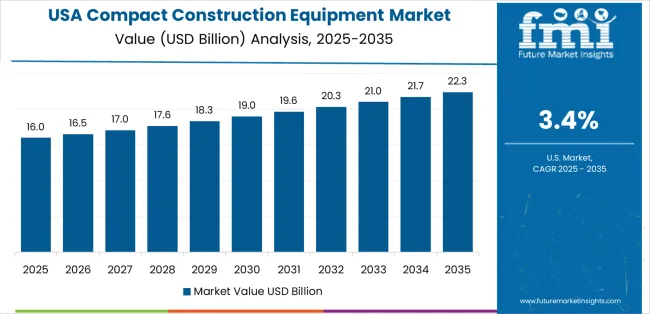
The U.S. compact construction equipment industry is expected to post 2.8% CAGR through 2036. USA construction activity provides a mature project base for compact equipment suppliers and rental fleets. Public construction and highway repair work create steady use for loaders and mini excavators across smaller project packages. Rental fleets stay important as contractors need flexible machine access across short-duration jobs. Suppliers with parts availability and telematics service records can hold stronger positions with rental buyers.
- Rental fleets guide equipment demand through utilization rates and resale value expectations.
- Highway repair work enhances demand for compact loaders and mini excavators on smaller sites.
- Dealers with fast service response can reduce downtime exposure for contractor-owned equipment.
Demand Outlook for Compact Construction Equipment Market in the United Kingdom
The UK compact construction equipment industry is forecast at 2.5% CAGR through 2036. Monthly construction output grew by 1.0% in February 2026, after a revised 0.5% increase in January. New work grew 1.0%, and repair and maintenance increased 0.9% during February 2026. It favors compact equipment use across repair jobs and smaller site activities. Suppliers with electric mini excavator lines can address low-noise work in dense areas.
- Repair and maintenance activity boosts steady demand for compact machines across urban worksites.
- Rental companies use compact equipment to serve housing repair and small public projects.
- Low-noise site requirements improves selective demand for electric micro excavators.
In-depth Analysis of Compact Construction Equipment Market in Japan
The Japan compact construction equipment industry is expected to post 2.2% CAGR through 2036. MLIT reported enterprise land investment plans of 3,775.8 billion yen for fiscal 2025 across all industries, which signals caution in new land activity. Construction buyers focus on replacement discipline and machine efficiency instead of aggressive fleet additions.
- Urban renewal work favors compact machines with lower site disruption and easier transport.
- Aging infrastructure repair can maintain demand for small excavators and compact loaders.
- Buyers in Japan place higher weight on machine reliability and service record clarity.
Compact Construction Equipment Market Analysis By Company
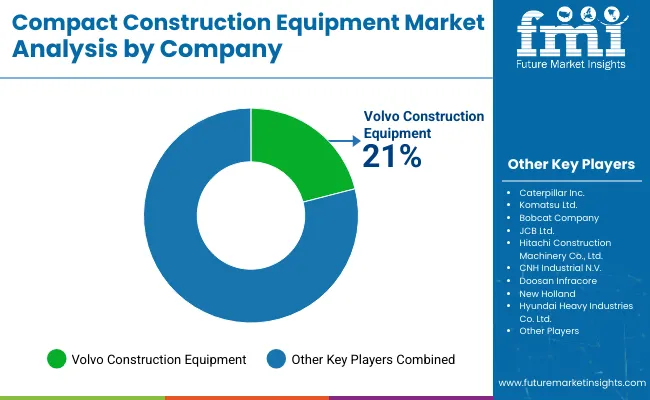
- Caterpillar Inc. leads through broad compact equipment coverage and strong dealer access across major construction regions.
- Komatsu Ltd. and Volvo Construction Equipment differentiate themselves based on excavator depth capabilities and reliable machine performance across fleet applications.
- Specialist providers focus on compact loaders and small excavators, offering machine formats suited to rental fleet use.
Competition in compact construction equipment centers on product depth and dealer coverage across contractor and rental accounts. Caterpillar Inc. holds strong positioning through broad construction equipment coverage and global dealer reach. Komatsu Ltd. adds excavator depth and electric compact equipment development across Europe and Asia. Bobcat Company focuses on skid steer and compact loader specialization. JCB Ltd. adds strength through mini excavators and electric micro excavator options. Kubota Corporation holds a strong position in mini excavators and landscaping related compact equipment.
Competitive barriers include dealer service depth and parts availability across high-use rental fleets. Strategic priorities focus on attachment compatibility and faster service response during peak project periods. Buyers favor suppliers offering machine uptime and clear ownership cost across project cycles. Companies with broad compact equipment menus and dependable local service are best placed to win contractor and rental fleet orders.
Key Companies in the Compact Construction Equipment Market
Key global companies leading the compact construction equipment market include:
- Caterpillar Inc., Komatsu Ltd., and Volvo Construction Equipment have strong compact equipment infrastructure for construction and rental demand.
- Bobcat Company, JCB Ltd., and Kubota Corporation serve contractors through compact loaders, mini excavators, and jobsite-ready machine designs.
- Hitachi Construction Machinery Co. Ltd., CNH Industrial N.V., HD Hyundai Infracore and HD Hyundai Construction Equipment are treated as HD Hyundai portfolio entities with specialist positions across excavators, loaders, and regional equipment channels.
Competitive Benchmarking: Compact Construction Equipment Market
| Company | Geographic Footprint | Compact Product Breadth | Dealer Service Depth | Attachment Readiness |
|---|---|---|---|---|
| Caterpillar Inc. | Global | High | Strong | Strong |
| Komatsu Ltd. | Global | High | Strong | High |
| Volvo Construction Equipment | Global | High | Strong | High |
| Bobcat Company | North America and Europe-led Global Presence | High | Strong | Strong |
| JCB Ltd. | Global with Strong Europe and India Presence | High | Strong | High |
| Hitachi Construction Machinery Co. Ltd. | Strong Asia and Global Presence | High | Strong | Medium |
| CNH Industrial N.V. | Europe and North America-led Global Presence | Medium | Strong | Medium |
| HD Hyundai Infracore / HD Hyundai Construction Equipment | Asia-led Global Presence | Medium | Moderate | Medium |
| Kubota Corporation | Strong Asia, North America, and Europe Presence | High | Strong | Medium |
Source: Future Market Insights, 2026.
Key Developments in Compact Construction Equipment Market
- March 2026, Bobcat Company introduced the next evolution of its compact loader line-up at CONEXPO 2026. The new line-up includes Classic and Pro categories with operator-ready technology across compact loaders.
- February 2025, JCB announced the 8008E CTS electric micro excavator for the Executive Hire Show. The 1.0-tonne machine joined the JCB E-TECH range and shares its structure with the diesel 8008 CTS.
Key Players in the Compact Construction Equipment Market
Major Global Players:
- Caterpillar Inc.
- Komatsu Ltd.
- Volvo Construction Equipment
- Hitachi Construction Machinery Co. Ltd.
- CNH Industrial N.V.
Specialist Players:
- Bobcat Company
- JCB Ltd.
- Kubota Corporation
Regional Portfolio Players:
- HD Hyundai Infracore / HD Hyundai Construction Equipment
Report Scope and Coverage
| Parameter | Details |
|---|---|
| Quantitative Units | USD 36.7 billion to USD 49.8 billion, at a CAGR of 3.1% |
| Market Definition | Compact construction equipment includes small earthmoving and jobsite machines used for excavation, loading, material handling, and lifting work. |
| Regions Covered | North America, Latin America, Western Europe, Eastern Europe, East Asia, South Asia and Pacific, Middle East and Africa |
| Countries Covered | USA, UK, Germany, China, India, Brazil, Japan, and 30 plus countries |
| Key Companies Profiled | Caterpillar Inc., Komatsu Ltd., Volvo Construction Equipment, Bobcat Company, JCB Ltd., Hitachi Construction Machinery Co. Ltd., CNH Industrial N.V., HD Hyundai Infracore / HD Hyundai Construction Equipment, Kubota Corporation |
| Forecast Period | 2026 to 2036 |
| Approach | Hybrid bottom-up and top-down methodology starting with machine demand and verified construction use patterns. |
Compact Construction Equipment Market by Segments
Compact Construction Equipment Market Segmented by Product Type:
- Track Loaders
- Mini Excavators
- Skid Steers
- Compact Wheel Loaders
- Backhoe Loaders
- Telehandlers
- Others
Compact Construction Equipment Market Segmented by Power Output:
- <100 HP
- 101-200 HP
- 201-400 HP
- >400 HP
Compact Construction Equipment Market Segmented by Application:
- Excavation
- Loading
- Materials Handling
- Lifting and Hoisting
- Other Applications
Compact Construction Equipment Market Segmented by Operating Weight:
- Below 5 Ton Equipment
- 5 to 8 Ton Equipment
- Above 8 Ton Compact Equipment
Compact Construction Equipment Market Segmented by Power Source:
- Diesel Powered Equipment
- Electric Powered Equipment
- Hybrid Equipment
Compact Construction Equipment Market by Region:
- North America
- USA
- Canada
- Mexico
- Latin America
- Brazil
- Chile
- Rest of Latin America
- Europe
- Germany
- UK
- Italy
- Spain
- France
- Rest of Europe
- East Asia
- China
- Japan
- South Korea
- South Asia and Pacific
- India
- ASEAN
- Australia & New Zealand
- Rest of South Asia and Pacific
- Middle East and Africa
- Saudi Arabia
- Other GCC Countries
- South Africa
- Rest of Middle East and Africa
Research Sources and Bibliography
- USA Census Bureau. (2026, March 23). Monthly construction spending, January 2026 (Release No. CB26-51). USA Department of Commerce.
- Equipment Leasing & Finance Association. (2026, April 28). Q1 new equipment demand at record high.
- Bobcat Company. (2026, March). Bobcat Company unveils its next evolution of compact loaders designed to empower operators.
- Brazilian Institute of Geography and Statistics. (2026, February). National Index of Civil Construction increases by 1.54% in January
- JCB. (2025, February). Electric JCB micro to make mighty impact at EHS.
- Komatsu Europe. (2025, April). Komatsu presents three new electric mini excavators in live demo at bauma 2025.
- Ministry of Land, Infrastructure, Transport and Tourism. (2025, September). Fiscal Year 2024 Trends Concerning Land. Government of Japan.
- Office for National Statistics. (2026, April). Construction output in Great Britain: February 2026.
- Press Information Bureau. (2026, February). Union Budget FY 2026-27: Strengthening Capital Goods Sector. Government of India.
- Press Information Bureau. (2026, March). Infrastructure Financing in India: Trends, Institutions, and Instruments. Government of India.
- German Federal Statistical Office. (2026, April). Production in February 2026: -0.3% on the previous month.
- German Federal Statistical Office. (2026, May). New orders in manufacturing in March 2026: +5.0% on the previous month.
This Report Answers
- What is the current and future size of the compact construction equipment market?
- How fast is the compact construction equipment market expected to expand between 2026 and 2036?
- Which product type is expected to lead the market by 2026?
- Which power output segment is expected to account for the highest demand by 2026?
- What factors are driving demand for compact construction equipment globally?
- How are rental fleet needs influencing adoption of compact equipment?
- Why are mini excavators the main product base for compact equipment demand?
- How are electric compact machines creating demand for specialized service readiness?
- Which countries are projected to record faster expansion through 2036?
- What is driving market expansion in China and India?
- Who are the key companies active in the compact construction equipment market?
- How does FMI estimate and validate the market forecast?
Frequently Asked Questions
What is the global market demand for Compact Construction Equipment in 2026?
In 2026, the global market for compact construction equipment is expected to be worth USD 36.7 billion.
How big will the market for Compact Construction Equipment be in 2036?
By 2036, the market for compact construction equipment is expected to be worth USD 49.8 billion.
How much is demand for Compact Construction Equipment expected to expand between 2026 and 2036?
Between 2026 and 2036, demand for compact construction equipment is expected to expand at a CAGR of 3.1%.
Which product type segment is likely to be the best seller globally by 2026?
Mini Excavators will make up 38.0% of the product type segment in 2026.
What is causing demand to rise in China?
The China compact construction equipment market is projected to record 4.0% CAGR through 2036, backed by urban repair and public housing work.
What is causing demand to rise in India?
The India compact construction equipment market is projected to expand at 3.7% CAGR through 2036, backed by infrastructure spending and local equipment manufacturing.
What does this report mean by Compact Construction Equipment Market definition?
The compact construction equipment market includes small jobsite machines used for excavation, loading, material handling, and lifting work.
How does FMI make the Compact Construction Equipment forecast and check it?
Forecasting models use a hybrid bottom-up and top-down approach, starting with machine demand and checking it against construction use patterns.
Preview the report firsthand - request a free sample
Get SampleGet the brochure for pricing and purchase details.
Get PDFTable of Content
- Executive Summary
- Global Market Outlook
- Demand-side Trends
- Supply-side Trends
- Technology Roadmap Analysis
- Analysis and Recommendations
- Market Overview
- Market Coverage / Taxonomy
- Market Definition / Scope / Limitations
- Research Methodology
- Chapter Orientation
- Analytical Lens and Working Hypotheses
- Market Structure, Signals, and Trend Drivers
- Benchmarking and Cross-market Comparability
- Market Sizing, Forecasting, and Opportunity Mapping
- Research Design and Evidence Framework
- Desk Research Programme (Secondary Evidence)
- Company Annual and Sustainability Reports
- Peer-reviewed Journals and Academic Literature
- Corporate Websites, Product Literature, and Technical Notes
- Earnings Decks and Investor Briefings
- Statutory Filings and Regulatory Disclosures
- Technical White Papers and Standards Notes
- Trade Journals, Industry Magazines, and Analyst Briefs
- Conference Proceedings, Webinars, and Seminar Materials
- Government Statistics Portals and Public Data Releases
- Press Releases and Reputable Media Coverage
- Specialist Newsletters and Curated Briefings
- Sector Databases and Reference Repositories
- FMI Internal Proprietary Databases and Historical Market Datasets
- Subscription Datasets and Paid Sources
- Social Channels, Communities, and Digital Listening Inputs
- Additional Desk Sources
- Expert Input and Fieldwork (Primary Evidence)
- Primary Modes
- Qualitative Interviews and Expert Elicitation
- Quantitative Surveys and Structured Data Capture
- Blended Approach
- Why Primary Evidence is Used
- Field Techniques
- Interviews
- Surveys
- Focus Groups
- Observational and In-context Research
- Social and Community Interactions
- Stakeholder Universe Engaged
- C-suite Leaders
- Board Members
- Presidents and Vice Presidents
- R&D and Innovation Heads
- Technical Specialists
- Domain Subject-matter Experts
- Scientists
- Physicians and Other Healthcare Professionals
- Governance, Ethics, and Data Stewardship
- Research Ethics
- Data Integrity and Handling
- Primary Modes
- Tooling, Models, and Reference Databases
- Desk Research Programme (Secondary Evidence)
- Data Engineering and Model Build
- Data Acquisition and Ingestion
- Cleaning, Normalisation, and Verification
- Synthesis, Triangulation, and Analysis
- Quality Assurance and Audit Trail
- Market Background
- Market Dynamics
- Drivers
- Restraints
- Opportunity
- Trends
- Scenario Forecast
- Demand in Optimistic Scenario
- Demand in Likely Scenario
- Demand in Conservative Scenario
- Opportunity Map Analysis
- Product Life Cycle Analysis
- Supply Chain Analysis
- Investment Feasibility Matrix
- Value Chain Analysis
- PESTLE and Porter’s Analysis
- Regulatory Landscape
- Regional Parent Market Outlook
- Production and Consumption Statistics
- Import and Export Statistics
- Market Dynamics
- Global Market Analysis 2021 to 2025 and Forecast, 2026 to 2036
- Historical Market Size Value (USD Billion) Analysis, 2021 to 2025
- Current and Future Market Size Value (USD Billion) Projections, 2026 to 2036
- Y-o-Y Growth Trend Analysis
- Absolute $ Opportunity Analysis
- Global Market Pricing Analysis 2021 to 2025 and Forecast 2026 to 2036
- Global Market Analysis 2021 to 2025 and Forecast 2026 to 2036, By Product Type
- Introduction / Key Findings
- Historical Market Size Value (USD Billion) Analysis By Product Type , 2021 to 2025
- Current and Future Market Size Value (USD Billion) Analysis and Forecast By Product Type , 2026 to 2036
- Mini Excavators
- Skid Steers
- Compact Wheel Loaders
- Mini Excavators
- Y-o-Y Growth Trend Analysis By Product Type , 2021 to 2025
- Absolute $ Opportunity Analysis By Product Type , 2026 to 2036
- Global Market Analysis 2021 to 2025 and Forecast 2026 to 2036, By Power Output
- Introduction / Key Findings
- Historical Market Size Value (USD Billion) Analysis By Power Output, 2021 to 2025
- Current and Future Market Size Value (USD Billion) Analysis and Forecast By Power Output, 2026 to 2036
- <100 HP
- 101-200 HP
- 201-400 HP
- <100 HP
- Y-o-Y Growth Trend Analysis By Power Output, 2021 to 2025
- Absolute $ Opportunity Analysis By Power Output, 2026 to 2036
- Global Market Analysis 2021 to 2025 and Forecast 2026 to 2036, By Application
- Introduction / Key Findings
- Historical Market Size Value (USD Billion) Analysis By Application, 2021 to 2025
- Current and Future Market Size Value (USD Billion) Analysis and Forecast By Application, 2026 to 2036
- Excavation
- Loading
- Materials Handling
- Excavation
- Y-o-Y Growth Trend Analysis By Application, 2021 to 2025
- Absolute $ Opportunity Analysis By Application, 2026 to 2036
- Global Market Analysis 2021 to 2025 and Forecast 2026 to 2036, By Operating Weight
- Introduction / Key Findings
- Historical Market Size Value (USD Billion) Analysis By Operating Weight, 2021 to 2025
- Current and Future Market Size Value (USD Billion) Analysis and Forecast By Operating Weight, 2026 to 2036
- Below 5 Ton Equipment
- 5 to 8 Ton Equipment
- Above 8 Ton Compact Equipment
- Below 5 Ton Equipment
- Y-o-Y Growth Trend Analysis By Operating Weight, 2021 to 2025
- Absolute $ Opportunity Analysis By Operating Weight, 2026 to 2036
- Global Market Analysis 2021 to 2025 and Forecast 2026 to 2036, By Power Source
- Introduction / Key Findings
- Historical Market Size Value (USD Billion) Analysis By Power Source, 2021 to 2025
- Current and Future Market Size Value (USD Billion) Analysis and Forecast By Power Source, 2026 to 2036
- Diesel-Powered Equipment
- Electric Powered Equipment
- Hybrid Equipment
- Diesel-Powered Equipment
- Y-o-Y Growth Trend Analysis By Power Source, 2021 to 2025
- Absolute $ Opportunity Analysis By Power Source, 2026 to 2036
- Global Market Analysis 2021 to 2025 and Forecast 2026 to 2036, By Region
- Introduction
- Historical Market Size Value (USD Billion) Analysis By Region, 2021 to 2025
- Current Market Size Value (USD Billion) Analysis and Forecast By Region, 2026 to 2036
- North America
- Latin America
- Western Europe
- Eastern Europe
- East Asia
- South Asia and Pacific
- Middle East & Africa
- Market Attractiveness Analysis By Region
- North America Market Analysis 2021 to 2025 and Forecast 2026 to 2036, By Country
- Historical Market Size Value (USD Billion) Trend Analysis By Market Taxonomy, 2021 to 2025
- Market Size Value (USD Billion) Forecast By Market Taxonomy, 2026 to 2036
- By Country
- USA
- Canada
- Mexico
- By Product Type
- By Power Output
- By Application
- By Operating Weight
- By Power Source
- By Country
- Market Attractiveness Analysis
- By Country
- By Product Type
- By Power Output
- By Application
- By Operating Weight
- By Power Source
- Key Takeaways
- Latin America Market Analysis 2021 to 2025 and Forecast 2026 to 2036, By Country
- Historical Market Size Value (USD Billion) Trend Analysis By Market Taxonomy, 2021 to 2025
- Market Size Value (USD Billion) Forecast By Market Taxonomy, 2026 to 2036
- By Country
- Brazil
- Chile
- Rest of Latin America
- By Product Type
- By Power Output
- By Application
- By Operating Weight
- By Power Source
- By Country
- Market Attractiveness Analysis
- By Country
- By Product Type
- By Power Output
- By Application
- By Operating Weight
- By Power Source
- Key Takeaways
- Western Europe Market Analysis 2021 to 2025 and Forecast 2026 to 2036, By Country
- Historical Market Size Value (USD Billion) Trend Analysis By Market Taxonomy, 2021 to 2025
- Market Size Value (USD Billion) Forecast By Market Taxonomy, 2026 to 2036
- By Country
- Germany
- UK
- Italy
- Spain
- France
- Nordic
- BENELUX
- Rest of Western Europe
- By Product Type
- By Power Output
- By Application
- By Operating Weight
- By Power Source
- By Country
- Market Attractiveness Analysis
- By Country
- By Product Type
- By Power Output
- By Application
- By Operating Weight
- By Power Source
- Key Takeaways
- Eastern Europe Market Analysis 2021 to 2025 and Forecast 2026 to 2036, By Country
- Historical Market Size Value (USD Billion) Trend Analysis By Market Taxonomy, 2021 to 2025
- Market Size Value (USD Billion) Forecast By Market Taxonomy, 2026 to 2036
- By Country
- Russia
- Poland
- Hungary
- Balkan & Baltic
- Rest of Eastern Europe
- By Product Type
- By Power Output
- By Application
- By Operating Weight
- By Power Source
- By Country
- Market Attractiveness Analysis
- By Country
- By Product Type
- By Power Output
- By Application
- By Operating Weight
- By Power Source
- Key Takeaways
- East Asia Market Analysis 2021 to 2025 and Forecast 2026 to 2036, By Country
- Historical Market Size Value (USD Billion) Trend Analysis By Market Taxonomy, 2021 to 2025
- Market Size Value (USD Billion) Forecast By Market Taxonomy, 2026 to 2036
- By Country
- China
- Japan
- South Korea
- By Product Type
- By Power Output
- By Application
- By Operating Weight
- By Power Source
- By Country
- Market Attractiveness Analysis
- By Country
- By Product Type
- By Power Output
- By Application
- By Operating Weight
- By Power Source
- Key Takeaways
- South Asia and Pacific Market Analysis 2021 to 2025 and Forecast 2026 to 2036, By Country
- Historical Market Size Value (USD Billion) Trend Analysis By Market Taxonomy, 2021 to 2025
- Market Size Value (USD Billion) Forecast By Market Taxonomy, 2026 to 2036
- By Country
- India
- ASEAN
- Australia & New Zealand
- Rest of South Asia and Pacific
- By Product Type
- By Power Output
- By Application
- By Operating Weight
- By Power Source
- By Country
- Market Attractiveness Analysis
- By Country
- By Product Type
- By Power Output
- By Application
- By Operating Weight
- By Power Source
- Key Takeaways
- Middle East & Africa Market Analysis 2021 to 2025 and Forecast 2026 to 2036, By Country
- Historical Market Size Value (USD Billion) Trend Analysis By Market Taxonomy, 2021 to 2025
- Market Size Value (USD Billion) Forecast By Market Taxonomy, 2026 to 2036
- By Country
- Kingdom of Saudi Arabia
- Other GCC Countries
- Turkiye
- South Africa
- Other African Union
- Rest of Middle East & Africa
- By Product Type
- By Power Output
- By Application
- By Operating Weight
- By Power Source
- By Country
- Market Attractiveness Analysis
- By Country
- By Product Type
- By Power Output
- By Application
- By Operating Weight
- By Power Source
- Key Takeaways
- Key Countries Market Analysis
- USA
- Pricing Analysis
- Market Share Analysis, 2025
- By Product Type
- By Power Output
- By Application
- By Operating Weight
- By Power Source
- Canada
- Pricing Analysis
- Market Share Analysis, 2025
- By Product Type
- By Power Output
- By Application
- By Operating Weight
- By Power Source
- Mexico
- Pricing Analysis
- Market Share Analysis, 2025
- By Product Type
- By Power Output
- By Application
- By Operating Weight
- By Power Source
- Brazil
- Pricing Analysis
- Market Share Analysis, 2025
- By Product Type
- By Power Output
- By Application
- By Operating Weight
- By Power Source
- Chile
- Pricing Analysis
- Market Share Analysis, 2025
- By Product Type
- By Power Output
- By Application
- By Operating Weight
- By Power Source
- Germany
- Pricing Analysis
- Market Share Analysis, 2025
- By Product Type
- By Power Output
- By Application
- By Operating Weight
- By Power Source
- UK
- Pricing Analysis
- Market Share Analysis, 2025
- By Product Type
- By Power Output
- By Application
- By Operating Weight
- By Power Source
- Italy
- Pricing Analysis
- Market Share Analysis, 2025
- By Product Type
- By Power Output
- By Application
- By Operating Weight
- By Power Source
- Spain
- Pricing Analysis
- Market Share Analysis, 2025
- By Product Type
- By Power Output
- By Application
- By Operating Weight
- By Power Source
- France
- Pricing Analysis
- Market Share Analysis, 2025
- By Product Type
- By Power Output
- By Application
- By Operating Weight
- By Power Source
- India
- Pricing Analysis
- Market Share Analysis, 2025
- By Product Type
- By Power Output
- By Application
- By Operating Weight
- By Power Source
- ASEAN
- Pricing Analysis
- Market Share Analysis, 2025
- By Product Type
- By Power Output
- By Application
- By Operating Weight
- By Power Source
- Australia & New Zealand
- Pricing Analysis
- Market Share Analysis, 2025
- By Product Type
- By Power Output
- By Application
- By Operating Weight
- By Power Source
- China
- Pricing Analysis
- Market Share Analysis, 2025
- By Product Type
- By Power Output
- By Application
- By Operating Weight
- By Power Source
- Japan
- Pricing Analysis
- Market Share Analysis, 2025
- By Product Type
- By Power Output
- By Application
- By Operating Weight
- By Power Source
- South Korea
- Pricing Analysis
- Market Share Analysis, 2025
- By Product Type
- By Power Output
- By Application
- By Operating Weight
- By Power Source
- Russia
- Pricing Analysis
- Market Share Analysis, 2025
- By Product Type
- By Power Output
- By Application
- By Operating Weight
- By Power Source
- Poland
- Pricing Analysis
- Market Share Analysis, 2025
- By Product Type
- By Power Output
- By Application
- By Operating Weight
- By Power Source
- Hungary
- Pricing Analysis
- Market Share Analysis, 2025
- By Product Type
- By Power Output
- By Application
- By Operating Weight
- By Power Source
- Kingdom of Saudi Arabia
- Pricing Analysis
- Market Share Analysis, 2025
- By Product Type
- By Power Output
- By Application
- By Operating Weight
- By Power Source
- Turkiye
- Pricing Analysis
- Market Share Analysis, 2025
- By Product Type
- By Power Output
- By Application
- By Operating Weight
- By Power Source
- South Africa
- Pricing Analysis
- Market Share Analysis, 2025
- By Product Type
- By Power Output
- By Application
- By Operating Weight
- By Power Source
- USA
- Market Structure Analysis
- Competition Dashboard
- Competition Benchmarking
- Market Share Analysis of Top Players
- By Regional
- By Product Type
- By Power Output
- By Application
- By Operating Weight
- By Power Source
- Competition Analysis
- Competition Deep Dive
- Caterpillar Inc.
- Overview
- Product Portfolio
- Profitability by Market Segments (Product/Age /Sales Channel/Region)
- Sales Footprint
- Strategy Overview
- Marketing Strategy
- Product Strategy
- Channel Strategy
- Komatsu Ltd.
- Volvo Construction Equipment
- Hitachi Construction Machinery Co. Ltd.
- CNH Industrial N.V.
- Caterpillar Inc.
- Competition Deep Dive
- Assumptions & Acronyms Used


