

- Market Size (2026)
- USD 7.3 Bn
- Forecast (2036)
- USD 12.4 Bn
- CAGR (2026 to 2036)
- 5.5%
How big is Conveyor System Market in 2026?
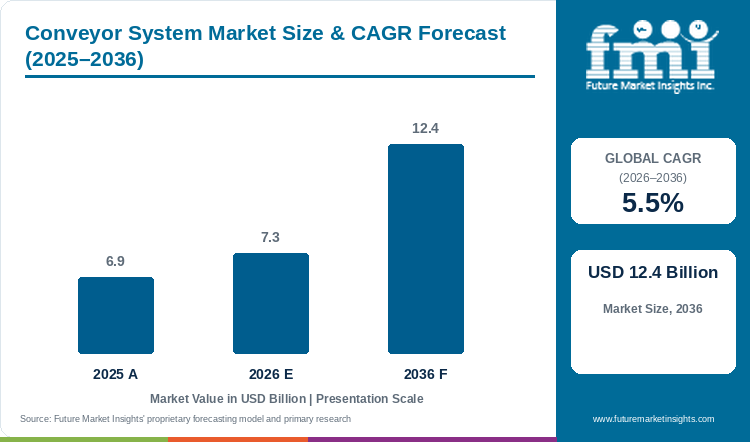
Demand is projected to expand at 5.5% CAGR from 2026 to 2036. Market value rises from USD 6.92 billion in 2025 to USD 7.3 billion in 2026 and USD 12.4 billion by 2036.
The global conveyor system market covers equipment moving goods and bulk materials through manufacturing, warehousing, distribution and other handling operations. Valued at USD 6.92 billion in 2025, it reaches USD 7.3 billion in 2026 and is projected to expand to USD 12.4 billion by 2036, at a CAGR of 5.5% from 2026 to 2036. Belt conveyors account for an estimated 28.0% of product-type demand in 2026. Manual systems represent 48.0% of the separate operation-type breakdown, reflecting the continuing interaction between conveying equipment and people loading, checking and redirecting material.
Demand comes from new handling sites, changes to existing flows and replacement of worn equipment. Retail fulfilment provides a significant operating context: the US Census Bureau estimated 2025 e-commerce sales at USD 1,233.7 billion. [1] Translating that activity into equipment requires coordinated receiving, scanning, sorting and dispatch capacity. India's September 2025 logistics-policy review highlights the wider development of digital integration around goods movement. [4]
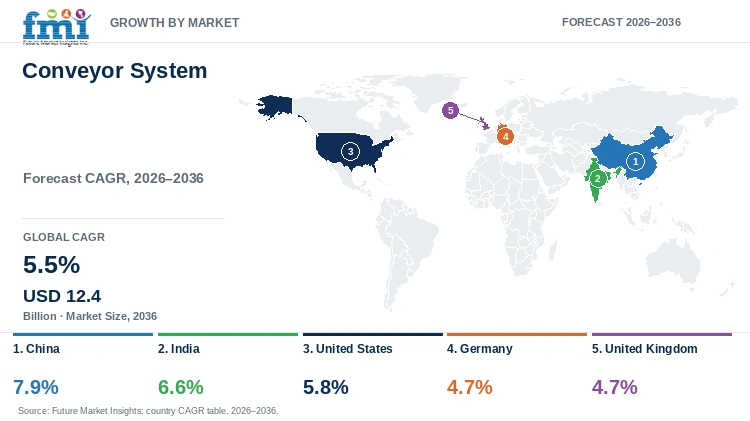
China leads the selected country forecasts at 7.9% CAGR for 2026 to 2036, followed by India at 6.6% and the United States at 5.8%. Germany and the United Kingdom each carry a 4.7% estimate over the same period. Distribution expansion and changes within manufacturing sites present different equipment requirements, with existing layouts, transfer points and connected controls determining the scope of each installation or retrofit.
Daifuku, Dematic, SSI Schaefer, Vanderlande and Honeywell Intelligrated are representative competitors in material handling, intralogistics, sortation and warehouse controls. Their differentiation depends on coordinating the physical line with the load mix, routing logic and connected information systems. Throughput at receiving and discharge points, maintenance access and continuing support influence the value of the installation. Suppliers able to adapt those interfaces as an operation changes have opportunities for repeat work alongside new-system orders.
Key Market Trends & Insights
- Retail fulfilment creates handling requirements, but online sales value must be distinguished from parcel counts and conveyor orders. [1]
- Logistics digital integration can change the information needed around a physical handling line, illustrated by India's September 2025 policy review. [4]
Regional Highlights
- China and India have the highest selected country growth profiles, at 7.9% and 6.6% for 2026 to 2036.
- The United States profile is 5.8%; Germany and the United Kingdom are each 4.7% for the same period.
Market Size & Forecast
Table 1: Market Size and Forecast for Conveyor System Market (USD billion and percentage), 2025 to 2036
| Metric | Value |
|---|---|
| 2025 market value | USD 6.92 billion |
| 2026 market value | USD 7.3 billion |
| 2036 market value | USD 12.4 billion |
| CAGR 2026 to 2036 | 5.5% |
| Revenue increase 2026 to 2036 | USD 5.1 billion |
| Market expansion 2026 to 2036 | 1.70 times |
Equipment orders can come from new sites, changes to the flow within an existing operation or replacement of worn components. These channels need different scopes. A new line can be designed around the intended load and routing, whereas a retrofit has to connect with installed equipment and the work performed beside it. Buyers consequently need the transfer points and system responsibilities established before comparing belt speed or nominal capacity. The commercial opportunity follows the site's complete handling requirement, not the length of conveyor supplied alone.
The Asean Conveyor System Market provides related geographic coverage, where the site's handling flow and operating conditions still determine the equipment specification.
Throughput is a property of the handling process, not one conveyor section
A fast conveyor can still feed a bottleneck if the next operation cannot accept the load. Receiving, scanning, sorting and dispatch therefore need a coordinated view of the intended flow. Retail and logistics statistics provide context for these operations, but the equipment specification needs site-level information on load mix and peak activity.
Table 2: Industry evidence relevant to the conveyor system market
| Indicator | Data point or observation | Market relevance | Source |
|---|---|---|---|
| US retail fulfilment context | The Census release of 10 March 2026 estimated 2025 e-commerce sales at USD 1,233.7 billion. | Retail activity provides context for goods handling; sales value is not equipment demand. | [1] |
Analyst Perspective
“A conveyor proposal is strongest when it connects the load profile with transfer points, controls and the people working around the line. Buyers need the complete flow assessed before committing to nominal throughput, because an unresolved downstream or access constraint can limit the value of extra conveyor capacity.”
- Nikhil Kaitwade, Future Market Insights
The same operating assumptions need to cover equipment, scanning or routing interfaces and the maintenance tasks required after handover.
How is the Conveyor System Market segmented?
The market is segmented by Product Type, Operation Type, Capacity Type, Application Type, End Use, and Region.
Product type describes the conveying construction, operation type describes the level or arrangement of operation, and capacity and application categories describe further customer requirements. A belt conveyor can be part of a manual or more automated process, and unit handling can serve several end users. The two charts retain the 2026 reference year. The source taxonomy also places fixed and portable arrangements within its operation-type list; those labels are retained as coverage categories rather than treated as additional automation levels. A site specification still needs the exact load, route and operating tasks defined.
Why do belt conveyors lead the product-type comparison?
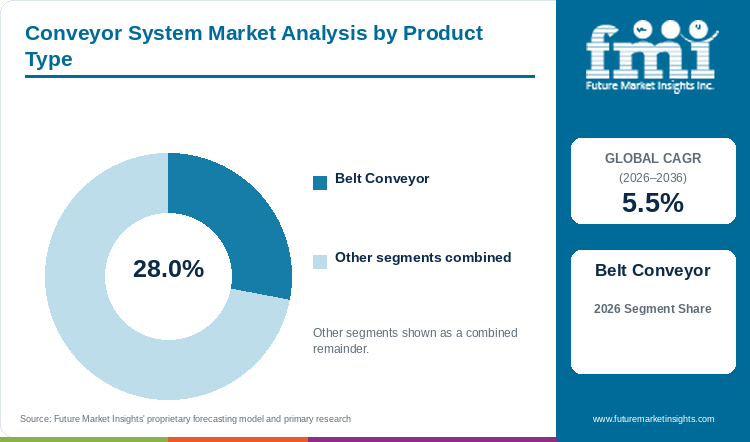
Table 3: Product Type Share for Conveyor System Market (percentage share), 2026
| Product Type | Estimated share (2026) |
|---|---|
| Belt Conveyor | 28.0% |
| Other product types | 72.0% |
| Total | 100.0% |
Table 4: Segment Position and Market Growth for Conveyor System Market, 2026 to 2036
| Metric | Value |
|---|---|
| Global CAGR (2026 to 2036) | 5.5% |
| Profiled product type segment | Belt Conveyor |
Belt conveyors represent an estimated 28.0% of product-type demand in 2026. The equipment provides a moving surface whose construction and arrangement need to fit the load and operating environment. A purchaser therefore needs to establish the product dimensions, weight and transfer requirements before comparing alternatives. Maintenance access and the work performed around the line also affect its installed scope. For suppliers, the commercial task is to provide an arrangement that moves the intended material while accommodating the site's operating and service tasks. A belt speed or length figure alone does not describe how the complete line will perform at its receiving and discharge points.
The Belt Conveyor segment is estimated to account for 28.0% of product type demand in 2026.
- Belt conveyors represent an estimated 28.0% of product-type demand in 2026; other product types together represent 72.0%.
- Load characteristics, transfer points and access requirements determine the appropriate belt and installation arrangement.
What sustains the manual operation-type benchmark?
Table 5: Operation Type Share for Conveyor System Market (percentage share), 2026
| Operation Type | Estimated share (2026) |
|---|---|
| Manual | 48.0% |
| Other operation types | 52.0% |
| Total | 100.0% |
Manual systems account for an estimated 48.0% of the operation-type breakdown in 2026. The category highlights the continuing role of people within handling operations, even where conveying equipment moves goods between tasks. Buyers need to establish where an operator loads, checks, redirects or removes material and how those actions interact with the moving line. A change to automation can alter the work sequence and control requirements, so it needs an assessment of the complete process rather than a single equipment substitution. Maintenance and blockage-clearing tasks also remain relevant after installation. A supplier can make the proposal more useful by defining the operating interfaces and the scope of the controls and guarding included in the price, allowing the customer to compare a workable installation.
The Manual segment is estimated to account for 48.0% of operation type demand in 2026.
- Manual systems represent an estimated 48.0% of operation-type demand in 2026; other operation types together represent 52.0%.
- Operator tasks, controls and maintenance access belong in the process design alongside the conveying equipment.
- The Gravity Conveyor System Market covers a related construction whose operating arrangement and load requirements differ from powered conveying alternatives.
What are the drivers, restraints, and opportunities in the Conveyor System Market?
Goods handling and site changes support purchases; layout, integration and access constrain installation; coordinated flow, controls and service scope improve the commercial case.
Driver
Goods-handling activity supports demand when a site's existing flow needs additional capacity, new routing or replacement equipment. US retail statistics provide observed context for physical distribution, but they need to be connected to actual warehouse or production projects before becoming an equipment opportunity. [1] The required line depends on the load mix and the operations before and after each transfer. A supplier assessing demand can therefore distinguish new-site installation from a retrofit addressing a particular bottleneck. The latter may require controls or transfer changes in addition to the conveying section that initially appears to need attention.
Restraint
Adding equipment can require changes to the layout, controls and the tasks performed around the line. These dependencies affect capital cost and the time needed to put a retrofit into service. The owner needs appropriate safeguards and a workable operating arrangement, rather than compare only the equipment's nominal throughput. A proposed line may also have to fit an existing building and connected machinery. Those constraints can make a technically capable product unsuitable without further installation and integration work.
Opportunity
Suppliers can strengthen the purchasing case by connecting physical flow with the information and control interfaces needed by the site. India's September 2025 logistics review describes progress in digital integration across the wider logistics system. [4] For a conveyor project, the practical opportunity is more specific: the proposed line needs to exchange the right information with receiving, scanning, routing or dispatch operations. Service support is another opportunity where condition and operating records help the owner plan maintenance. A useful offer explains how those functions fit the load profile and installed equipment, with responsibilities stated clearly enough for the customer to compare complete alternatives.
The Modular Conveyor System Market provides related coverage of configurations that buyers assess against layout, load and service requirements.
Which country CAGRs are profiled in the Conveyor System Market?
Table 6: Country CAGR Comparison for Conveyor System Market (CAGR percentage), 2026 to 2036
| Country | CAGR |
|---|---|
| China | 7.9% |
| India | 6.6% |
| United States | 5.8% |
| Germany | 4.7% |
| United Kingdom | 4.7% |
Country-wise Analysis
China Conveyor System Market Outlook (2026 to 2036)
FMI's country equipment forecast is a CAGR of 7.9% for 2026 to 2036. A distribution-site buyer needs the intended flow and load mix translated into a layout that works at transfer and sorting points. Additional conveying speed cannot resolve every downstream constraint. Suppliers can therefore improve the offer by defining peak operating assumptions, connected controls and maintenance access together. This gives the customer a clearer basis for comparing a complete handling installation.
India Conveyor System Market Outlook (2026 to 2036)
India's September 2025 logistics-policy review describes digital integration and infrastructure-planning work across the logistics system. [4] It establishes a demand-side setting rather than a conveyor purchase total. The published FMI country growth estimate is 6.6% for 2026 to 2036. A warehouse or production customer still needs a site-specific requirement: the product flow, loading tasks and connected information systems determine the equipment configuration. Suppliers can make that requirement easier to assess by distinguishing the physical line from the controls and integration work around it. A retrofit also needs to fit the operating site and its available installation window. Those details decide whether the proposed handling improvement can be delivered without moving the bottleneck to another part of the process.
United States Conveyor System Market Outlook (2026 to 2036)
US e-commerce sales were estimated at USD 1,233.7 billion for 2025 in the Census release published in March 2026. [1] The measure describes retail value, not the quantity of packages or the number of distribution lines needed. Purchasers assessing fulfilment equipment need the actual product and peak-flow profile before choosing a line. Scanning, sortation and discharge requirements can affect the useful throughput more than the speed of a single conveyor section. A supplier's offer becomes clearer when it includes the connected controls, transfer arrangements and maintenance responsibilities, giving the owner a basis for comparing the complete handling process across alternative bids.
Germany Conveyor System Market Outlook (2026 to 2036)
A manufacturing conveyor has to work within a sequence of production and material-handling tasks, making interfaces central to the purchasing decision in Germany. A buyer replacing one section needs to establish whether the proposed equipment fits the existing load, transfers and controls. A new installation can coordinate those requirements earlier in the design. Both cases need service access and operator tasks understood before the layout is finalised. Suppliers can strengthen the comparison by stating the common operating assumptions and identifying any modifications required outside their own equipment package. The commercial opportunity follows the process the customer can improve, rather than the nominal capacity or length of the conveyor alone.
United Kingdom Conveyor System Market Outlook (2026 to 2036)
Equipment buyers need the work performed around a line included in the installation assessment, particularly when operators load, unwrap or clear material near moving parts. A supplier proposal is more useful when it identifies the controls, access arrangements and tasks included in the design. That allows the owner to compare the complete line and its operating responsibilities before awarding a replacement or expansion project.
Who are the notable companies in the Conveyor System Market?
Daifuku; Dematic; SSI Schaefer; Vanderlande; Honeywell Intelligrated
The market coverage includes Daifuku, Dematic, SSI Schaefer, Vanderlande and Honeywell Intelligrated among representative participants. Buyers need to establish whether an offer covers a conveying section or a broader handling and controls system. That distinction affects both price and the integration work left with the customer. The comparison below assesses representative product areas and the operating questions relevant to the purchaser. The proposed load profile, routing and service arrangement provide a common basis for evaluating the actual equipment package.
Competitive Benchmarking: Conveyor System Market
Table 7: Competitive positioning for the conveyor system market
| Company | Positioning | Buyer comparison focus |
|---|---|---|
| Daifuku | Material-handling systems | Assess the complete flow and the scope of connected material-handling equipment. |
| Dematic | Warehouse handling systems | Define the conveyor, routing controls and integration responsibilities in the offer. |
| SSI Schaefer | Intralogistics systems | Compare the proposed line against load mix, layout and operator tasks. |
| Vanderlande | Material-handling and sortation systems | Review transfer, sortation and discharge assumptions for the operating site. |
| Honeywell Intelligrated | Warehouse handling and controls | Clarify the boundary between physical conveying equipment and warehouse information or control systems. |
Key Developments in the Conveyor System Market
- The Census Bureau published its fourth-quarter and full-year 2025 e-commerce release in March 2026. [1]
- India's government reviewed logistics-policy implementation in September 2025. [4]
Key Players in the Conveyor System Market
Material-handling systems
- Daifuku
Warehouse handling systems
- Dematic
Intralogistics systems
- SSI Schaefer
Material-handling and sortation systems
- Vanderlande
Warehouse handling and controls
- Honeywell Intelligrated
Conveyor System Market Report Scope
Table 8: Report Scope for Conveyor System Market, 2026 to 2036
| Coverage field | Report scope |
|---|---|
| Market definition | Conveyor systems used for movement and transfer of goods or bulk material across the covered applications. |
| Units | USD billion; percentage |
| Market reference | USD 6.92 billion in 2025 |
| Forecast period | 2026 to 2036 |
| Charted shares | Belt conveyor product type and manual operation type, 2026. |
| Country profiles | China; India; United States; Germany; United Kingdom. |
| Representative companies | Daifuku; Dematic; SSI Schaefer; Vanderlande; Honeywell Intelligrated |
Conveyor System Market Research Methodology
Table 9: Research Methodology for Conveyor System Market, 2026 edition
| Method | Approach |
|---|---|
| Market forecast | Published FMI 2025, 2026 and 2036 values and 5.5% CAGR. |
| Segment comparisons | Product type and operation type retain their separate 2026 share benchmarks. |
| Taxonomy | Product, operation, capacity, application and end use retain the report coverage labels. |
| Country periods | Five published country profiles retain the 2026 to 2036 period. |
| Demand context | US retail data and Indian logistics-policy material inform distribution analysis. |
Conveyor System Market by Segments
Conveyor System Market segmented by Product Type:
- Belt Conveyor
- Roller Conveyor
- Pallet Conveyor
- Overhead Conveyor
- Skid Conveyor
- Trailer Conveyor
- Others
Conveyor System Market segmented by Operation Type:
- Manual
- Semi-Automatic
- Automatic
- Fixed Conveyor Systems
- Portable Conveyor Systems
Conveyor System Market segmented by Capacity Type:
- Unit Handling
- Bulk Handling
- Light Duty Systems
- Medium Duty Systems
- Heavy Duty Systems
Conveyor System Market segmented by Application Type:
- Packaging and Warehouse Distribution
- Order Fulfillment
- E-commerce Sorting
- Pallet Handling
- Return Logistics
- Airports
- Mining Sites
- Retail and Postal Centers
Conveyor System Market segmented by End Use:
- Manufacturing Plants
- Automotive Plants
- Electronics Plants
- FMCG Plants
- Warehouses
- 3PL Warehouses
- Food and Beverage Plants
- Airports
- Chemical and Pharmaceutical Sites
- Retail and Postal Centers
Conveyor System Market by Region
- North America
- United States
- Canada
- Mexico
- Latin America
- Brazil
- Argentina
- Western Europe
- Germany
- Italy
- France
- United Kingdom
- Spain
- BENELUX
- Nordic countries
- Eastern Europe
- Poland
- Hungary
- Romania
- Czech Republic
- East Asia
- China
- Japan
- South Korea
- South Asia and Pacific
- India
- ASEAN
- Australia
- New Zealand
- Middle East and Africa
- Saudi Arabia
- United Arab Emirates
- Turkiye
- Israel
Research Sources and Bibliography
- [1] US Census Bureau. 10 March 2026; 2025 reporting period. Quarterly Retail E-Commerce Sales — 4th Quarter 2025
- [4] Ministry of Commerce and Industry / Press Information Bureau. 16 September 2025. India Marks Three Years of National Logistics Policy: Transforming India's Supply Chain Ecosystem
This Report Answers
- How big is the conveyor system market in 2026?
- What is the 2036 market forecast?
- Which product type leads the benchmark?
- Which operation type leads the comparison?
- Which selected country has the highest growth estimate?
- Does faster conveying always increase site throughput?
Frequently Asked Questions
What is the estimated market size in 2026?
FMI estimates USD 7.30 billion in 2026, compared with USD 6.92 billion in 2025.
What is the 2036 market forecast?
FMI projects USD 12.40 billion in 2036, with 5.5% CAGR from 2026 to 2036.
Which product type leads the benchmark?
Belt conveyors represent an estimated 28.0% of product-type demand in 2026.
Which operation type leads the comparison?
Manual systems represent an estimated 48.0% of operation-type demand in 2026.
Which selected country has the highest growth estimate?
China has the highest selected rate, at 7.9% for 2026 to 2036.
Does faster conveying always increase site throughput?
The flow also depends on receiving, transfer, sorting and discharge operations, so a single section's speed is not the complete process measure.
Preview the report firsthand - request a free sample
Get SampleGet the brochure for pricing and purchase details.
Get PDFTable of Content
- Key Takeaways
- Market Size and CAGR
- Top Growth Driver
- Fastest Growing Segment
- Leading Region
- Key Companies
- Emerging Opportunities
- Executive Summary
- Global Market Outlook
- Demand-side Trends
- Supply-side Trends
- Technology Roadmap Analysis
- Analysis and Recommendations
- Analyst Perspective (What is happening? Why now? What should investors know?)
- Key Questions Answered
- How large is the market?
- What is the CAGR?
- What are key trends?
- Which region dominates?
- Who are the leaders?
- Market Overview
- Market Coverage / Taxonomy
- Market Definition / Scope / Limitations
- Research Methodology
- Chapter Orientation
- Analytical Lens and Working Hypotheses
- Market Structure, Signals, and Trend Drivers
- Benchmarking and Cross-market Comparability
- Market Sizing, Forecasting, and Opportunity Mapping
- Research Design and Evidence Framework
- Desk Research Programme (Secondary Evidence)
- Expert Input and Fieldwork (Primary Evidence)
- Tooling, Models, and Reference Databases
- Data Engineering and Model Build
- Quality Assurance and Audit Trail
- Market Background
- Market Dynamics (Drivers, Restraints, Opportunity, Trends)
- Scenario Forecast (Optimistic, Likely, Conservative)
- Impact Analysis
- AI Impact
- Sustainability Impact
- Regulatory Impact
- Technology Impact
- Consumer / Buyer Analysis
- Purchase Drivers
- Adoption Barriers
- Buyer Journey
- Opportunity Map Analysis
- Product Life Cycle Analysis
- Supply Chain Analysis
- Investment Feasibility Matrix
- Value Chain Analysis
- PESTLE and Porter's Analysis
- Regulatory Landscape
- Regional Parent Market Outlook
- Production and Consumption Statistics
- Import and Export Statistics
- Global Market Analysis and Forecast, 2021 to 2036
- Historical Market Size Value (USD Billion) Analysis, 2021 to 2025
- Current and Future Market Size Value (USD Billion) Projections, 2026 to 2036
- Y-o-Y Growth Trend Analysis
- Absolute $ Opportunity Analysis
- Global Market Pricing Analysis, 2021 to 2036
- Global Market Analysis and Forecast, By Product Type, 2021 to 2036
- Introduction / Key Findings
- Historical Market Size Value (USD Billion) Analysis By Product Type, 2021 to 2025
- Current and Future Market Size Value (USD Billion) Analysis and Forecast By Product Type, 2026 to 2036
- Belt Conveyor
- Roller Conveyor
- Pallet Conveyor
- Overhead Conveyor
- Skid Conveyor
- Trailer Conveyor
- Others
- Y-o-Y Growth Trend Analysis By Product Type, 2021 to 2025
- Absolute $ Opportunity Analysis By Product Type, 2026 to 2036
- Global Market Analysis and Forecast, By Operation Type, 2021 to 2036
- Introduction / Key Findings
- Historical Market Size Value (USD Billion) Analysis By Operation Type, 2021 to 2025
- Current and Future Market Size Value (USD Billion) Analysis and Forecast By Operation Type, 2026 to 2036
- Manual
- Semi-Automatic
- Automatic
- Fixed Conveyor Systems
- Portable Conveyor Systems
- Y-o-Y Growth Trend Analysis By Operation Type, 2021 to 2025
- Absolute $ Opportunity Analysis By Operation Type, 2026 to 2036
- Global Market Analysis and Forecast, By Capacity Type, 2021 to 2036
- Introduction / Key Findings
- Historical Market Size Value (USD Billion) Analysis By Capacity Type, 2021 to 2025
- Current and Future Market Size Value (USD Billion) Analysis and Forecast By Capacity Type, 2026 to 2036
- Unit Handling
- Bulk Handling
- Light Duty Systems
- Medium Duty Systems
- Heavy Duty Systems
- Y-o-Y Growth Trend Analysis By Capacity Type, 2021 to 2025
- Absolute $ Opportunity Analysis By Capacity Type, 2026 to 2036
- Global Market Analysis and Forecast, By Application Type, 2021 to 2036
- Introduction / Key Findings
- Historical Market Size Value (USD Billion) Analysis By Application Type, 2021 to 2025
- Current and Future Market Size Value (USD Billion) Analysis and Forecast By Application Type, 2026 to 2036
- Packaging and Warehouse Distribution
- Order Fulfillment
- E-commerce Sorting
- Pallet Handling
- Return Logistics
- Airports
- Mining Sites
- Retail and Postal Centers
- Y-o-Y Growth Trend Analysis By Application Type, 2021 to 2025
- Absolute $ Opportunity Analysis By Application Type, 2026 to 2036
- Global Market Analysis and Forecast, By End Use, 2021 to 2036
- Introduction / Key Findings
- Historical Market Size Value (USD Billion) Analysis By End Use, 2021 to 2025
- Current and Future Market Size Value (USD Billion) Analysis and Forecast By End Use, 2026 to 2036
- Manufacturing Plants
- Automotive Plants
- Electronics Plants
- FMCG Plants
- Warehouses
- 3PL Warehouses
- Food and Beverage Plants
- Airports
- Chemical and Pharmaceutical Sites
- Retail and Postal Centers
- Y-o-Y Growth Trend Analysis By End Use, 2021 to 2025
- Absolute $ Opportunity Analysis By End Use, 2026 to 2036
- Global Market Analysis and Forecast, By Region, 2021 to 2036
- Introduction
- Historical Market Size Value (USD Billion) Analysis By Region, 2021 to 2025
- Current Market Size Value (USD Billion) Analysis and Forecast By Region, 2026 to 2036
- North America
- Latin America
- Western Europe
- Eastern Europe
- East Asia
- South Asia and Pacific
- Middle East and Africa
- Market Attractiveness Analysis By Region
- North America Market Analysis and Forecast, By Country, 2021 to 2036
- Historical Market Size Value (USD Billion) Trend Analysis By Market Taxonomy, 2021 to 2025
- Market Size Value (USD Billion) Forecast By Market Taxonomy, 2026 to 2036
- By Country
- United States
- Canada
- Mexico
- By Product Type
- By Operation Type
- By Capacity Type
- By Application Type
- By End Use
- By Country
- Market Attractiveness Analysis
- By Country
- By Product Type
- By Operation Type
- By Capacity Type
- By Application Type
- By End Use
- Key Takeaways
- Latin America Market Analysis and Forecast, By Country
- Historical Market Size Value (USD Billion) Trend Analysis By Market Taxonomy, 2021 to 2025
- Market Size Value (USD Billion) Forecast By Market Taxonomy, 2026 to 2036
- By Country
- Brazil
- Argentina
- By Product Type
- By Operation Type
- By Capacity Type
- By Application Type
- By End Use
- By Country
- Market Attractiveness Analysis
- By Country
- By Product Type
- By Operation Type
- By Capacity Type
- By Application Type
- By End Use
- Key Takeaways
- Western Europe Market Analysis and Forecast, By Country
- Historical Market Size Value (USD Billion) Trend Analysis By Market Taxonomy, 2021 to 2025
- Market Size Value (USD Billion) Forecast By Market Taxonomy, 2026 to 2036
- By Country
- Germany
- Italy
- France
- United Kingdom
- Spain
- BENELUX
- Nordic countries
- By Product Type
- By Operation Type
- By Capacity Type
- By Application Type
- By End Use
- By Country
- Market Attractiveness Analysis
- By Country
- By Product Type
- By Operation Type
- By Capacity Type
- By Application Type
- By End Use
- Key Takeaways
- Eastern Europe Market Analysis and Forecast, By Country
- Historical Market Size Value (USD Billion) Trend Analysis By Market Taxonomy, 2021 to 2025
- Market Size Value (USD Billion) Forecast By Market Taxonomy, 2026 to 2036
- By Country
- Poland
- Hungary
- Romania
- Czech Republic
- By Product Type
- By Operation Type
- By Capacity Type
- By Application Type
- By End Use
- By Country
- Market Attractiveness Analysis
- By Country
- By Product Type
- By Operation Type
- By Capacity Type
- By Application Type
- By End Use
- Key Takeaways
- East Asia Market Analysis and Forecast, By Country
- Historical Market Size Value (USD Billion) Trend Analysis By Market Taxonomy, 2021 to 2025
- Market Size Value (USD Billion) Forecast By Market Taxonomy, 2026 to 2036
- By Country
- China
- Japan
- South Korea
- By Product Type
- By Operation Type
- By Capacity Type
- By Application Type
- By End Use
- By Country
- Market Attractiveness Analysis
- By Country
- By Product Type
- By Operation Type
- By Capacity Type
- By Application Type
- By End Use
- Key Takeaways
- South Asia and Pacific Market Analysis and Forecast, By Country
- Historical Market Size Value (USD Billion) Trend Analysis By Market Taxonomy, 2021 to 2025
- Market Size Value (USD Billion) Forecast By Market Taxonomy, 2026 to 2036
- By Country
- India
- ASEAN
- Australia
- New Zealand
- By Product Type
- By Operation Type
- By Capacity Type
- By Application Type
- By End Use
- By Country
- Market Attractiveness Analysis
- By Country
- By Product Type
- By Operation Type
- By Capacity Type
- By Application Type
- By End Use
- Key Takeaways
- Middle East and Africa Market Analysis and Forecast, By Country
- Historical Market Size Value (USD Billion) Trend Analysis By Market Taxonomy, 2021 to 2025
- Market Size Value (USD Billion) Forecast By Market Taxonomy, 2026 to 2036
- By Country
- Saudi Arabia
- United Arab Emirates
- Turkiye
- Israel
- By Product Type
- By Operation Type
- By Capacity Type
- By Application Type
- By End Use
- By Country
- Market Attractiveness Analysis
- By Country
- By Product Type
- By Operation Type
- By Capacity Type
- By Application Type
- By End Use
- Key Takeaways
- Key Countries Market Analysis
- United States
- Pricing Analysis
- Market Share Analysis, 2025
- By Product Type
- By Operation Type
- By Capacity Type
- By Application Type
- By End Use
- Canada
- Pricing Analysis
- Market Share Analysis, 2025
- By Product Type
- By Operation Type
- By Capacity Type
- By Application Type
- By End Use
- Mexico
- Pricing Analysis
- Market Share Analysis, 2025
- By Product Type
- By Operation Type
- By Capacity Type
- By Application Type
- By End Use
- Brazil
- Pricing Analysis
- Market Share Analysis, 2025
- By Product Type
- By Operation Type
- By Capacity Type
- By Application Type
- By End Use
- Germany
- Pricing Analysis
- Market Share Analysis, 2025
- By Product Type
- By Operation Type
- By Capacity Type
- By Application Type
- By End Use
- United Kingdom
- Pricing Analysis
- Market Share Analysis, 2025
- By Product Type
- By Operation Type
- By Capacity Type
- By Application Type
- By End Use
- Italy
- Pricing Analysis
- Market Share Analysis, 2025
- By Product Type
- By Operation Type
- By Capacity Type
- By Application Type
- By End Use
- Spain
- Pricing Analysis
- Market Share Analysis, 2025
- By Product Type
- By Operation Type
- By Capacity Type
- By Application Type
- By End Use
- France
- Pricing Analysis
- Market Share Analysis, 2025
- By Product Type
- By Operation Type
- By Capacity Type
- By Application Type
- By End Use
- India
- Pricing Analysis
- Market Share Analysis, 2025
- By Product Type
- By Operation Type
- By Capacity Type
- By Application Type
- By End Use
- ASEAN
- Pricing Analysis
- Market Share Analysis, 2025
- By Product Type
- By Operation Type
- By Capacity Type
- By Application Type
- By End Use
- China
- Pricing Analysis
- Market Share Analysis, 2025
- By Product Type
- By Operation Type
- By Capacity Type
- By Application Type
- By End Use
- Japan
- Pricing Analysis
- Market Share Analysis, 2025
- By Product Type
- By Operation Type
- By Capacity Type
- By Application Type
- By End Use
- South Korea
- Pricing Analysis
- Market Share Analysis, 2025
- By Product Type
- By Operation Type
- By Capacity Type
- By Application Type
- By End Use
- Poland
- Pricing Analysis
- Market Share Analysis, 2025
- By Product Type
- By Operation Type
- By Capacity Type
- By Application Type
- By End Use
- Hungary
- Pricing Analysis
- Market Share Analysis, 2025
- By Product Type
- By Operation Type
- By Capacity Type
- By Application Type
- By End Use
- United States
- Market Structure Analysis
- Competition Dashboard
- Competition Benchmarking
- Market Share Analysis of Top Players
- By Regional
- By Product Type
- By Operation Type
- By Capacity Type
- By Application Type
- By End Use
- Emerging Startups
- Innovation Benchmarking
- Competition Analysis
- Competition Deep Dive
- Daifuku
- Overview
- Product Portfolio
- Profitability by Market Segments
- Sales Footprint
- Strategy Overview
- Marketing Strategy
- Product Strategy
- Channel Strategy
- Dematic
- SSI Schaefer
- Vanderlande
- Honeywell Intelligrated
- Daifuku
- Case Studies
- Success Stories
- Recent Developments
- Competition Deep Dive
- Assumptions & Acronyms Used


