
- Market Size (2026)
- USD 14.8 Bn
- Forecast (2036)
- USD 22.8 Bn
- CAGR (2026 to 2036)
- 4.4%
How big is the Acrylonitrile Market in 2026?
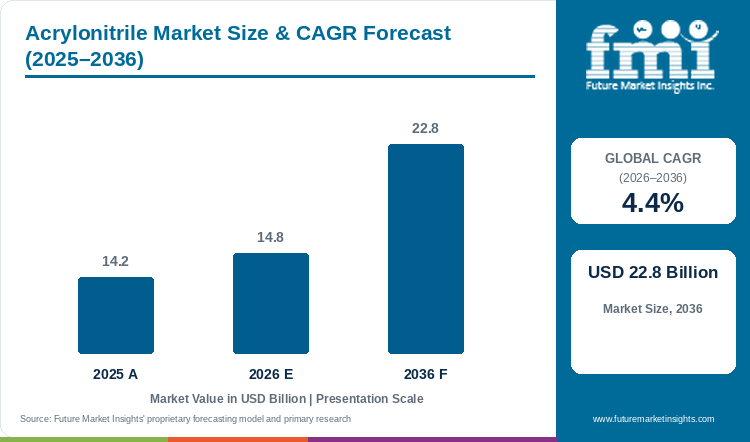
The global acrylonitrile market is estimated at USD 14.8 billion in 2026, compared with USD 14.2 billion in 2025, and is forecast to reach USD 22.8 billion by 2036, expanding at a CAGR of 4.4% from 2026 to 2036. In FMI's 2026 assessment, the ABS segment leads applications with 28.5%, the automotive and transportation segment leads end uses with 34.9%, and the propylene ammoxidation route leads production routes with 99.9%.
Japan's acrylonitrile production declined to 234,814 metric tons in 2025 from 302,855 metric tons in 2024, according to the Japan Petrochemical Industry Association. Domestic output had reached 449,028 metric tons in 2021, highlighting the sustained reduction in Japanese manufacturing activity. The decline has coincided with growing competition from other Asian production centres and pressure on domestic plant utilisation. Asahi Kasei identified persistently low operating rates and declining competitiveness in East Asian export markets as reasons for restructuring its chemical operations. The company is concentrating production at facilities where it can maintain more competitive operating costs while continuing supplies to established customers.
In May 2026, Asahi Kasei announced plans to discontinue its 200,000-tonne-per-year acrylonitrile production line at Mizushima around fiscal 2030. A separate 50,000-tonne-per-year methacrylonitrile line will be converted to joint acrylonitrile and methacrylonitrile production. Supply will continue through Tongsuh Petrochemical in South Korea, which operates a 600,000-tonne-per-year acrylonitrile facility at Ulsan. Later that month, Asahi Kasei's chief executive indicated that the company could consider strategic partners or potential buyers for its South Korean operations. The developments point to further changes in regional production ownership and sourcing arrangements even as the company maintains its customer supply commitments.
FMI finds that surplus capacity can lower a quoted price without improving the economics of the producing plant. China BlueChemical's 2025 interim report describes Chinese acrylonitrile production of 1.953 million tonnes in the first half, up 15.63%, and persistent oversupply despite growth in ABS, acrylamide and acrylic-fibre demand. The pressure falls on the margins of operating plants as well as the price paid by derivative customers.
Key Market Trends & Insights
- Ascend's high-purity acrylonitrile equipment was partly funded through a US government contract supporting domestic nitrile-glove raw materials. FMI finds that a specialist purity requirement can support investment within an existing plant even when bulk monomer supply is ample.
- INEOS offers Invireo through an ISCC+ mass-balance system and says it meets the same quality standards as standard material. FMI finds that certified feedstock attribution gives the producer a separate basis for competing for existing monomer business.
- Thailand's petrochemical industry survey recorded 147,000 tonnes of derivative-based acrylonitrile consumption in 2023, below 164,000 tonnes in 2022. The fall in this downstream outlet limited the domestic business available to monomer producers.
Regional Highlights
- North America's supplier base is being reshaped by plant economics. Cornerstone announced that its Waggaman acrylonitrile unit would be mothballed effective 30 June 2025, citing global oversupply and raw-material costs. This concentrates replacement enquiries among the region's remaining supply routes without establishing a regional shortage.
- In Western Europe, the European Commission's February 2026 ABS duties cover resin from South Korea and Taiwan and identify affected EU manufacturers in six member states. The measure changes competition among downstream resin suppliers; it does not impose the same duty on acrylonitrile monomer.
Table 1: Acrylonitrile Market Size and Forecast (USD billion and CAGR percentage), 2023 to 2036
| Market size and forecast | Value |
|---|---|
| Market size in 2023 | USD 13.0 billion |
| Market size in 2025 | USD 14.2 billion |
| Estimated market size in 2026 | USD 14.8 billion |
| Market size forecast for 2033 | USD 20.0 billion |
| Projected market size by 2036 | USD 22.8 billion |
| CAGR from 2026 to 2036 | 4.4% |
| Added revenue from 2026 to 2036 | USD 8.0 billion |
Source: Future Market Insights, Acrylonitrile Market Report, 2026 to 2036.
Analyst Perspective
“When an acrylonitrile line is retired, the question for a resin or fibre customer is where the replacement monomer will come from.”
- Nikhil Kaitwade, Principal Consultant, FMI
How is the Acrylonitrile Market segmented?
- By Application: ABS segment, acrylic fibre, acrylamide, nitrile butadiene rubber, carbon-fibre precursors, adiponitrile, SAN resin and other applications.
- By End Use: Automotive and transportation segment, construction and infrastructure, electrical and electronics, textiles and apparel, packaging and other end uses.
- By Production Route: Propylene ammoxidation route, propane ammoxidation and other routes.
- By Region: North America, Latin America, Western Europe, Eastern Europe, East Asia, South Asia and Pacific, and Middle East and Africa.
Why does the ABS segment lead by application?
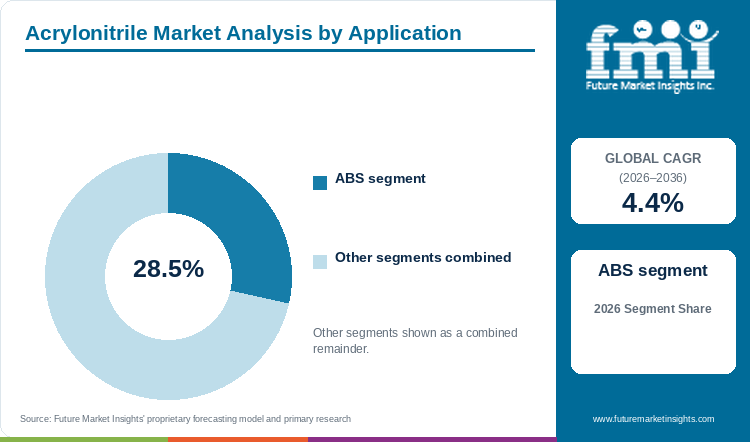
The ABS segment accounts for 28.5% of the Acrylonitrile Market by application in FMI's 2026 assessment.
Trade conditions at ABS producers can redirect acrylonitrile orders between origins. CPDC identifies ABS as one of its acrylonitrile outlets, while the European Commission's February 2026 action concerns imports of the finished resin from South Korea and Taiwan. FMI finds that the location of resin production matters to monomer sales even when the destination of the finished appliance or vehicle remains unchanged.
The duties range from 5.2% to 7.5% for Korean ABS and 10.9% to 21.7% for Taiwanese ABS. Their effect on acrylonitrile depends on how resin producers change output and sourcing. They alter competition between ABS origins without establishing a corresponding increase in total monomer consumption.
Table 2: Acrylonitrile Market Share by Application, 2026
| Leading Share | 2026 market share |
|---|---|
| ABS segment | 28.5% |
| All Other Segments Combined Share | 71.5% |
Source: Future Market Insights, Acrylonitrile Market Report, 2026 to 2036.
Why is the automotive and transportation segment the largest end use?
The automotive and transportation segment accounts for 34.9% of the Acrylonitrile Market by end use in FMI's 2026 assessment.
Transport demand reaches monomer producers through derivative suppliers whose commercial position depends on product mix and manufacturing location. Styrenix's May 2025 investor presentation identifies automotive customers across two-wheelers, passenger vehicles and commercial vehicles. It also describes a focus on automotive and household specialties and its newly acquired Thai plant's differentiated ABS and SAN grades. FMI finds that these resin portfolios connect acrylonitrile offtake to several vehicle markets, with individual grades serving different customer programmes.
The mix of operating derivative plants still constrains how much transport business reaches a monomer supplier. Styrenix's Thai acquisition expands its international OEM reach, while the EU's ABS duties change competition between resin origins. These developments affect where the polymer is made and its monomer is bought. Demand in the textile outlet follows different conditions: Vardhman reported lost fibre business and underutilisation despite easier monomer availability. The broad transport category therefore remains separate from textiles and packaging, with each monomer allocation following its principal finished-use destination.
Table 3: Acrylonitrile Market Share by End Use, 2026
| Leading Share | 2026 market share |
|---|---|
| Automotive and transportation segment | 34.9% |
| All Other Segments Combined Share | 65.1% |
Source: Future Market Insights, Acrylonitrile Market Report, 2026 to 2036.
What supports the propylene ammoxidation route as the leading production route?
The propylene ammoxidation route accounts for 99.9% of the Acrylonitrile Market by production route in FMI's 2026 assessment.
Propylene-route supply is being reorganised within established production networks. INEOS describes manufacture from propylene, ammonia and air, while Asahi Kasei's Mizushima plan retains acrylonitrile supply through a converted line and South Korea. FMI finds that these changes redistribute commercial supply within the leading reaction route. INEOS's certified Invireo range changes feedstock attribution without moving that material to another route.
The alternatives are at different stages of operation. Thailand's survey records a historical propane plant, and Asahi Kasei confirms that production ended in October 2024 and sales in December 2024. Trillium's Green Lake demonstration was announced in June 2024; the operator reported completed commissioning and acrylonitrile production in August 2026. The operator presented the demonstration as a step toward commercial production. Uzbekistan's 2025 national inventory separately documents acetylene and hydrogen-cyanide synthesis. These records distinguish an exited commercial plant, a producing demonstration and another established reaction process.
Table 4: Acrylonitrile Market Share by Production Route, 2026
| Leading Share | 2026 market share |
|---|---|
| Propylene ammoxidation route | 99.9% |
| All Other Segments Combined Share | 0.1% |
Source: Future Market Insights, Acrylonitrile Market Report, 2026 to 2036.
What are the key drivers restraints and opportunities?
Derivative output and monomer capacity are moving at different speeds. Chinese oversupply pressures prices, Cornerstone's planned exit changes US supply, and product-carbon verification adds a separate point of competition.
Driver
Operating ABS, acrylamide and acrylic-fibre plants sustain monomer offtake. China BlueChemical's interim report records demand growth in these outlets alongside a still larger supply imbalance. FMI finds that new acrylonitrile capacity increases competition for derivative customers when their consumption does not absorb the added output.
Restraint
Weak plant economics can interrupt an established supply chain. Cornerstone linked its mothball decision to global oversupply and rising raw-material costs. The announcement shows why abundant global capacity does not guarantee that an individual producer will keep offering the same origin. Contract continuity is exposed to the producing plant's margins as well as the customer's order volume.
Opportunity
Independent product-carbon verification gives suppliers another way to compete for accounts with emissions-reporting requirements. Tongsuh's October 2026 reasonable-assurance verification covers a defined Ulsan production boundary. FMI finds that the commercial offer is verified data attached to an existing chemical supply; the assurance does not prove a lower footprint than every competing grade.
How do trade and quality rules affect purchasing?
Monomer regulation and derivative trade measures affect different parts of the transaction. EPA's December 2024 high-priority designation began acrylonitrile's TSCA risk-evaluation process; it was not an announced ban. The EU's 2026 duties concern specified ABS resin imports. FMI finds that the former increases scrutiny of the monomer's uses and exposures, while the latter changes competition among the resin plants buying it.
What limits reliable acrylonitrile delivery?
Acrylonitrile's toxicity, flammability and stabilisation requirements restrict the transport and storage arrangements that can serve an account. Green Lake's rail, truck, barge and pipeline connections support both inland distribution and port loading. These documented facilities make logistics part of the production network; nameplate monomer capacity alone does not describe the routes available to customers.
Where can suppliers win additional business?
Asahi Kasei's planned Mizushima change creates a defined period for transferring supply within its regional network. The company plans to retain acrylonitrile supply through another line and Tongsuh in South Korea as the larger line is discontinued. FMI finds that the business opening concerns the transition of existing resin and fibre accounts before fiscal 2030. The announcement establishes a supply-realignment programme, rather than new Japanese derivative capacity.
Acrylonitrile Market by Country (2026 to 2036)
Table 5: Acrylonitrile Market Country Growth Forecast, 2026 to 2036
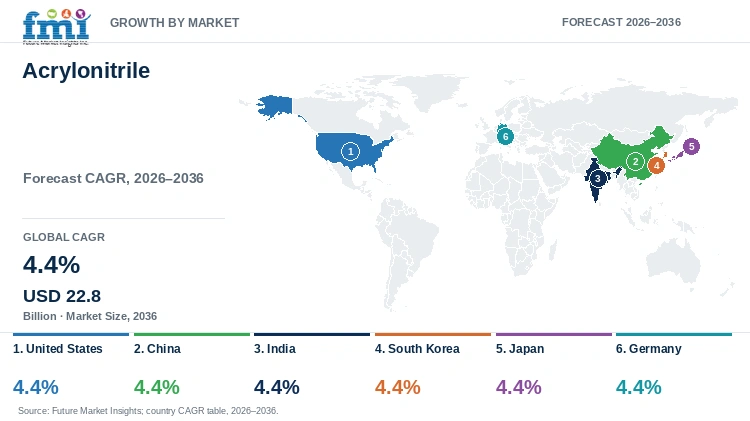
| Country | CAGR |
|---|---|
| United States | 4.4% |
| China | 4.4% |
| India | 4.4% |
| South Korea | 4.4% |
| Japan | 4.4% |
| Germany | 4.4% |
Source: Future Market Insights, Acrylonitrile Market Report, 2026 to 2036.
United States
US acrylonitrile supply is being reconfigured through both withdrawal and investment. Cornerstone announced a mothball decision effective 30 June 2025 after citing oversupply and higher raw-material costs. Ascend commissioned additional purification at Chocolate Bayou in Alvin, Texas, and began high-purity production in May 2025. These developments change the available origins and specifications in different ways.
Ascend's equipment was partly funded by a US government contract supporting raw materials for domestic nitrile-rubber gloves. That ties the investment to a defined healthcare supply chain. FMI finds that its specialist business can develop alongside weak bulk-monomer economics. The government-supported project does not establish that every US resin or fibre account purchases the same purity.
US production also serves export customers. INEOS states that most Green Lake acrylonitrile is exported and lists rail, truck, barge and pipeline transport to its port facilities. The Texas plant therefore competes in international monomer trade as well as domestic supply. Changes in export offtake can affect the business available to a US producer even when domestic derivative activity is unchanged.
FMI's United States forecast of a 4.4% CAGR from 2026 to 2036 reflects this combination of established bulk supply and specialist development. EPA's acrylonitrile risk evaluation adds scrutiny of uses and exposure records. The commercial outlook turns on continued derivative purchases and the viability of the plants supplying them, with safety and handling obligations remaining part of those supply arrangements.
China
China's additional acrylonitrile production is competing for demand that has not absorbed the increase in supply. China BlueChemical reports first-half 2025 output of approximately 1.953 million tonnes, up 15.63%, and attributes the imbalance to new capacity from Yulong Petrochemical, Sinochem Quanzhou and Zhenhai Refining and Chemical. Operating additions therefore matter more to the immediate market than announcements alone.
The same issuer describes a temporary shortage in the first quarter, followed by more abundant supply as new plants started and units returned from maintenance. FMI finds that this sequence explains how a market with rising annual production can still experience short periods of tighter availability. The return of existing equipment compounds the competitive effect of the newly commissioned units.
ABS, acrylamide and acrylic-fibre demand improved during that half-year, but the issuer says the increase failed to offset supply growth and prices fell. Vardhman Acrylics separately reported better imported-monomer availability as Chinese capacity expanded. The Indian producer's experience corroborates pressure in the export supply chain; it does not measure the whole Chinese market or establish utilisation at each Chinese derivative plant.
FMI forecasts a 4.4% CAGR for China from 2026 to 2036 amid this divergence between output growth and pricing. More operating derivative capacity can expand monomer consumption, while competition between suppliers restrains the revenue earned from that volume. FMI's commercial reading therefore depends on actual ABS and chemical-intermediate output, with the issuer's documented oversupply limiting the case for converting every new monomer tonne into equivalent market-value growth.
India
India's derivative producers buy monomer through an established import market. The Department of Chemicals and Petrochemicals records acrylonitrile imports of 210,456 tonnes in fiscal 2024 to 2025, compared with 180,891 tonnes a year earlier. The increase establishes higher cross-border purchases; the performance of individual derivatives determines how that feedstock is used.
The acrylic-fibre outlet was under pressure during the same period. Vardhman Acrylics reports that low-priced fibre imports reduced its business volume and prevented full capacity utilisation. FMI finds that imported finished fibre competes with Indian monomer offtake: material arriving as fibre has already passed through polymer production abroad, while a local fibre mill purchases acrylonitrile for its own output.
Vardhman also describes improving monomer availability as Asian capacity grew, alongside weaker derivative demand and fibre margins. Cheaper feedstock did not remove competition in the finished-fibre market. Its report identifies crude-oil and exchange-rate movements as influences on India's imported acrylonitrile cost, and cheaper alternative fibres as a substitution risk. These conditions affect the margin available between buying monomer and selling locally made fibre.
FMI forecasts a 4.4% CAGR for India from 2026 to 2036, in line with the global outlook. Continued import access supports derivative production, but the forecast requires recovery in customer offtake rather than a simple continuation of the latest import increase. Fibre, ABS and specialist-rubber purchases follow different downstream conditions. The combination of higher monomer imports and Vardhman's weaker fibre business shows why the national import total cannot by itself establish stronger demand in every application.
South Korea
South Korea's production network is set to retain a role in supplying Japanese acrylonitrile customers as Asahi Kasei restructures Mizushima. The company identifies Tongsuh Petrochemical as a continuing source in its May 2026 plan. FMI finds that redirected supply can support Korean production without representing an equivalent increase in monomer consumed by Korean derivative plants.
Tongsuh's Ulsan site also supplies independently checked product-carbon information. Asahi Kasei says the October 2026 audit examined the methodology, source data and reporting process for fiscal 2025, from raw-material procurement through production. That boundary matters commercially because the assurance addresses the producer's declared footprint; it does not cover every subsequent shipment or the manufacture of a customer's finished polymer.
The same disclosure states that Tongsuh has produced and marketed biomass-propylene acrylonitrile through a mass-balance approach since 2022. The offer adds feedstock traceability while retaining the propylene route. Korean ABS faces a separate issue under the EU duties announced in February 2026. Those duties apply to resin, so their effect on monomer purchases depends on changes in resin orders and production. FMI's 4.4% CAGR forecast for South Korea from 2026 to 2036 reflects continuing regional supply and differentiated product records, with derivative trade conditions constraining growth in customer offtake. Carbon-footprint documentation strengthens differentiation within these regional contracts, while domestic consumption still follows Korean derivative output.
Japan
Asahi Kasei's Japanese acrylonitrile business is moving toward a smaller domestic production configuration while retaining regional supply. Its May 2026 announcement targets fiscal 2030 for discontinuing the 200,000-tonne-a-year Mizushima line and converting the 50,000-tonne methacrylonitrile line to co-production. The two actions have different effects: one withdraws a line, while the other retains manufacturing capability in a shared operation.
The company says Tongsuh Petrochemical in South Korea will remain an acrylonitrile source. FMI finds that this is a change in the supply chain serving Japanese resin and fibre customers, rather than an announced exit from all sales to them. Continued feedstock supply supports FMI's forecast of a 4.4% CAGR for Japan from 2026 to 2036 even as the location of production changes.
Asahi Kasei links the programme to capital efficiency and profitability and says the planned realignment has no immediate effect on derivative supply. The commercial pressure is therefore on the economics of the existing assets. Retaining customer business through another producing line and Korean supply offers a different course from investing in replacement capacity of the same size at Mizushima.
The fiscal 2030 target places the production change within the forecast period. FMI's outlook allows existing derivative demand to continue through that transition. The planned combination of co-production and Korean supply redistributes continuing business across the company's regional assets. Growth in the value of monomer supplied to Japan can therefore coexist with retirement of the larger domestic line, provided derivative customers maintain their output through the realignment.
Germany
German acrylonitrile supply sits beside a downstream resin industry affected by the EU's ABS trade action. INEOS identifies Cologne among its nitriles manufacturing locations, and the European Commission names Germany among the member states whose resin producers were injured by the investigated imports. These disclosures establish a domestic production chain exposed to changes in resin competition.
The February 2026 duties apply to ABS from South Korea and Taiwan. FMI finds that any resulting monomer opportunity depends on European resin plants securing orders and increasing production. A change in the price of imported resin can support their competitive position without imposing the same duty on acrylonitrile. This keeps the commercial effect tied to derivative output rather than treating the measure as protection for every German monomer sale.
Cologne also produces INEOS's Invireo bio-attributed acrylonitrile. The company describes an ISCC+ mass-balance system that combines sustainable and fossil feedstocks while meeting its standard product-quality requirements. Feedstock records therefore provide another point of competition from the existing German production base. They describe an attributed material offer and do not establish a separate physical reaction route.
FMI's 4.4% CAGR forecast for Germany from 2026 to 2036 combines the needs of its established derivative industry with this differentiated regional supply. The two developments act through different mechanisms: trade measures affect resin competition, while certified feedstock attribution affects the monomer offer. Higher resin production would support additional local monomer purchases; carbon-attributed grades instead compete for a different specification within the existing supply relationship. The outlook remains tied to customer output and the economics of regional production.
Who are the notable companies in the Acrylonitrile Market?
INEOS, Asahi Kasei and Ascend Performance Materials compete from different production positions. INEOS combines plants in Green Lake, Lima and Cologne with international terminals. Asahi Kasei is realigning Japanese and South Korean supply, while Ascend has added purification at its existing Chocolate Bayou site. FMI finds that these investments affect geographic supply and grade capability through separate mechanisms.
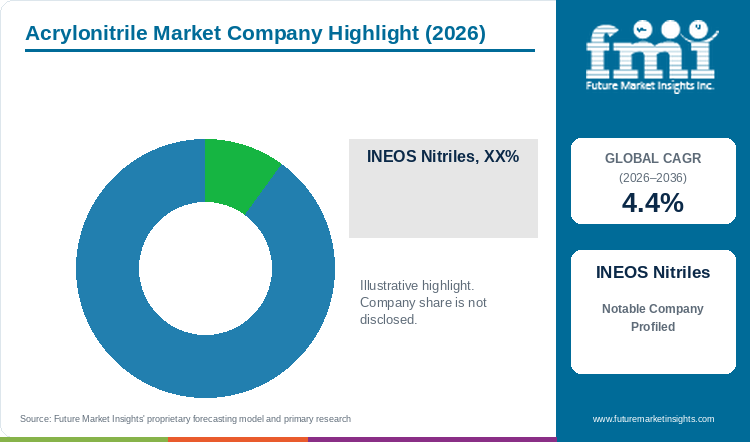
The Mizushima plan retains customer supply through another line and Tongsuh as the larger Japanese line is discontinued. In the United States, Ascend's commissioned high-purity equipment was partly supported by a government contract for domestic nitrile-glove raw materials. These are specific responses to asset economics and a specialist downstream requirement. They do not establish equivalent operating scope or a numerical company ranking.
Product-carbon records create another distinction. INEOS offers Invireo through a mass-balance system, and Tongsuh has secured independent assurance for its fiscal 2025 product footprint within a stated production boundary. Formosa Plastics, Sumitomo Chemical and Sinopec remain within the report's wider competitive coverage. FMI's commercial assessment centres on the documented manufacturing network, specialist purification and verified material records; the value of each position depends on the derivative accounts it serves.
Key Developments in the Acrylonitrile Market
- On 12 May 2026, Asahi Kasei announced a plan to discontinue the 200,000-tonne-a-year Mizushima acrylonitrile line around fiscal 2030, convert the 50,000-tonne methacrylonitrile line to co-production and maintain supply through Tongsuh Petrochemical.
Key Players in the Acrylonitrile Market
- INEOS
- Asahi Kasei
- Ascend Performance Materials
- Formosa Plastics
- Sumitomo Chemical
- Sinopec
Acrylonitrile Market Report Scope
Table 6: Acrylonitrile Market Report Scope, 2026 to 2036
| Coverage field | Report scope |
|---|---|
| Market definition | Acrylonitrile monomer valued once at the producer level, including comparable captive commercial input into resin, fibre, elastomer and chemical-intermediate production. |
| Market boundary | Excludes downstream polymer, fibre and finished-goods sales values, duplicated intermediate transfers and acetonitrile as a separate product. |
| Quantitative units | USD billion for market value; separately labelled tonnes and annual plant capacities for operating context. |
| Forecast period | 2026 to 2036, with 2025 as the preceding year and reference values for 2023 and 2033. |
| Application coverage | ABS segment means ABS resin. Other applications are acrylic fibre, acrylamide, nitrile butadiene rubber, carbon-fibre precursors, adiponitrile, SAN resin and the residual other applications. Carbon-fibre precursors cover the monomer entering that chain, separately from acrylic fibre. |
| End-use coverage | Automotive and transportation segment includes vehicle and other transport outlets. Other end uses are construction and infrastructure, electrical and electronics, textiles and apparel, packaging and residual uses. Packaging remains separate even when used for transport; technical textiles follow their principal finished-use destination. |
| Production routes | Propylene ammoxidation route, propane ammoxidation and other routes, including acetylene/HCN and emerging processes. Bio-attributed propylene remains in the propylene reaction route. |
| Geographic coverage | Global totals across seven regions, with detailed United States, China, India, South Korea, Japan and Germany profiles. Each profiled country has a 4.4% CAGR forecast for 2026 to 2036. |
| Competitive coverage | Producer networks, grade capability, qualification, logistics and supported supply changes; no numerical company shares are asserted. |
| Evidence coverage | Producer disclosures, government statistics and inventories, trade measures and industry records available through 1 November 2026. |
Source: Future Market Insights, Acrylonitrile Market Report, 2026 to 2036.
Acrylonitrile Market Research Methodology
The acrylonitrile assessment combines secondary review of producer disclosures, government statistics, securities filings and industry records with FMI's global market series. Published application revenues, end-use consumption and plant activity inform separate segment assessments at a common monomer producer-value boundary. Application identifies the derivative receiving the monomer, end use follows the principal finished-use destination, and route follows the manufacturing reaction. Country analysis examines derivative activity and imports within the global outlook. The assessment distinguishes market-value forecasts from separately dated operating observations and announced projects.
Acrylonitrile Market by Segments
Acrylonitrile Market segmented by Application:
- ABS segment
- Acrylic fibre
- Acrylamide
- Nitrile butadiene rubber
- Carbon-fibre precursors
- Adiponitrile
- SAN resin
- Other applications
Acrylonitrile Market segmented by End Use:
- Automotive and transportation segment
- Construction and infrastructure
- Electrical and electronics
- Textiles and apparel
- Packaging
- Other end uses
Acrylonitrile Market segmented by Production Route:
- Propylene ammoxidation route
- Propane ammoxidation
- Other routes
Acrylonitrile Market by Region
- North America
- United States
- Canada
- Latin America
- Brazil
- Mexico
- Argentina
- Chile
- Other Latin America
- Western Europe
- Germany
- France
- United Kingdom
- Italy
- Spain
- Benelux
- Nordics
- Other Western Europe
- Eastern Europe
- Poland
- Czech Republic
- Romania
- Hungary
- Russia
- Other Eastern Europe
- East Asia
- China
- Japan
- South Korea
- Taiwan
- Other East Asia
- South Asia and Pacific
- India
- Singapore
- Other ASEAN countries
- Australia and New Zealand
- Other South Asia and Pacific
- Middle East and Africa
- GCC Countries
- South Africa
- Türkiye
- Israel
- Northern Africa
- Other Middle East and Africa
Research Sources and Bibliography
- [1] Asahi Kasei. Reconfiguration of certain derivatives operations at the Mizushima Works. 12 May 2026.
- [2] China BlueChemical. Interim Report 2025, management discussion of acrylonitrile. 29 September 2025.
- [3] Ascend Performance Materials. Ascend begins production of high-purity acrylonitrile. 12 May 2025.
- [4] INEOS Nitriles. Invireo product range and mass-balance approach. Accessed 31 October 2026.
- [5] Federation of Thai Industries, Petrochemical Industry Club. Thailand's Petrochemical Industrial Report 2024, acrylonitrile section, 2023 data. June 2024.
- [6] Cornerstone Chemical Company. Announces Deactivation of Acrylonitrile Unit. 20 February 2025.
- [7] European Commission. Commission acts against unfairly traded imports of ABS from Korea, Taiwan. 13 February 2026.
- [8] China Petrochemical Development Corporation. Acrylonitrile product page and downstream uses. Accessed 31 October 2026.
- [9] Vardhman Acrylics. Annual Report 2024 to 2025, management discussion and analysis. 2025.
- [10] INEOS Group Holdings. Annual Report 2025, raw materials and energy. 2026.
- [11] INEOS. Trillium Renewable Chemicals selects Green Lake for a glycerol-to-acrylonitrile demonstration plant. 4 June 2024.
- [12] Asahi Kasei. Strengthens Carbon Footprint Transparency for Acrylonitrile Production with Independent Third-Party Verification. 20 October 2026.
- [13] US Environmental Protection Agency. Begins Five Chemical Risk Evaluations Under TSCA. 18 December 2024.
- [14] INEOS. Green Lake site profile. Accessed 31 October 2026.
- [15] India Department of Chemicals and Petrochemicals. Chemicals and Petrochemicals Statistics at a Glance 2025, Table 25. 2025.
- [16] INEOS Nitriles. Business and manufacturing locations. Accessed 31 October 2026.
- [17] Asahi Kasei. Notice of decision to discontinue acrylonitrile and other operations of equity-method affiliate PTT Asahi Chemical Co., Ltd. 15 November 2024.
- [18] Styrenix Performance Materials. Investor Presentation for the quarter and year ended 31 March 2025, automotive customers and Managing Director’s Message, pages 24 and 37. 24 May 2025.
- [19] Trillium Renewable Chemicals. Project Falcon is making chemicals, commissioning and plant-operations announcement. 21 August 2026.
- [20] Republic of Uzbekistan. National Inventory Report under the first Biennial Transparency Report, section 4.4.8.3 on acrylonitrile manufacture. October 2025.
Table of Content
- Key Takeaways
- Market Size and CAGR
- Top Growth Driver
- Fastest Growing Segment
- Leading Region
- Key Companies
- Emerging Opportunities
- Executive Summary
- Global Market Outlook
- Demand-side Trends
- Supply-side Trends
- Technology Roadmap Analysis
- Analysis and Recommendations
- Analyst Perspective (What is happening? Why now? What should investors know?)
- Key Questions Answered
- How large is the market?
- What is the CAGR?
- What are key trends?
- Which region dominates?
- Who are the leaders?
Read More...
- Market Overview
- Market Coverage / Taxonomy
- Market Definition / Scope / Limitations
- Research Methodology
- Chapter Orientation
- Analytical Lens and Working Hypotheses
- Market Structure, Signals, and Trend Drivers
- Benchmarking and Cross-market Comparability
- Market Sizing, Forecasting, and Opportunity Mapping
- Research Design and Evidence Framework
- Desk Research Programme (Secondary Evidence)
- Expert Input and Fieldwork (Primary Evidence)
- Tooling, Models, and Reference Databases
- Data Engineering and Model Build
- Quality Assurance and Audit Trail
- Market Background
- Market Dynamics (Drivers, Restraints, Opportunity, Trends)
- Scenario Forecast (Optimistic, Likely, Conservative)
- Impact Analysis
- AI Impact
- Sustainability Impact
- Regulatory Impact
- Technology Impact
- Consumer / Buyer Analysis
- Purchase Drivers
- Adoption Barriers
- Buyer Journey
- Opportunity Map Analysis
- Product Life Cycle Analysis
- Supply Chain Analysis
- Investment Feasibility Matrix
- Value Chain Analysis
- PESTLE and Porter's Analysis
- Regulatory Landscape
- Regional Parent Market Outlook
- Production and Consumption Statistics
- Import and Export Statistics
- Global Market Analysis and Forecast, 2021 to 2036
- Historical Market Size Value (USD Billion) Analysis, 2021 to 2025
- Current and Future Market Size Value (USD Billion) Projections, 2026 to 2036
- Y-o-Y Growth Trend Analysis
- Absolute $ Opportunity Analysis
- Global Market Pricing Analysis, 2021 to 2036
- Global Market Analysis and Forecast, By Application, 2021 to 2036
- Introduction / Key Findings
- Historical Market Size Value (USD Billion) Analysis By Application, 2021 to 2025
- Current and Future Market Size Value (USD Billion) Analysis and Forecast By Application, 2026 to 2036
- ABS segment
- Acrylic fibre
- Acrylamide
- Nitrile butadiene rubber
- Carbon-fibre precursors
- Adiponitrile
- SAN resin
- Other applications
- Y-o-Y Growth Trend Analysis By Application, 2021 to 2025
- Absolute $ Opportunity Analysis By Application, 2026 to 2036
- Global Market Analysis and Forecast, By End Use, 2021 to 2036
- Introduction / Key Findings
- Historical Market Size Value (USD Billion) Analysis By End Use, 2021 to 2025
- Current and Future Market Size Value (USD Billion) Analysis and Forecast By End Use, 2026 to 2036
- Automotive and transportation segment
- Construction and infrastructure
- Electrical and electronics
- Textiles and apparel
- Packaging
- Other end uses
- Y-o-Y Growth Trend Analysis By End Use, 2021 to 2025
- Absolute $ Opportunity Analysis By End Use, 2026 to 2036
- Global Market Analysis and Forecast, By Production Route, 2021 to 2036
- Introduction / Key Findings
- Historical Market Size Value (USD Billion) Analysis By Production Route, 2021 to 2025
- Current and Future Market Size Value (USD Billion) Analysis and Forecast By Production Route, 2026 to 2036
- Propylene ammoxidation route
- Propane ammoxidation
- Other routes
- Y-o-Y Growth Trend Analysis By Production Route, 2021 to 2025
- Absolute $ Opportunity Analysis By Production Route, 2026 to 2036
- Global Market Analysis and Forecast, By Region, 2021 to 2036
- Introduction
- Historical Market Size Value (USD Billion) Analysis By Region, 2021 to 2025
- Current Market Size Value (USD Billion) Analysis and Forecast By Region, 2026 to 2036
- North America
- Latin America
- Western Europe
- Eastern Europe
- East Asia
- South Asia and Pacific
- Middle East and Africa
- Market Attractiveness Analysis By Region
- North America Market Analysis and Forecast, By Country, 2021 to 2036
- Historical Market Size Value (USD Billion) Trend Analysis By Market Taxonomy, 2021 to 2025
- Market Size Value (USD Billion) Forecast By Market Taxonomy, 2026 to 2036
- By Country
- United States
- Canada
- By Application
- By End Use
- By Production Route
- By Country
- Market Attractiveness Analysis
- By Country
- By Application
- By End Use
- By Production Route
- Key Takeaways
- Latin America Market Analysis and Forecast, By Country
- Historical Market Size Value (USD Billion) Trend Analysis By Market Taxonomy, 2021 to 2025
- Market Size Value (USD Billion) Forecast By Market Taxonomy, 2026 to 2036
- By Country
- Brazil
- Mexico
- Argentina
- Chile
- Other Latin America
- By Application
- By End Use
- By Production Route
- By Country
- Market Attractiveness Analysis
- By Country
- By Application
- By End Use
- By Production Route
- Key Takeaways
- Western Europe Market Analysis and Forecast, By Country
- Historical Market Size Value (USD Billion) Trend Analysis By Market Taxonomy, 2021 to 2025
- Market Size Value (USD Billion) Forecast By Market Taxonomy, 2026 to 2036
- By Country
- Germany
- France
- United Kingdom
- Italy
- Spain
- Benelux
- Nordics
- Other Western Europe
- By Application
- By End Use
- By Production Route
- By Country
- Market Attractiveness Analysis
- By Country
- By Application
- By End Use
- By Production Route
- Key Takeaways
- Eastern Europe Market Analysis and Forecast, By Country
- Historical Market Size Value (USD Billion) Trend Analysis By Market Taxonomy, 2021 to 2025
- Market Size Value (USD Billion) Forecast By Market Taxonomy, 2026 to 2036
- By Country
- Poland
- Czech Republic
- Romania
- Hungary
- Russia
- Other Eastern Europe
- By Application
- By End Use
- By Production Route
- By Country
- Market Attractiveness Analysis
- By Country
- By Application
- By End Use
- By Production Route
- Key Takeaways
- East Asia Market Analysis and Forecast, By Country
- Historical Market Size Value (USD Billion) Trend Analysis By Market Taxonomy, 2021 to 2025
- Market Size Value (USD Billion) Forecast By Market Taxonomy, 2026 to 2036
- By Country
- China
- Japan
- South Korea
- Taiwan
- Other East Asia
- By Application
- By End Use
- By Production Route
- By Country
- Market Attractiveness Analysis
- By Country
- By Application
- By End Use
- By Production Route
- Key Takeaways
- South Asia and Pacific Market Analysis and Forecast, By Country
- Historical Market Size Value (USD Billion) Trend Analysis By Market Taxonomy, 2021 to 2025
- Market Size Value (USD Billion) Forecast By Market Taxonomy, 2026 to 2036
- By Country
- India
- Singapore
- Other ASEAN countries
- Australia and New Zealand
- Other South Asia and Pacific
- By Application
- By End Use
- By Production Route
- By Country
- Market Attractiveness Analysis
- By Country
- By Application
- By End Use
- By Production Route
- Key Takeaways
- Middle East and Africa Market Analysis and Forecast, By Country
- Historical Market Size Value (USD Billion) Trend Analysis By Market Taxonomy, 2021 to 2025
- Market Size Value (USD Billion) Forecast By Market Taxonomy, 2026 to 2036
- By Country
- GCC Countries
- South Africa
- Türkiye
- Israel
- Northern Africa
- Other Middle East and Africa
- By Application
- By End Use
- By Production Route
- By Country
- Market Attractiveness Analysis
- By Country
- By Application
- By End Use
- By Production Route
- Key Takeaways
- Key Countries Market Analysis
- United States
- Pricing Analysis
- Market Share Analysis, 2025
- By Application
- By End Use
- By Production Route
- Canada
- Pricing Analysis
- Market Share Analysis, 2025
- By Application
- By End Use
- By Production Route
- Mexico
- Pricing Analysis
- Market Share Analysis, 2025
- By Application
- By End Use
- By Production Route
- Brazil
- Pricing Analysis
- Market Share Analysis, 2025
- By Application
- By End Use
- By Production Route
- Chile
- Pricing Analysis
- Market Share Analysis, 2025
- By Application
- By End Use
- By Production Route
- Germany
- Pricing Analysis
- Market Share Analysis, 2025
- By Application
- By End Use
- By Production Route
- United Kingdom
- Pricing Analysis
- Market Share Analysis, 2025
- By Application
- By End Use
- By Production Route
- Italy
- Pricing Analysis
- Market Share Analysis, 2025
- By Application
- By End Use
- By Production Route
- Spain
- Pricing Analysis
- Market Share Analysis, 2025
- By Application
- By End Use
- By Production Route
- France
- Pricing Analysis
- Market Share Analysis, 2025
- By Application
- By End Use
- By Production Route
- India
- Pricing Analysis
- Market Share Analysis, 2025
- By Application
- By End Use
- By Production Route
- Australia and New Zealand
- Pricing Analysis
- Market Share Analysis, 2025
- By Application
- By End Use
- By Production Route
- China
- Pricing Analysis
- Market Share Analysis, 2025
- By Application
- By End Use
- By Production Route
- Japan
- Pricing Analysis
- Market Share Analysis, 2025
- By Application
- By End Use
- By Production Route
- South Korea
- Pricing Analysis
- Market Share Analysis, 2025
- By Application
- By End Use
- By Production Route
- Russia
- Pricing Analysis
- Market Share Analysis, 2025
- By Application
- By End Use
- By Production Route
- Poland
- Pricing Analysis
- Market Share Analysis, 2025
- By Application
- By End Use
- By Production Route
- Hungary
- Pricing Analysis
- Market Share Analysis, 2025
- By Application
- By End Use
- By Production Route
- Türkiye
- Pricing Analysis
- Market Share Analysis, 2025
- By Application
- By End Use
- By Production Route
- South Africa
- Pricing Analysis
- Market Share Analysis, 2025
- By Application
- By End Use
- By Production Route
- United States
- Market Structure Analysis
- Competition Dashboard
- Competition Benchmarking
- Market Share Analysis of Top Players
- By Regional
- By Application
- By End Use
- By Production Route
- Emerging Startups
- Innovation Benchmarking
- Competition Analysis
- Competition Deep Dive
- INEOS Nitriles
- Overview
- Product Portfolio
- Profitability by Market Segments
- Sales Footprint
- Strategy Overview
- Marketing Strategy
- Product Strategy
- Channel Strategy
- Asahi Kasei and Tongsuh
- Ascend Performance Materials
- INEOS
- Asahi Kasei
- Formosa Plastics
- Sumitomo Chemical
- Sinopec
- INEOS Nitriles
- Case Studies
- Success Stories
- Recent Developments
- Competition Deep Dive
- Assumptions & Acronyms Used
List of Tables
- Table 1: Global Market Value (USD Billion) Forecast by Region, 2021 to 2036
- Table 2: Global Market Value (USD Billion) Forecast by Application, 2021 to 2036
- Table 3: Global Market Value (USD Billion) Forecast by End Use, 2021 to 2036
- Table 4: Global Market Value (USD Billion) Forecast by Production Route, 2021 to 2036
- Table 5: North America Market Value (USD Billion) Forecast by Country, 2021 to 2036
- Table 6: North America Market Value (USD Billion) Forecast by Application, 2021 to 2036
- Table 7: North America Market Value (USD Billion) Forecast by End Use, 2021 to 2036
- Table 8: North America Market Value (USD Billion) Forecast by Production Route, 2021 to 2036
- Table 9: Latin America Market Value (USD Billion) Forecast by Country, 2021 to 2036
- Table 10: Latin America Market Value (USD Billion) Forecast by Application, 2021 to 2036
- Table 11: Latin America Market Value (USD Billion) Forecast by End Use, 2021 to 2036
- Table 12: Latin America Market Value (USD Billion) Forecast by Production Route, 2021 to 2036
- Table 13: Western Europe Market Value (USD Billion) Forecast by Country, 2021 to 2036
- Table 14: Western Europe Market Value (USD Billion) Forecast by Application, 2021 to 2036
- Table 15: Western Europe Market Value (USD Billion) Forecast by End Use, 2021 to 2036
- Table 16: Western Europe Market Value (USD Billion) Forecast by Production Route, 2021 to 2036
- Table 17: Eastern Europe Market Value (USD Billion) Forecast by Country, 2021 to 2036
- Table 18: Eastern Europe Market Value (USD Billion) Forecast by Application, 2021 to 2036
- Table 19: Eastern Europe Market Value (USD Billion) Forecast by End Use, 2021 to 2036
- Table 20: Eastern Europe Market Value (USD Billion) Forecast by Production Route, 2021 to 2036
- Table 21: East Asia Market Value (USD Billion) Forecast by Country, 2021 to 2036
- Table 22: East Asia Market Value (USD Billion) Forecast by Application, 2021 to 2036
- Table 23: East Asia Market Value (USD Billion) Forecast by End Use, 2021 to 2036
- Table 24: East Asia Market Value (USD Billion) Forecast by Production Route, 2021 to 2036
- Table 25: South Asia and Pacific Market Value (USD Billion) Forecast by Country, 2021 to 2036
- Table 26: South Asia and Pacific Market Value (USD Billion) Forecast by Application, 2021 to 2036
- Table 27: South Asia and Pacific Market Value (USD Billion) Forecast by End Use, 2021 to 2036
- Table 28: South Asia and Pacific Market Value (USD Billion) Forecast by Production Route, 2021 to 2036
- Table 29: Middle East and Africa Market Value (USD Billion) Forecast by Country, 2021 to 2036
- Table 30: Middle East and Africa Market Value (USD Billion) Forecast by Application, 2021 to 2036
- Table 31: Middle East and Africa Market Value (USD Billion) Forecast by End Use, 2021 to 2036
- Table 32: Middle East and Africa Market Value (USD Billion) Forecast by Production Route, 2021 to 2036
List of Figures
- Figure 1: Global Market Pricing Analysis
- Figure 2: Global Market Value (USD Billion) Forecast 2021-2036
- Figure 3: Global Market Value Share and BPS Analysis by Application, 2026 and 2036
- Figure 4: Global Market Y-o-Y Growth Comparison by Application, 2026-2036
- Figure 5: Global Market Attractiveness Analysis by Application
- Figure 6: Global Market Value Share and BPS Analysis by End Use, 2026 and 2036
- Figure 7: Global Market Y-o-Y Growth Comparison by End Use, 2026-2036
- Figure 8: Global Market Attractiveness Analysis by End Use
- Figure 9: Global Market Value Share and BPS Analysis by Production Route, 2026 and 2036
- Figure 10: Global Market Y-o-Y Growth Comparison by Production Route, 2026-2036
- Figure 11: Global Market Attractiveness Analysis by Production Route
- Figure 12: Global Market Value (USD Billion) Share and BPS Analysis by Region, 2026 and 2036
- Figure 13: Global Market Y-o-Y Growth Comparison by Region, 2026-2036
- Figure 14: Global Market Attractiveness Analysis by Region
- Figure 15: North America Market Incremental Dollar Opportunity, 2026-2036
- Figure 16: Latin America Market Incremental Dollar Opportunity, 2026-2036
- Figure 17: Western Europe Market Incremental Dollar Opportunity, 2026-2036
- Figure 18: Eastern Europe Market Incremental Dollar Opportunity, 2026-2036
- Figure 19: East Asia Market Incremental Dollar Opportunity, 2026-2036
- Figure 20: South Asia and Pacific Market Incremental Dollar Opportunity, 2026-2036
- Figure 21: Middle East and Africa Market Incremental Dollar Opportunity, 2026-2036
- Figure 22: North America Market Value Share and BPS Analysis by Country, 2026 and 2036
- Figure 23: North America Market Value Share and BPS Analysis by Application, 2026 and 2036
- Figure 24: North America Market Y-o-Y Growth Comparison by Application, 2026-2036
- Figure 25: North America Market Attractiveness Analysis by Application
- Figure 26: North America Market Value Share and BPS Analysis by End Use, 2026 and 2036
- Figure 27: North America Market Y-o-Y Growth Comparison by End Use, 2026-2036
- Figure 28: North America Market Attractiveness Analysis by End Use
- Figure 29: North America Market Value Share and BPS Analysis by Production Route, 2026 and 2036
- Figure 30: North America Market Y-o-Y Growth Comparison by Production Route, 2026-2036
- Figure 31: North America Market Attractiveness Analysis by Production Route
- Figure 32: Latin America Market Value Share and BPS Analysis by Country, 2026 and 2036
- Figure 33: Latin America Market Value Share and BPS Analysis by Application, 2026 and 2036
- Figure 34: Latin America Market Y-o-Y Growth Comparison by Application, 2026-2036
- Figure 35: Latin America Market Attractiveness Analysis by Application
- Figure 36: Latin America Market Value Share and BPS Analysis by End Use, 2026 and 2036
- Figure 37: Latin America Market Y-o-Y Growth Comparison by End Use, 2026-2036
- Figure 38: Latin America Market Attractiveness Analysis by End Use
- Figure 39: Latin America Market Value Share and BPS Analysis by Production Route, 2026 and 2036
- Figure 40: Latin America Market Y-o-Y Growth Comparison by Production Route, 2026-2036
- Figure 41: Latin America Market Attractiveness Analysis by Production Route
- Figure 42: Western Europe Market Value Share and BPS Analysis by Country, 2026 and 2036
- Figure 43: Western Europe Market Value Share and BPS Analysis by Application, 2026 and 2036
- Figure 44: Western Europe Market Y-o-Y Growth Comparison by Application, 2026-2036
- Figure 45: Western Europe Market Attractiveness Analysis by Application
- Figure 46: Western Europe Market Value Share and BPS Analysis by End Use, 2026 and 2036
- Figure 47: Western Europe Market Y-o-Y Growth Comparison by End Use, 2026-2036
- Figure 48: Western Europe Market Attractiveness Analysis by End Use
- Figure 49: Western Europe Market Value Share and BPS Analysis by Production Route, 2026 and 2036
- Figure 50: Western Europe Market Y-o-Y Growth Comparison by Production Route, 2026-2036
- Figure 51: Western Europe Market Attractiveness Analysis by Production Route
- Figure 52: Eastern Europe Market Value Share and BPS Analysis by Country, 2026 and 2036
- Figure 53: Eastern Europe Market Value Share and BPS Analysis by Application, 2026 and 2036
- Figure 54: Eastern Europe Market Y-o-Y Growth Comparison by Application, 2026-2036
- Figure 55: Eastern Europe Market Attractiveness Analysis by Application
- Figure 56: Eastern Europe Market Value Share and BPS Analysis by End Use, 2026 and 2036
- Figure 57: Eastern Europe Market Y-o-Y Growth Comparison by End Use, 2026-2036
- Figure 58: Eastern Europe Market Attractiveness Analysis by End Use
- Figure 59: Eastern Europe Market Value Share and BPS Analysis by Production Route, 2026 and 2036
- Figure 60: Eastern Europe Market Y-o-Y Growth Comparison by Production Route, 2026-2036
- Figure 61: Eastern Europe Market Attractiveness Analysis by Production Route
- Figure 62: East Asia Market Value Share and BPS Analysis by Country, 2026 and 2036
- Figure 63: East Asia Market Value Share and BPS Analysis by Application, 2026 and 2036
- Figure 64: East Asia Market Y-o-Y Growth Comparison by Application, 2026-2036
- Figure 65: East Asia Market Attractiveness Analysis by Application
- Figure 66: East Asia Market Value Share and BPS Analysis by End Use, 2026 and 2036
- Figure 67: East Asia Market Y-o-Y Growth Comparison by End Use, 2026-2036
- Figure 68: East Asia Market Attractiveness Analysis by End Use
- Figure 69: East Asia Market Value Share and BPS Analysis by Production Route, 2026 and 2036
- Figure 70: East Asia Market Y-o-Y Growth Comparison by Production Route, 2026-2036
- Figure 71: East Asia Market Attractiveness Analysis by Production Route
- Figure 72: South Asia and Pacific Market Value Share and BPS Analysis by Country, 2026 and 2036
- Figure 73: South Asia and Pacific Market Value Share and BPS Analysis by Application, 2026 and 2036
- Figure 74: South Asia and Pacific Market Y-o-Y Growth Comparison by Application, 2026-2036
- Figure 75: South Asia and Pacific Market Attractiveness Analysis by Application
- Figure 76: South Asia and Pacific Market Value Share and BPS Analysis by End Use, 2026 and 2036
- Figure 77: South Asia and Pacific Market Y-o-Y Growth Comparison by End Use, 2026-2036
- Figure 78: South Asia and Pacific Market Attractiveness Analysis by End Use
- Figure 79: South Asia and Pacific Market Value Share and BPS Analysis by Production Route, 2026 and 2036
- Figure 80: South Asia and Pacific Market Y-o-Y Growth Comparison by Production Route, 2026-2036
- Figure 81: South Asia and Pacific Market Attractiveness Analysis by Production Route
- Figure 82: Middle East and Africa Market Value Share and BPS Analysis by Country, 2026 and 2036
- Figure 83: Middle East and Africa Market Value Share and BPS Analysis by Application, 2026 and 2036
- Figure 84: Middle East and Africa Market Y-o-Y Growth Comparison by Application, 2026-2036
- Figure 85: Middle East and Africa Market Attractiveness Analysis by Application
- Figure 86: Middle East and Africa Market Value Share and BPS Analysis by End Use, 2026 and 2036
- Figure 87: Middle East and Africa Market Y-o-Y Growth Comparison by End Use, 2026-2036
- Figure 88: Middle East and Africa Market Attractiveness Analysis by End Use
- Figure 89: Middle East and Africa Market Value Share and BPS Analysis by Production Route, 2026 and 2036
- Figure 90: Middle East and Africa Market Y-o-Y Growth Comparison by Production Route, 2026-2036
- Figure 91: Middle East and Africa Market Attractiveness Analysis by Production Route
- Figure 92: Global Market - Tier Structure Analysis
- Figure 93: Global Market - Company Share Analysis
Frequently Asked Questions
What is the Acrylonitrile Market forecast?
FMI places the market at USD 14.8 billion in 2026 and USD 22.8 billion by 2036, with a 4.4% CAGR from 2026 to 2036.
Which application leads the Acrylonitrile Market?
The ABS segment leads applications with 28.5% in FMI's 2026 assessment.
Which other breakdowns lead in 2026?
The automotive and transportation segment leads end uses with 34.9%, and the propylene ammoxidation route leads production routes with 99.9% in FMI's 2026 assessment.
Which profiled countries have the highest forecast growth?
All six profiled countries share a 4.4% CAGR forecast from 2026 to 2036.
Does the EU ABS duty apply to acrylonitrile monomer?
The February 2026 measure covers ABS resin imports from South Korea and Taiwan, rather than acrylonitrile monomer. [7]
Preview the report firsthand - request a free sample
Get SampleGet the brochure for pricing and purchase details.
Get PDF
