Antibody Profiling Market Size, Share, and Forecast Outlook 2025 to 2035

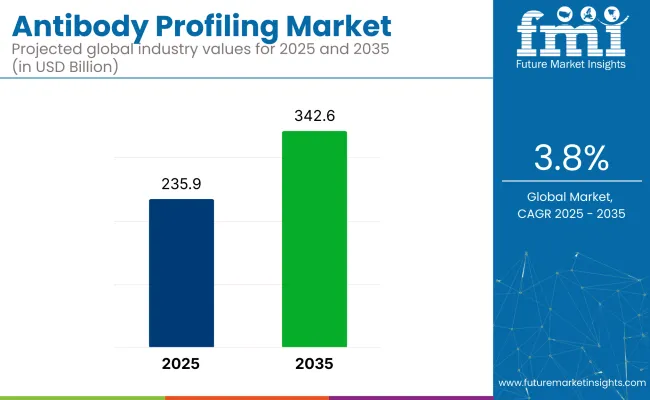
The global antibody profiling market is projected to rise from USD 235.9 billion in 2025 to USD 342.6 billion by 2035, expanding at a CAGR of 3.8%. The increased demand for precision diagnostics and immunotherapy validation is fueling steady investment in this segment.
Antibody Profiling Market Quick Stats

  • Market Size (2025): USD 235.9 billion
  • Market Size (2035): USD 342.6 billion
  • CAGR (2025 to 2035): 3.8%
  • Leading Segment: High-throughput Protein Microarrays (45.5%)
  • Key Growth Region: Asia Pacific (India)
  • Key Players: Infinity Bio, Rapid Novor, CellFree Sciences Co., Ltd., SomaLogic, AZoLifeSciences, CDI Labs, Biocopare

Antibody Profiling Market

Metric Value
Estimated Market Size (2025) USD 235.9 billion
Projected Market Size (2035) USD 342.6 billion
CAGR (2025 to 2035) 3.8%

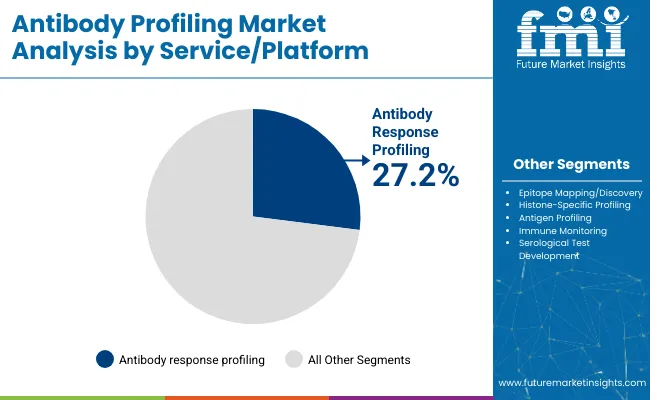
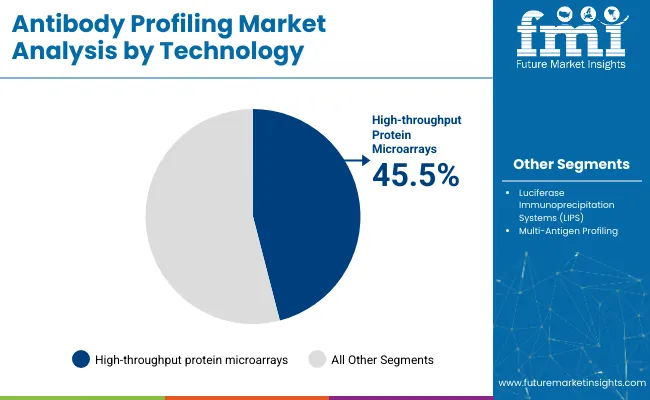
In terms of technology, high-throughput protein microarrays are expected to lead with a 45.5% industry share in 2025, owing to their ability to screen thousands of proteins in parallel. The antibody response profiling service type will contribute significantly, holding 27.2% of the industry, due to its broad use in infectious disease tracking, oncology, and autoimmune disorder research.

A significant advancement in the field comes from a study published in Cell Reports Methods, which introduced PolyMap-a high-throughput platform combining ribosome display with microfluidics for comprehensive antibody library specificity profiling.

PolyMap enables rapid mapping of antibody-protein interactions, dramatically accelerating early-stage screening and therapeutic antibody selection. This breakthrough represents a major technological leap, reinforcing the growing industry demand for sophisticated profiling tools that enhance antibody development pipelines and improve clinical research outcomes.

The industry, as a subset of the global research antibodies industry, makes up a notable portion of targeted protein-analysis tools. Within the proteomics market, immunoprofiling accounts for approximately 5%, leveraging immunoassays in biomarker discovery.

In the broader immunoassay/immunodiagnostics market, it contributes around 8%, thanks to ELISA and related techniques. Within the diagnostics market, it holds roughly 8-10%. In the biopharmaceutical & drug discovery market-often exceeding USD 200 B-immunoprofiling represents under 1%, used primarily in therapeutic development and biomarker validation. Lastly, as part of the expansive life science research tools market, its share is ~1%, essential but specialized among a wide range of lab instruments.

As drug developers aim to de-risk clinical trials and shorten development timelines, technologies are being adopted at scale. Coupled with advancements in AI, single-cell analysis, and bioinformatics integration, the industry is expected to benefit from expanding applications across vaccine research, personalized immunotherapy, and biomarker discovery.

Analysis of Antibody Profiling Market by Top Investment Segments

Antibody response profiling, high-throughput protein microarrays, and therapeutic antibodies are projected to dominate the industry in 2025 due to rising precision diagnostics, advanced proteomics, and targeted immunotherapy development.

Antibody Response Profiling Leads Platform Segment in 2025

Antibody response profiling is expected to dominate the service/platform type segment with a 27.2% share in 2025.Demand is expected to grow as the platform enables detailed evaluation of humoral immune responses against specific antigens across infectious diseases, autoimmune conditions, and cancer.
  • Pharmaceutical companies and academic researchers rely on it to track polyclonal antibody kinetics and epitope-specific responses.
  • The rise of multiplexed platforms and high-throughput assay designs further enhance the speed and sensitivity of antibody response profiling.
  • As precision medicine adoption increases globally, this profiling method remains central to immunology research and drug development workflows.

Antibody Profiling Market Analysis By Service

High-Throughput Protein Microarrays Dominate Technology in 2025

High-throughput protein microarrays are projected to lead the technology segment with a 45.5% industry share in 2025.Demand is rising as these arrays allow simultaneous screening of thousands of protein-antibody interactions on a single chip, making them ideal for large-scale applications.
  • Demand increases as their utility spans cancer biomarker discovery, autoimmune panel development, and vaccine target validation. By enabling rapid, multiplexed detection, they reduce experimental time while maximizing data output.
  • Pharmaceutical R&D and translational labs increasingly adopt these microarrays to streamline target screening and optimize antibody specificity. Ongoing improvements in surface chemistry, automation, and sensitivity are sustaining strong demand, especially in early-stage therapeutic development.

Antibody Profiling Market Analysis By Technology

Therapeutic Antibodies Lead Application Segment in 2025

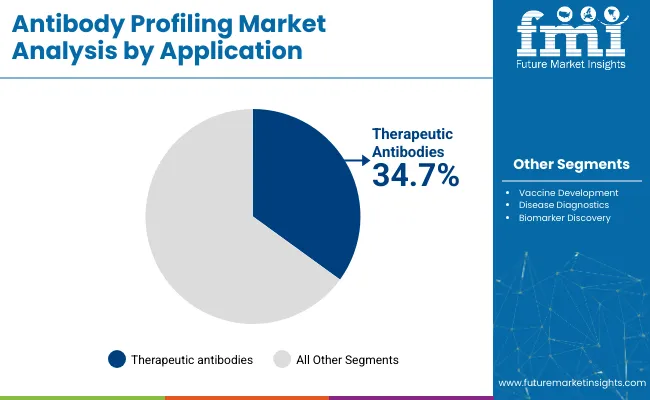
Therapeutic antibodies are expected to lead the application segment with a 34.7% share in 2025.Immunoprofilingplays a vital role in developing monoclonal antibodies, bispecific antibodies, and antibody-drug conjugates by identifying off-target effects, immunogenicity, and binding affinity.
  • Pharmaceutical companies leverage profiling to accelerate biologics development and ensure regulatory compliance.
  • The surge in oncology and autoimmune disease biologics has driven significant demand for advanced antibody characterization tools.
  • The rise of biosimilars has intensified the need for accurate and comparative profiling. As the biologics pipeline expands, antibody profiling will remain integral in optimizing safety and efficacy of therapeutic antibody candidates.

Antibody Profiling Market Analysis By Application

Top Antibody Profiling Market Dynamics

Antibody profiling advances disease diagnosis and accelerates biotherapeutic discovery. Dual-mode profiling enhances diagnostic precision, while high-throughput and AI-assisted workflows optimize antibody drug pipeline development in oncology and infectious diseases.

Enhancing Disease Diagnostics through Dual-Mode Profiling Approaches

Immunoprofiling is being leveraged to improve accuracy in disease diagnostics. Dual-mode assays combining serological and cellular response markers support comprehensive disease detection. In oncology, paired detection of autoantibodies and immune cell markers is enhancing early tumor identification. Vaccine research relies on profiling antibody repertoires to assess humoral immunity across a range of pathogens, including SARS-CoV-2. Advanced platforms offer expansive antigen coverage, enabling more precise immune profiling and monitoring.

Accelerated Biotherapeutic Discovery Using High-Throughput Antibody Profiling

High-throughput immunoprofiling is fueling rapid biotherapeutic development. Single-cell sequencing and nanowell screening enable identification of antigen-specific B cells and therapeutic antibody candidates. Microfluidic technologies and multiplex assays allow rapid affinity and epitope specificity assessment, expediting drug discovery. For instance, microfluidic nanowell platforms have isolated high-affinity antibodies targeting viral antigens such as influenza. AI-driven repertoire analysis further enhances candidate selection processes by predicting functional antibody properties.
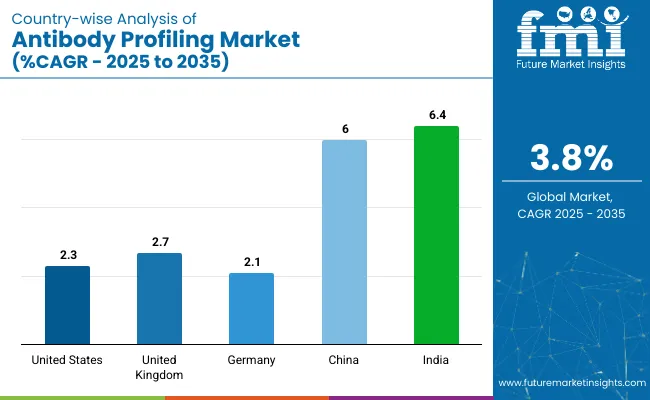
Top Countries Developing, Manufacturing, Adopting, and Commercializing Antibody Profiling Technologies

Country Wise Analysis Of Antibody Profiling Market Cagr 2025 To 2035

Countries CAGR (2025 to 2035)
United States 2.3%
United Kingdom 2.7%
Germany 2.1%
China 6%
India 6.4%

In the global context, the OECD countries, including the United States and Germany, exhibit steady growth in the industry. The United States, with a projected CAGR of 2.3%, shows stable growth, driven by established demand for advanced diagnostic and therapeutic profiling services.

The country's mature healthcare infrastructure and strong biotechnology sector continue to support incremental growth. Germany, at a CAGR of 2.1%, also reflects steady demand, bolstered by its well-established healthcare system and ongoing interest in cutting-edge biotechnology research.

In contrast, the BRICS group, particularly India, is experiencing faster growth, with a projected CAGR of 6.4%. India’s rapid economic development, coupled with increasing disposable incomes and investments in healthcare, is fueling a growing demand for antibody profiling technologies.

The expanding middle class, along with a burgeoning focus on biopharmaceutical advancements, positions India as one of the fastest-growing industries in the sector. Similarly, China is advancing its industry with a projected CAGR of 6%, driven by robust investments in healthcare infrastructure and biotechnological research.

While the OECD countries represent mature industries with steady demand, India’s and China’s growth trajectories underscore the shift toward emerging economies as key drivers of future industry expansion.

The OECD countries continue to contribute to steady demand in the industry, with the USA leading in terms of established infrastructure. India and China in the BRICS group offer the highest growth potential due to their evolving healthcare sectors and increasing investments in biotechnology. Both developed and emerging industries will play crucial roles in shaping the future of the global industry.

United States Antibody Profiling Market Overview

The industry in the United States is projected to grow at a CAGR of 2.3% between 2025 and 2035.

  • Growth is sustained by the country's dominant position in global biopharmaceutical innovation and its extensive clinical research ecosystem. High levels of investment in immuno-oncology and precision diagnostics boost the application in both research and commercial healthcare settings.
  • Institutions such as the NIH and private sector leaders collaborate on biomarker discovery programs, enhancing industry penetration. Demand for high-throughput platforms in translational research further stimulates adoption. The USA continues to lead in clinical trials, positioning itself as the most influential industry for innovation.

United Kingdom Antibody Profiling Market Advancements

The industry in United Kingdom is expanding at a CAGR of 2.7% during the forecast timeframe from 2025 to 2035.

  • Governmental initiatives in genomic research and personalized medicine bolster demand for precise diagnostic tools. The NHS's focus on early disease detection and integration of omics technologies propels usage of antibody-based diagnostics in oncology, autoimmune, and neurodegenerative disorders.
  • Prominent academic institutions collaborate with biotech firms to accelerate innovation. Increased funding under the UK Life Sciences Vision drives platform development. Overall, the UK’s well-integrated healthcare ecosystem and strong emphasis on population health analytics elevate its role in the global landscape.

Germany Antibody Profiling Market Expansion

The industry in Germany grows at a CAGR of 2.1% over the 2025 to 2035 period.

  • Strong federal backing for translational medicine, coupled with an active clinical research network, lays the foundation for expanded usage of technologies. The country's emphasis on biologics and immunotherapies as central pillars of its healthcare innovation strategy aligns with rising biomarker-based diagnostics demand.
  • Academic medical centers and pharma giants collaborate to improve profiling accuracy and throughput. Regulatory initiatives under the German Medical Informatics Initiative further support integration into digital health systems. Germany continues to strengthen its precision medicine capabilities through targeted investments and research-industry linkages.

China Antibody Profiling Market Emerging Trends

China is anticipated to witness robust growth in its industry, registering a CAGR of 6% from 2025 to 2035.

  • Rising investments in biomedical research and national strategies such as Healthy China 2030 provide a strong policy backdrop. Local companies, supported by provincial innovation grants, are scaling up immunoprofiling platforms for early diagnosis and companion diagnostics.
  • International collaborations with leading institutions enable knowledge transfer and platform upgrades. Growing prevalence of cancer and chronic diseases further drives demand. China's expanding biotech workforce and infrastructure make it a major contributor to regional and global antibody-based diagnostic innovation.

India Antibody Profiling Market Growth and Innovations

The industry in India is forecast to grow at the fastest rate, with a projected CAGR of 6.4% from 2025 to 2035.

  • Rising prevalence of non-communicable diseases and a shift toward precision diagnostics fuel industry expansion. National initiatives like Ayushman Bharat Digital Mission promote technology-driven diagnostics across public and private sectors.
  • Domestic biotech firms are scaling operations to meet demand from hospitals and research labs. Increasing penetration of affordable diagnostic kits and academic-industry partnerships are key drivers. Integration of AI and machine learning with workflows is gaining traction. India's strong IT backbone enhances real-time analysis, making it a growth leader globally.

Leading Antibody Profiling Suppliers

The industry features a dynamic and evolving competitive landscape, categorized into dominant, key, and emerging players. Dominant players such as SomaLogic and Infinity Bio lead with high-throughput platforms and proprietary proteomic technologies enabling large-scale immune profiling.

Key players including Rapid Novor, CellFree Sciences, and CDI Labs offer specialized antibody sequencing, epitope mapping, and expression analysis services tailored for clinical and biopharma applications. Emerging players like AZoLifeSciences and Biocopare focus on targeted innovations and cost-effective profiling kits, catering to academic labs and niche research sectors, driving broader adoption and personalized immunological insights across global healthcare and diagnostics industries.

Recent Industry Developments

  • Infinity Bio Series Funding: Infinity Bio successfully closed an USD 8 million Series A round led by Illumina Ventures, with participation from PTX Capital, Blackbird BioVentures, and Propel Baltimore Fund. The company intends to use the funding to enhance its MIPSA™ platform, expand commercial services, and integrate Serimmune’s assets - as confirmed in their June 18, 2025 press release
  • Standard BioTools Launch of KREX™ Antibody Profiling: On November 21, 2024, Standard BioTools (formerly Fluidigm) announced the addition of KREX™ precision immunoprofiling services and kits to its SomaScan™ platform. This expansion enables detection of autoantibody biomarkers and protein interactions for both translational and clinical research use - confirmed by official company communications

Report Scope - Antibody Profiling Market

Report Attributes Details
Industry Size (2025) USD 235.9 billion
Projected Industry Size (2035) USD 342.6 billion
CAGR (2025 to 2035) 3.8%
Base Year for Estimation 2024
Historical Period 2020 to 2024
Projections Period 2025 to 2035
Quantitative Units USD billion for value and number of profiling tests conducted for volume
Service/Platform Types Analyzed (Segment 1) Antibody Response Profiling, Epitope Mapping/Discovery, Histone-Specific Profiling, Antigen Profiling, Immune Monitoring, Serological Test Development
Technologies Analyzed (Segment 2) High-Throughput Protein Microarrays, Luciferase Immunoprecipitation Systems (LIPS), Multi-Antigen Profiling
Applications Analyzed (Segment 3) Therapeutic Antibodies, Vaccine Development, Disease Diagnostics, Biomarker Discovery
Countries Covered United States, Canada, Germany, United Kingdom, France, Italy, Spain, China, India, Japan, South Korea, Australia, Brazil, Mexico, Saudi Arabia, UAE, South Africa
Key Players influencing the Industry Infinity Bio, Rapid Novor , CellFree Sciences Co., Ltd., SomaLogic, AZoLifeSciences, CDI Labs, Biocopare
Additional Attributes Dollar sales, profiling demand across therapeutic R&D and diagnostics, technology adoption in epitope mapping, personalized vaccine design using multiplex platforms, academic vs commercial profiling trends

Key Players

  • Infinity Bio
  • Rapid Novor
  • CellFree Sciences Co.,Ltd.
  • SomaLogic
  • AZoLifeSciences
  • CDI Labs
  • Biocopare

Key Segments Studied in Antibody Profiling Market

By Service/Platform Type:

By service/platform type, the industry is segmented into Antibody Response Profiling, Epitope Mapping/Discovery, Histone-Specific Profiling, Antigen Profiling, Immune Monitoring, and Serological Test Development.

By Technology:

By technology, the industry includes High-Throughput Protein Microarrays, Luciferase Immunoprecipitation Systems (LIPS), and Multi-Antigen Profiling.

By Application:

By application, the industry is segmented into Therapeutic Antibodies, Vaccine Development, Disease Diagnostics, and Biomarker Discovery.

By Region:

By region, the industry is categorized into North America, Latin America, East Asia, South Asia & Pacific, Western Europe, Eastern Europe, and Middle East & Africa.

Table of Content

  1. Executive Summary
    • Global Market Outlook
    • Demand-side Trends
    • Supply-side Trends
    • Technology Roadmap Analysis
    • Analysis and Recommendations
  2. Market Overview
    • Market Coverage / Taxonomy
    • Market Definition / Scope / Limitations
  3. Market Background
    • Market Dynamics
      • Drivers
      • Restraints
      • Opportunity
      • Trends
    • Scenario Forecast
      • Demand in Optimistic Scenario
      • Demand in Likely Scenario
      • Demand in Conservative Scenario
    • Opportunity Map Analysis
    • Product Life Cycle Analysis
    • Supply Chain Analysis
      • Supply Side Participants and their Roles
        • Producers
        • Mid-Level Participants (Traders/ Agents/ Brokers)
        • Wholesalers and Distributors
      • Value Added and Value Created at Node in the Supply Chain
      • List of Raw Material Suppliers
      • List of Existing and Potential Buyer’s
    • Investment Feasibility Matrix
    • Value Chain Analysis
      • Profit Margin Analysis
      • Wholesalers and Distributors
      • Retailers
    • PESTLE and Porter’s Analysis
    • Regulatory Landscape
      • By Key Regions
      • By Key Countries
    • Regional Parent Market Outlook
    • Production and Consumption Statistics
    • Import and Export Statistics
  4. Global Market Analysis 2020 to 2024 and Forecast, 2025 to 2035
    • Historical Market Size Value (USD Billion) & Volume (number of profiling tests conducted) Analysis, 2020 to 2024
    • Current and Future Market Size Value (USD Billion) & Volume (number of profiling tests conducted) Projections, 2025 to 2035
      • Y-o-Y Growth Trend Analysis
      • Absolute $ Opportunity Analysis
  5. Global Market Pricing Analysis 2020 to 2024 and Forecast 2025 to 2035
  6. Global Market Analysis 2020 to 2024 and Forecast 2025 to 2035, By Service/Platform Type
    • Introduction / Key Findings
    • Historical Market Size Value (USD Billion) & Volume (number of profiling tests conducted) Analysis By Service/Platform Type, 2020 to 2024
    • Current and Future Market Size Value (USD Billion) & Volume (number of profiling tests conducted) Analysis and Forecast By Service/Platform Type, 2025 to 2035
      • Antibody Response Profiling
      • Epitope Mapping/Discovery
      • Histone-Specific Profiling
      • Antigen Profiling
      • Immune Monitoring
      • Serological Test Development
    • Y-o-Y Growth Trend Analysis By Service/Platform Type, 2020 to 2024
    • Absolute $ Opportunity Analysis By Service/Platform Type, 2025 to 2035
  7. Global Market Analysis 2020 to 2024 and Forecast 2025 to 2035, By Technology
    • Introduction / Key Findings
    • Historical Market Size Value (USD Billion) & Volume (number of profiling tests conducted) Analysis By Technology, 2020 to 2024
    • Current and Future Market Size Value (USD Billion) & Volume (number of profiling tests conducted) Analysis and Forecast By Technology, 2025 to 2035
      • High-Throughput Protein Microarrays
      • Luciferase Immunoprecipitation Systems (LIPS)
      • Multi-Antigen Profiling
    • Y-o-Y Growth Trend Analysis By Technology, 2020 to 2024
    • Absolute $ Opportunity Analysis By Technology, 2025 to 2035
  8. Global Market Analysis 2020 to 2024 and Forecast 2025 to 2035, By Application
    • Introduction / Key Findings
    • Historical Market Size Value (USD Billion) & Volume (number of profiling tests conducted) Analysis By Application, 2020 to 2024
    • Current and Future Market Size Value (USD Billion) & Volume (number of profiling tests conducted) Analysis and Forecast By Application, 2025 to 2035
      • Therapeutic Antibodies
      • Vaccine Development
      • Disease Diagnostics
      • Biomarker Discovery
    • Y-o-Y Growth Trend Analysis By Application, 2020 to 2024
    • Absolute $ Opportunity Analysis By Application, 2025 to 2035
  9. Global Market Analysis 2020 to 2024 and Forecast 2025 to 2035, By Region
    • Introduction
    • Historical Market Size Value (USD Billion) & Volume (number of profiling tests conducted) Analysis By Region, 2020 to 2024
    • Current Market Size Value (USD Billion) & Volume (number of profiling tests conducted) Analysis and Forecast By Region, 2025 to 2035
      • North America
      • Latin America
      • Western Europe
      • Eastern Europe
      • East Asia
      • South Asia & Pacific
      • Middle East and Africa
    • Market Attractiveness Analysis By Region
  10. North America Market Analysis 2020 to 2024 and Forecast 2025 to 2035, By Country
    • Historical Market Size Value (USD Billion) & Volume (number of profiling tests conducted) Trend Analysis By Market Taxonomy, 2020 to 2024
    • Market Size Value (USD Billion) & Volume (number of profiling tests conducted) Forecast By Market Taxonomy, 2025 to 2035
      • By Country
        • USA
        • Canada
        • Mexico
      • By Service/Platform Type
      • By Technology
      • By Application
    • Market Attractiveness Analysis
      • By Country
      • By Service/Platform Type
      • By Technology
      • By Application
    • Key Takeaways
  11. Latin America Market Analysis 2020 to 2024 and Forecast 2025 to 2035, By Country
    • Historical Market Size Value (USD Billion) & Volume (number of profiling tests conducted) Trend Analysis By Market Taxonomy, 2020 to 2024
    • Market Size Value (USD Billion) & Volume (number of profiling tests conducted) Forecast By Market Taxonomy, 2025 to 2035
      • By Country
        • Brazil
        • Argentina
        • Rest of LATAM
      • By Service/Platform Type
      • By Technology
      • By Application
    • Market Attractiveness Analysis
      • By Country
      • By Service/Platform Type
      • By Technology
      • By Application
    • Key Takeaways
  12. Western Europe Market Analysis 2020 to 2024 and Forecast 2025 to 2035, By Country
    • Historical Market Size Value (USD Billion) & Volume (number of profiling tests conducted) Trend Analysis By Market Taxonomy, 2020 to 2024
    • Market Size Value (USD Billion) & Volume (number of profiling tests conducted) Forecast By Market Taxonomy, 2025 to 2035
      • By Country
        • Germany
        • Italy
        • France
        • UK
        • Spain
        • BENELUX
        • Nordic
        • Rest of W. Europe
      • By Service/Platform Type
      • By Technology
      • By Application
    • Market Attractiveness Analysis
      • By Country
      • By Service/Platform Type
      • By Technology
      • By Application
    • Key Takeaways
  13. Eastern Europe Market Analysis 2020 to 2024 and Forecast 2025 to 2035, By Country
    • Historical Market Size Value (USD Billion) & Volume (number of profiling tests conducted) Trend Analysis By Market Taxonomy, 2020 to 2024
    • Market Size Value (USD Billion) & Volume (number of profiling tests conducted) Forecast By Market Taxonomy, 2025 to 2035
      • By Country
        • Russia
        • Hungary
        • Poland
        • Balkan & Baltics
        • Rest of E. Europe
      • By Service/Platform Type
      • By Technology
      • By Application
    • Market Attractiveness Analysis
      • By Country
      • By Service/Platform Type
      • By Technology
      • By Application
    • Key Takeaways
  14. East Asia Market Analysis 2020 to 2024 and Forecast 2025 to 2035, By Country
    • Historical Market Size Value (USD Billion) & Volume (number of profiling tests conducted) Trend Analysis By Market Taxonomy, 2020 to 2024
    • Market Size Value (USD Billion) & Volume (number of profiling tests conducted) Forecast By Market Taxonomy, 2025 to 2035
      • By Country
        • China
        • Japan
        • South Korea
      • By Service/Platform Type
      • By Technology
      • By Application
    • Market Attractiveness Analysis
      • By Country
      • By Service/Platform Type
      • By Technology
      • By Application
    • Key Takeaways
  15. South Asia & Pacific Market Analysis 2020 to 2024 and Forecast 2025 to 2035, By Country
    • Historical Market Size Value (USD Billion) & Volume (number of profiling tests conducted) Trend Analysis By Market Taxonomy, 2020 to 2024
    • Market Size Value (USD Billion) & Volume (number of profiling tests conducted) Forecast By Market Taxonomy, 2025 to 2035
      • By Country
        • India
        • Australia & New Zealand
        • ASEAN
        • Rest of SAP
      • By Service/Platform Type
      • By Technology
      • By Application
    • Market Attractiveness Analysis
      • By Country
      • By Service/Platform Type
      • By Technology
      • By Application
    • Key Takeaways
  16. Middle East and Africa Market Analysis 2020 to 2024 and Forecast 2025 to 2035, By Country
    • Historical Market Size Value (USD Billion) & Volume (number of profiling tests conducted) Trend Analysis By Market Taxonomy, 2020 to 2024
    • Market Size Value (USD Billion) & Volume (number of profiling tests conducted) Forecast By Market Taxonomy, 2025 to 2035
      • By Country
        • GCC Countries
        • Northern Africa
        • South Africa
        • Turkiye
        • Rest of MEA
      • By Service/Platform Type
      • By Technology
      • By Application
    • Market Attractiveness Analysis
      • By Country
      • By Service/Platform Type
      • By Technology
      • By Application
    • Key Takeaways
  17. Key Countries Market Analysis
    • USA
      • Pricing Analysis
      • Market Share Analysis, 2024
        • By Service/Platform Type
        • By Technology
        • By Application
    • Canada
      • Pricing Analysis
      • Market Share Analysis, 2024
        • By Service/Platform Type
        • By Technology
        • By Application
    • Brazil
      • Pricing Analysis
      • Market Share Analysis, 2024
        • By Service/Platform Type
        • By Technology
        • By Application
    • Mexico
      • Pricing Analysis
      • Market Share Analysis, 2024
        • By Service/Platform Type
        • By Technology
        • By Application
    • Argentina
      • Pricing Analysis
      • Market Share Analysis, 2024
        • By Service/Platform Type
        • By Technology
        • By Application
  18. Market Structure Analysis
    • Competition Dashboard
    • Competition Benchmarking
    • Market Share Analysis of Top Players
      • By Regional
      • By Service/Platform Type
      • By Technology
      • By Application
  19. Competition Analysis
    • Competition Deep Dive
      • Infinity Bio
        • Overview
        • Product Portfolio
        • Profitability by Market Segments (Product/Age /Sales Channel/Region)
        • Sales Footprint
        • Strategy Overview
          • Marketing Strategy
          • Product Strategy
          • Channel Strategy
      • Rapid Novor
        • Overview
        • Product Portfolio
        • Profitability by Market Segments (Product/Age /Sales Channel/Region)
        • Sales Footprint
        • Strategy Overview
          • Marketing Strategy
          • Product Strategy
          • Channel Strategy
      • CellFree Sciences Co.,Ltd.
        • Overview
        • Product Portfolio
        • Profitability by Market Segments (Product/Age /Sales Channel/Region)
        • Sales Footprint
        • Strategy Overview
          • Marketing Strategy
          • Product Strategy
          • Channel Strategy
      • SomaLogic
        • Overview
        • Product Portfolio
        • Profitability by Market Segments (Product/Age /Sales Channel/Region)
        • Sales Footprint
        • Strategy Overview
          • Marketing Strategy
          • Product Strategy
          • Channel Strategy
      • AZoLifeSciences
        • Overview
        • Product Portfolio
        • Profitability by Market Segments (Product/Age /Sales Channel/Region)
        • Sales Footprint
        • Strategy Overview
          • Marketing Strategy
          • Product Strategy
          • Channel Strategy
      • CDI Labs
        • Overview
        • Product Portfolio
        • Profitability by Market Segments (Product/Age /Sales Channel/Region)
        • Sales Footprint
        • Strategy Overview
          • Marketing Strategy
          • Product Strategy
          • Channel Strategy
      • Biocopare
        • Overview
        • Product Portfolio
        • Profitability by Market Segments (Product/Age /Sales Channel/Region)
        • Sales Footprint
        • Strategy Overview
          • Marketing Strategy
          • Product Strategy
          • Channel Strategy
  20. Assumptions & Acronyms Used
  21. Research Methodology

List of Tables

  • Table 1: Global Market Value (USD Billion) Forecast by Region, 2020 to 2035
  • Table 2: Global Market Volume (number of profiling tests conducted) Forecast by Region, 2020 to 2035
  • Table 3: Global Market Value (USD Billion) Forecast by Service/Platform Type, 2020 to 2035
  • Table 4: Global Market Volume (number of profiling tests conducted) Forecast by Service/Platform Type, 2020 to 2035
  • Table 5: Global Market Value (USD Billion) Forecast by Technology, 2020 to 2035
  • Table 6: Global Market Volume (number of profiling tests conducted) Forecast by Technology, 2020 to 2035
  • Table 7: Global Market Value (USD Billion) Forecast by Application, 2020 to 2035
  • Table 8: Global Market Volume (number of profiling tests conducted) Forecast by Application, 2020 to 2035
  • Table 9: North America Market Value (USD Billion) Forecast by Country, 2020 to 2035
  • Table 10: North America Market Volume (number of profiling tests conducted) Forecast by Country, 2020 to 2035
  • Table 11: North America Market Value (USD Billion) Forecast by Service/Platform Type, 2020 to 2035
  • Table 12: North America Market Volume (number of profiling tests conducted) Forecast by Service/Platform Type, 2020 to 2035
  • Table 13: North America Market Value (USD Billion) Forecast by Technology, 2020 to 2035
  • Table 14: North America Market Volume (number of profiling tests conducted) Forecast by Technology, 2020 to 2035
  • Table 15: North America Market Value (USD Billion) Forecast by Application, 2020 to 2035
  • Table 16: North America Market Volume (number of profiling tests conducted) Forecast by Application, 2020 to 2035
  • Table 17: Latin America Market Value (USD Billion) Forecast by Country, 2020 to 2035
  • Table 18: Latin America Market Volume (number of profiling tests conducted) Forecast by Country, 2020 to 2035
  • Table 19: Latin America Market Value (USD Billion) Forecast by Service/Platform Type, 2020 to 2035
  • Table 20: Latin America Market Volume (number of profiling tests conducted) Forecast by Service/Platform Type, 2020 to 2035
  • Table 21: Latin America Market Value (USD Billion) Forecast by Technology, 2020 to 2035
  • Table 22: Latin America Market Volume (number of profiling tests conducted) Forecast by Technology, 2020 to 2035
  • Table 23: Latin America Market Value (USD Billion) Forecast by Application, 2020 to 2035
  • Table 24: Latin America Market Volume (number of profiling tests conducted) Forecast by Application, 2020 to 2035
  • Table 25: Western Europe Market Value (USD Billion) Forecast by Country, 2020 to 2035
  • Table 26: Western Europe Market Volume (number of profiling tests conducted) Forecast by Country, 2020 to 2035
  • Table 27: Western Europe Market Value (USD Billion) Forecast by Service/Platform Type, 2020 to 2035
  • Table 28: Western Europe Market Volume (number of profiling tests conducted) Forecast by Service/Platform Type, 2020 to 2035
  • Table 29: Western Europe Market Value (USD Billion) Forecast by Technology, 2020 to 2035
  • Table 30: Western Europe Market Volume (number of profiling tests conducted) Forecast by Technology, 2020 to 2035
  • Table 31: Western Europe Market Value (USD Billion) Forecast by Application, 2020 to 2035
  • Table 32: Western Europe Market Volume (number of profiling tests conducted) Forecast by Application, 2020 to 2035
  • Table 33: Eastern Europe Market Value (USD Billion) Forecast by Country, 2020 to 2035
  • Table 34: Eastern Europe Market Volume (number of profiling tests conducted) Forecast by Country, 2020 to 2035
  • Table 35: Eastern Europe Market Value (USD Billion) Forecast by Service/Platform Type, 2020 to 2035
  • Table 36: Eastern Europe Market Volume (number of profiling tests conducted) Forecast by Service/Platform Type, 2020 to 2035
  • Table 37: Eastern Europe Market Value (USD Billion) Forecast by Technology, 2020 to 2035
  • Table 38: Eastern Europe Market Volume (number of profiling tests conducted) Forecast by Technology, 2020 to 2035
  • Table 39: Eastern Europe Market Value (USD Billion) Forecast by Application, 2020 to 2035
  • Table 40: Eastern Europe Market Volume (number of profiling tests conducted) Forecast by Application, 2020 to 2035
  • Table 41: East Asia Market Value (USD Billion) Forecast by Country, 2020 to 2035
  • Table 42: East Asia Market Volume (number of profiling tests conducted) Forecast by Country, 2020 to 2035
  • Table 43: East Asia Market Value (USD Billion) Forecast by Service/Platform Type, 2020 to 2035
  • Table 44: East Asia Market Volume (number of profiling tests conducted) Forecast by Service/Platform Type, 2020 to 2035
  • Table 45: East Asia Market Value (USD Billion) Forecast by Technology, 2020 to 2035
  • Table 46: East Asia Market Volume (number of profiling tests conducted) Forecast by Technology, 2020 to 2035
  • Table 47: East Asia Market Value (USD Billion) Forecast by Application, 2020 to 2035
  • Table 48: East Asia Market Volume (number of profiling tests conducted) Forecast by Application, 2020 to 2035
  • Table 49: South Asia & Pacific Market Value (USD Billion) Forecast by Country, 2020 to 2035
  • Table 50: South Asia & Pacific Market Volume (number of profiling tests conducted) Forecast by Country, 2020 to 2035
  • Table 51: South Asia & Pacific Market Value (USD Billion) Forecast by Service/Platform Type, 2020 to 2035
  • Table 52: South Asia & Pacific Market Volume (number of profiling tests conducted) Forecast by Service/Platform Type, 2020 to 2035
  • Table 53: South Asia & Pacific Market Value (USD Billion) Forecast by Technology, 2020 to 2035
  • Table 54: South Asia & Pacific Market Volume (number of profiling tests conducted) Forecast by Technology, 2020 to 2035
  • Table 55: South Asia & Pacific Market Value (USD Billion) Forecast by Application, 2020 to 2035
  • Table 56: South Asia & Pacific Market Volume (number of profiling tests conducted) Forecast by Application, 2020 to 2035
  • Table 57: Middle East and Africa Market Value (USD Billion) Forecast by Country, 2020 to 2035
  • Table 58: Middle East and Africa Market Volume (number of profiling tests conducted) Forecast by Country, 2020 to 2035
  • Table 59: Middle East and Africa Market Value (USD Billion) Forecast by Service/Platform Type, 2020 to 2035
  • Table 60: Middle East and Africa Market Volume (number of profiling tests conducted) Forecast by Service/Platform Type, 2020 to 2035
  • Table 61: Middle East and Africa Market Value (USD Billion) Forecast by Technology, 2020 to 2035
  • Table 62: Middle East and Africa Market Volume (number of profiling tests conducted) Forecast by Technology, 2020 to 2035
  • Table 63: Middle East and Africa Market Value (USD Billion) Forecast by Application, 2020 to 2035
  • Table 64: Middle East and Africa Market Volume (number of profiling tests conducted) Forecast by Application, 2020 to 2035

List of Figures

  • Figure 1: Global Market Volume (number of profiling tests conducted) Forecast 2020 to 2035
  • Figure 2: Global Market Pricing Analysis
  • Figure 3: Global Market Value (USD Billion) Forecast 2020 to 2035
  • Figure 4: Global Market Value Share and BPS Analysis by Service/Platform Type, 2025 and 2035
  • Figure 5: Global Market Y-o-Y Growth Comparison by Service/Platform Type, 2025 to 2035
  • Figure 6: Global Market Attractiveness Analysis by Service/Platform Type
  • Figure 7: Global Market Value Share and BPS Analysis by Technology, 2025 and 2035
  • Figure 8: Global Market Y-o-Y Growth Comparison by Technology, 2025 to 2035
  • Figure 9: Global Market Attractiveness Analysis by Technology
  • Figure 10: Global Market Value Share and BPS Analysis by Application, 2025 and 2035
  • Figure 11: Global Market Y-o-Y Growth Comparison by Application, 2025 to 2035
  • Figure 12: Global Market Attractiveness Analysis by Application
  • Figure 13: Global Market Value (USD Billion) Share and BPS Analysis by Region, 2025 and 2035
  • Figure 14: Global Market Y-o-Y Growth Comparison by Region, 2025 to 2035
  • Figure 15: Global Market Attractiveness Analysis by Region
  • Figure 16: North America Market Incremental $ Opportunity, 2025 to 2035
  • Figure 17: Latin America Market Incremental $ Opportunity, 2025 to 2035
  • Figure 18: Western Europe Market Incremental $ Opportunity, 2025 to 2035
  • Figure 19: Eastern Europe Market Incremental $ Opportunity, 2025 to 2035
  • Figure 20: East Asia Market Incremental $ Opportunity, 2025 to 2035
  • Figure 21: South Asia & Pacific Market Incremental $ Opportunity, 2025 to 2035
  • Figure 22: Middle East and Africa Market Incremental $ Opportunity, 2025 to 2035
  • Figure 23: North America Market Value Share and BPS Analysis by Country, 2025 and 2035
  • Figure 24: North America Market Value Share and BPS Analysis by Service/Platform Type, 2025 and 2035
  • Figure 25: North America Market Y-o-Y Growth Comparison by Service/Platform Type, 2025 to 2035
  • Figure 26: North America Market Attractiveness Analysis by Service/Platform Type
  • Figure 27: North America Market Value Share and BPS Analysis by Technology, 2025 and 2035
  • Figure 28: North America Market Y-o-Y Growth Comparison by Technology, 2025 to 2035
  • Figure 29: North America Market Attractiveness Analysis by Technology
  • Figure 30: North America Market Value Share and BPS Analysis by Application, 2025 and 2035
  • Figure 31: North America Market Y-o-Y Growth Comparison by Application, 2025 to 2035
  • Figure 32: North America Market Attractiveness Analysis by Application
  • Figure 33: Latin America Market Value Share and BPS Analysis by Country, 2025 and 2035
  • Figure 34: Latin America Market Value Share and BPS Analysis by Service/Platform Type, 2025 and 2035
  • Figure 35: Latin America Market Y-o-Y Growth Comparison by Service/Platform Type, 2025 to 2035
  • Figure 36: Latin America Market Attractiveness Analysis by Service/Platform Type
  • Figure 37: Latin America Market Value Share and BPS Analysis by Technology, 2025 and 2035
  • Figure 38: Latin America Market Y-o-Y Growth Comparison by Technology, 2025 to 2035
  • Figure 39: Latin America Market Attractiveness Analysis by Technology
  • Figure 40: Latin America Market Value Share and BPS Analysis by Application, 2025 and 2035
  • Figure 41: Latin America Market Y-o-Y Growth Comparison by Application, 2025 to 2035
  • Figure 42: Latin America Market Attractiveness Analysis by Application
  • Figure 43: Western Europe Market Value Share and BPS Analysis by Country, 2025 and 2035
  • Figure 44: Western Europe Market Value Share and BPS Analysis by Service/Platform Type, 2025 and 2035
  • Figure 45: Western Europe Market Y-o-Y Growth Comparison by Service/Platform Type, 2025 to 2035
  • Figure 46: Western Europe Market Attractiveness Analysis by Service/Platform Type
  • Figure 47: Western Europe Market Value Share and BPS Analysis by Technology, 2025 and 2035
  • Figure 48: Western Europe Market Y-o-Y Growth Comparison by Technology, 2025 to 2035
  • Figure 49: Western Europe Market Attractiveness Analysis by Technology
  • Figure 50: Western Europe Market Value Share and BPS Analysis by Application, 2025 and 2035
  • Figure 51: Western Europe Market Y-o-Y Growth Comparison by Application, 2025 to 2035
  • Figure 52: Western Europe Market Attractiveness Analysis by Application
  • Figure 53: Eastern Europe Market Value Share and BPS Analysis by Country, 2025 and 2035
  • Figure 54: Eastern Europe Market Value Share and BPS Analysis by Service/Platform Type, 2025 and 2035
  • Figure 55: Eastern Europe Market Y-o-Y Growth Comparison by Service/Platform Type, 2025 to 2035
  • Figure 56: Eastern Europe Market Attractiveness Analysis by Service/Platform Type
  • Figure 57: Eastern Europe Market Value Share and BPS Analysis by Technology, 2025 and 2035
  • Figure 58: Eastern Europe Market Y-o-Y Growth Comparison by Technology, 2025 to 2035
  • Figure 59: Eastern Europe Market Attractiveness Analysis by Technology
  • Figure 60: Eastern Europe Market Value Share and BPS Analysis by Application, 2025 and 2035
  • Figure 61: Eastern Europe Market Y-o-Y Growth Comparison by Application, 2025 to 2035
  • Figure 62: Eastern Europe Market Attractiveness Analysis by Application
  • Figure 63: East Asia Market Value Share and BPS Analysis by Country, 2025 and 2035
  • Figure 64: East Asia Market Value Share and BPS Analysis by Service/Platform Type, 2025 and 2035
  • Figure 65: East Asia Market Y-o-Y Growth Comparison by Service/Platform Type, 2025 to 2035
  • Figure 66: East Asia Market Attractiveness Analysis by Service/Platform Type
  • Figure 67: East Asia Market Value Share and BPS Analysis by Technology, 2025 and 2035
  • Figure 68: East Asia Market Y-o-Y Growth Comparison by Technology, 2025 to 2035
  • Figure 69: East Asia Market Attractiveness Analysis by Technology
  • Figure 70: East Asia Market Value Share and BPS Analysis by Application, 2025 and 2035
  • Figure 71: East Asia Market Y-o-Y Growth Comparison by Application, 2025 to 2035
  • Figure 72: East Asia Market Attractiveness Analysis by Application
  • Figure 73: South Asia & Pacific Market Value Share and BPS Analysis by Country, 2025 and 2035
  • Figure 74: South Asia & Pacific Market Value Share and BPS Analysis by Service/Platform Type, 2025 and 2035
  • Figure 75: South Asia & Pacific Market Y-o-Y Growth Comparison by Service/Platform Type, 2025 to 2035
  • Figure 76: South Asia & Pacific Market Attractiveness Analysis by Service/Platform Type
  • Figure 77: South Asia & Pacific Market Value Share and BPS Analysis by Technology, 2025 and 2035
  • Figure 78: South Asia & Pacific Market Y-o-Y Growth Comparison by Technology, 2025 to 2035
  • Figure 79: South Asia & Pacific Market Attractiveness Analysis by Technology
  • Figure 80: South Asia & Pacific Market Value Share and BPS Analysis by Application, 2025 and 2035
  • Figure 81: South Asia & Pacific Market Y-o-Y Growth Comparison by Application, 2025 to 2035
  • Figure 82: South Asia & Pacific Market Attractiveness Analysis by Application
  • Figure 83: Middle East and Africa Market Value Share and BPS Analysis by Country, 2025 and 2035
  • Figure 84: Middle East and Africa Market Value Share and BPS Analysis by Service/Platform Type, 2025 and 2035
  • Figure 85: Middle East and Africa Market Y-o-Y Growth Comparison by Service/Platform Type, 2025 to 2035
  • Figure 86: Middle East and Africa Market Attractiveness Analysis by Service/Platform Type
  • Figure 87: Middle East and Africa Market Value Share and BPS Analysis by Technology, 2025 and 2035
  • Figure 88: Middle East and Africa Market Y-o-Y Growth Comparison by Technology, 2025 to 2035
  • Figure 89: Middle East and Africa Market Attractiveness Analysis by Technology
  • Figure 90: Middle East and Africa Market Value Share and BPS Analysis by Application, 2025 and 2035
  • Figure 91: Middle East and Africa Market Y-o-Y Growth Comparison by Application, 2025 to 2035
  • Figure 92: Middle East and Africa Market Attractiveness Analysis by Application
  • Figure 93: Global Market - Tier Structure Analysis
  • Figure 94: Global Market - Company Share Analysis

Frequently Asked Questions

What is the estimated value of the antibody profiling market in 2025?

The industry is projected to be valued at USD 235.9 billion in 2025.

What is the forecasted size of the antibody profiling market by 2035?

The industry is expected to reach USD 342.6 billion by 2035.

What is the projected CAGR for the antibody profiling market from 2025 to 2035?

The industry is anticipated to grow at a CAGR of 3.8% during the forecast period.

Which technology segment leads the antibody profiling market in 2025?

High-throughput protein microarrays dominate the industry with a 45.5% share in 2025.

Who is the leading player in the antibody profiling market?

SomaLogic leads the industry with a 12% market share.

Explore Similar Insights

Future Market Insights

Antibody Profiling Market