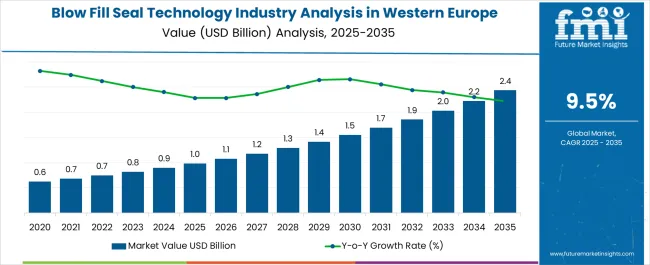
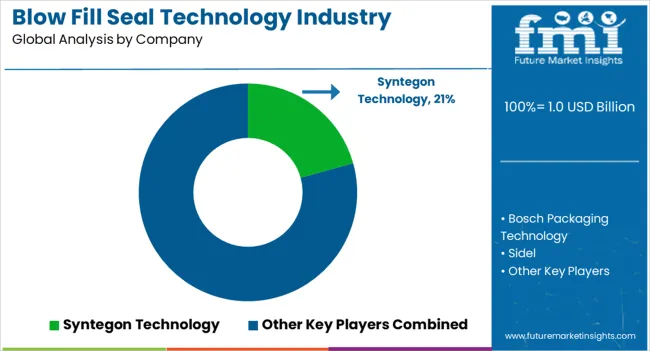
Adoption of blow fill seal (BFS) technology in Western Europe is poised to reach USD 819.8 million in 2023. The sales outlook for BFS technology in Western Europe is exceptionally promising, as the industry is projected to exhibit a CAGR of 9.5% between 2023 and 2033. The demand in Western Europe is driven by the pharmaceutical and healthcare sectors' need for advanced and efficient packaging solutions.
Companies find lucrative technological opportunities due to their superior aseptic packaging capabilities, aligning with the industry's focus on product safety and quality. The opportunity is poised to drive sales beyond the USD 2,026.9 million mark by 2033. BFS technology suppliers and investors can capitalize on this demand surge by investing in research and development to enhance product adaptability to varying product requirements.
Attributes | Details |
---|---|
Industry size of Western Europe in 2023 | USD 819.8 million |
Expected Industry Size of Western Europe by 2033 | USD 2,026.9 million |
Forecasted CAGR between 2023 to 2033 | 9.5% |
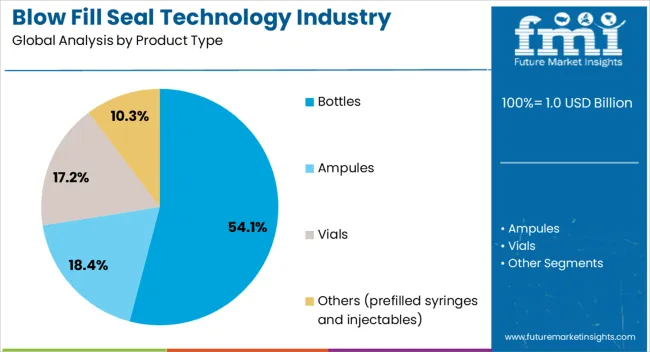
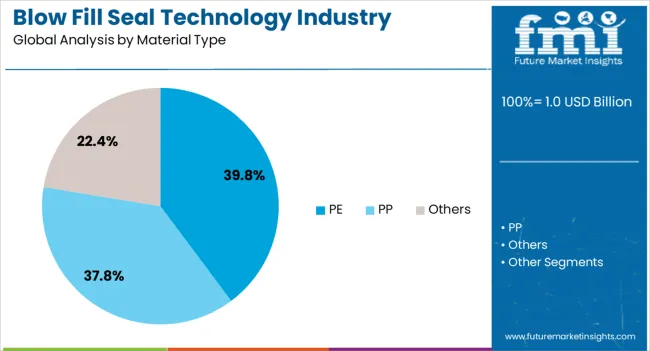
This section provides category-wise insights into the adoption of blow fill seal technology, categorized by dominant product type and primary material choice. Notably, bottles emerged as the dominant product category and Polyethylene (PE) is the leading material choice in the blow fill seal (BFS) technology industry in Western Europe.
Dominating Blow Fill Seal (BFS) Technology based on Product | Bottles |
---|---|
Value Share in 2023 | USD 113.1 million |
CAGR from 2023 to 2033 | 8.2% |
Bottles dominate the blow fill seal technology sales outlook, capturing a substantial value share of USD 113.1 million in 2023. With a projected CAGR of 8.2% from 2023 to 2033, the bottles segment is poised for sustained expansion, making it an attractive prospect for manufacturers and investors.
Top Material for Blow Fill Seal (BFS) Technology Adoption in Western Europe | PE |
---|---|
Value Share in 2023 | USD 498.9 million |
CAGR from 2023 to 2033 | 9.4% |
Polyethylene (PE) emerges as the preferred material for blow fill seal (BFS) technology manufacturing in Western Europe, commanding a substantial value share of USD 498.9 million in 2023.
The projected CAGR of 9.4% from 2023 to 2033 signifies the sustained demand for PE in the BFS technology sector, presenting compelling opportunities for industry stakeholders.
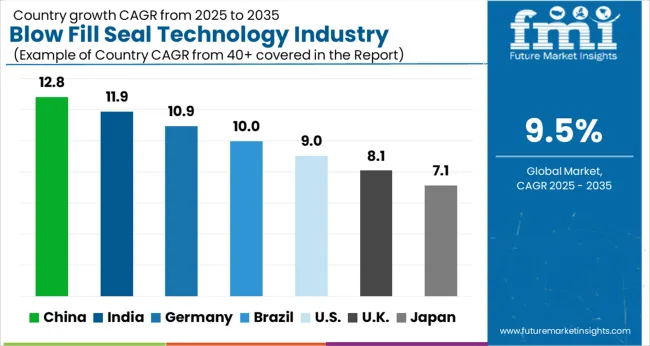
This section talks about blow fill seal (BFS) technology adoption in specific countries. Each country's analysis covers distinct trends and growth factors. From Spain's sustainable packaging preferences to the United Kingdom's commitment to healthcare, a comprehensive outlook is presented.
These insights equip suppliers or investors with a deep understanding of the BFS technology trends in each country, enabling informed decision-making and strategic entry.
Attribute | Value |
---|---|
Industry Size in 2023 | USD 84.6 million |
CAGR from 2023 to 2033 | 9.0% |
The blow fill seal technology sales outlook in Spain exhibits remarkable potential, surpassing USD 84.6 million in 2023. The demand for BFS technology is anticipated to rise at 9.0% in Spain through 2033.
Attribute | Value |
---|---|
Industry Size in 2023 | USD 124.4 million |
CAGR from 2023 to 2033 | 10.2% |
Italy's blow fill seal technology sector is thriving, with the sales outlook likely to surpass USD 124.4 million in 2023. The projected CAGR of 10.2% from 2023 to 2033 indicates substantial growth potential, attracting manufacturers and investors.
Attribute | Value |
---|---|
Industry Size in 2023 | USD 210.0 million |
CAGR from 2023 to 2033 | 9.7% |
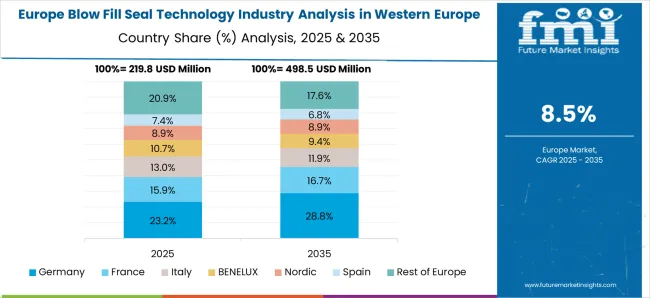
Germany's blow fill seal technology sector demonstrates substantial revenue growth, crossing USD 210 million in 2023. A projected CAGR of 9.7% from 2023 to 2033 signifies sustained growth potential, making Germany a lucrative industry.
Attribute | Value |
---|---|
Industry Size in 2023 | USD 165.7 million |
CAGR from 2023 to 2033 | 9.0% |
The United Kingdom embraces blow fill seal technology solutions with a valuation of USD 165.7 million in 2023. A projected CAGR of 9.0% from 2023 to 2033 indicates a favorable demand outlook, attracting industry players.
Attribute | Value |
---|---|
Industry Size in 2023 | USD 17.7 million |
CAGR from 2023 to 2033 | 8.7% |
Benelux exhibits sustainable growth in blow fill seal technology, accounting for USD 17.7 million in 2023. However, a projected CAGR of 8.7% from 2023 to 2033 signifies hidden growth potential, making Benelux an appealing investment option.
Attribute | Value |
---|---|
Industry Size in 2023 | USD 150.5 million |
CAGR from 2023 to 2033 | 10.0% |
The BFS technology demand in France is anticipated to witness robust growth, boasting a noteworthy CAGR of 10.0% from 2023 to 2033. Currently valued at USD 150.5 million, the sales are expected to soar to USD 372.9 million by 2033.
The blow fill seal (BFS) technology demand in Western Europe makes the region a field where key players continually strive to maintain their dominance.
Leading companies like Rommelag, Unither Pharmaceuticals, and Weiler Engineering, Inc. have etched their names in the annals of BFS technology. They leverage their extensive experience and technological prowess to lead the charge.
New entrants such as Catalent, Inc. and Recipharm AB are disrupting the status quo. Their innovative solutions and nimble approaches aim to reshape the landscape.
Established players invest heavily in research and development to stay ahead. Continuous innovation, such as the integration of IoT for predictive maintenance, ensures they offer cutting-edge solutions.
Recent Developments Observed in Blow Fill Seal (BFS) Technology Adoption in Western Europe
Attribute | Details |
---|---|
Estimated Industry Size in 2023 | USD 819.8 million |
Projected Industry Size in 2033 | USD 2,026.9 million |
Anticipated CAGR between 2023 to 2033 | 9.5% CAGR |
Historical Analysis of Demand for Blow Fill Seal (BFS) Technology in Western Europe | 2018 to 2022 |
Demand Forecast for Blow Fill Seal (BFS) Technology in Western Europe | 2023 to 2033 |
Report Coverage | Industry Size, Industry Trends, Analysis of key factors influencing blow fill seal (BFS) technology adoption in Western Europe, Insights on Global Players and their Industry Strategy in Western Europe, Ecosystem Analysis of Local and Regional Western Europe Manufacturers |
Key Countries Analyzed while Studying Opportunities in Blow Fill Seal (BFS) Technology in Western Europe | Spain, Italy, Germany, United Kingdom, Benelux, France, Nordic |
Key Companies Profiled | Bosch Packaging Technology; Sidel; Krones; GEA Group; Tetra Pak; SIG; Illig Maschinenbau; Rommelag Vacuum Technology; Schubert Verpackungsmaschinen; Harro Höfliger; Syntegon Technology; IMA Group |
Table 1: Industry Analysis and Outlook Value (US$ Million) Forecast by Country, 2018 to 2033
Table 2: Industry Analysis and Outlook Volume (Units) Forecast by Country, 2018 to 2033
Table 3: Industry Analysis and Outlook Value (US$ Million) Forecast by Product Type, 2018 to 2033
Table 4: Industry Analysis and Outlook Volume (Units) Forecast by Product Type, 2018 to 2033
Table 5: Industry Analysis and Outlook Value (US$ Million) Forecast by Material Type, 2018 to 2033
Table 6: Industry Analysis and Outlook Volume (Units) Forecast by Material Type, 2018 to 2033
Table 7: Industry Analysis and Outlook Value (US$ Million) Forecast by End Use, 2018 to 2033
Table 8: Industry Analysis and Outlook Volume (Units) Forecast by End Use, 2018 to 2033
Table 9: UK Industry Analysis and Outlook Value (US$ Million) Forecast By Region, 2018 to 2033
Table 10: UK Industry Analysis and Outlook Volume (Units) Forecast By Region, 2018 to 2033
Table 11: UK Industry Analysis and Outlook Value (US$ Million) Forecast by Product Type, 2018 to 2033
Table 12: UK Industry Analysis and Outlook Volume (Units) Forecast by Product Type, 2018 to 2033
Table 13: UK Industry Analysis and Outlook Value (US$ Million) Forecast by Material Type, 2018 to 2033
Table 14: UK Industry Analysis and Outlook Volume (Units) Forecast by Material Type, 2018 to 2033
Table 15: UK Industry Analysis and Outlook Value (US$ Million) Forecast by End Use, 2018 to 2033
Table 16: UK Industry Analysis and Outlook Volume (Units) Forecast by End Use, 2018 to 2033
Table 17: Germany Industry Analysis and Outlook Value (US$ Million) Forecast By Region, 2018 to 2033
Table 18: Germany Industry Analysis and Outlook Volume (Units) Forecast By Region, 2018 to 2033
Table 19: Germany Industry Analysis and Outlook Value (US$ Million) Forecast by Product Type, 2018 to 2033
Table 20: Germany Industry Analysis and Outlook Volume (Units) Forecast by Product Type, 2018 to 2033
Table 21: Germany Industry Analysis and Outlook Value (US$ Million) Forecast by Material Type, 2018 to 2033
Table 22: Germany Industry Analysis and Outlook Volume (Units) Forecast by Material Type, 2018 to 2033
Table 23: Germany Industry Analysis and Outlook Value (US$ Million) Forecast by End Use, 2018 to 2033
Table 24: Germany Industry Analysis and Outlook Volume (Units) Forecast by End Use, 2018 to 2033
Table 25: Italy Industry Analysis and Outlook Value (US$ Million) Forecast By Region, 2018 to 2033
Table 26: Italy Industry Analysis and Outlook Volume (Units) Forecast By Region, 2018 to 2033
Table 27: Italy Industry Analysis and Outlook Value (US$ Million) Forecast by Product Type, 2018 to 2033
Table 28: Italy Industry Analysis and Outlook Volume (Units) Forecast by Product Type, 2018 to 2033
Table 29: Italy Industry Analysis and Outlook Value (US$ Million) Forecast by Material Type, 2018 to 2033
Table 30: Italy Industry Analysis and Outlook Volume (Units) Forecast by Material Type, 2018 to 2033
Table 31: Italy Industry Analysis and Outlook Value (US$ Million) Forecast by End Use, 2018 to 2033
Table 32: Italy Industry Analysis and Outlook Volume (Units) Forecast by End Use, 2018 to 2033
Table 33: France Industry Analysis and Outlook Value (US$ Million) Forecast By Region, 2018 to 2033
Table 34: France Industry Analysis and Outlook Volume (Units) Forecast By Region, 2018 to 2033
Table 35: France Industry Analysis and Outlook Value (US$ Million) Forecast by Product Type, 2018 to 2033
Table 36: France Industry Analysis and Outlook Volume (Units) Forecast by Product Type, 2018 to 2033
Table 37: France Industry Analysis and Outlook Value (US$ Million) Forecast by Material Type, 2018 to 2033
Table 38: France Industry Analysis and Outlook Volume (Units) Forecast by Material Type, 2018 to 2033
Table 39: France Industry Analysis and Outlook Value (US$ Million) Forecast by End Use, 2018 to 2033
Table 40: France Industry Analysis and Outlook Volume (Units) Forecast by End Use, 2018 to 2033
Table 41: Spain Industry Analysis and Outlook Value (US$ Million) Forecast By Region, 2018 to 2033
Table 42: Spain Industry Analysis and Outlook Volume (Units) Forecast By Region, 2018 to 2033
Table 43: Spain Industry Analysis and Outlook Value (US$ Million) Forecast by Product Type, 2018 to 2033
Table 44: Spain Industry Analysis and Outlook Volume (Units) Forecast by Product Type, 2018 to 2033
Table 45: Spain Industry Analysis and Outlook Value (US$ Million) Forecast by Material Type, 2018 to 2033
Table 46: Spain Industry Analysis and Outlook Volume (Units) Forecast by Material Type, 2018 to 2033
Table 47: Spain Industry Analysis and Outlook Value (US$ Million) Forecast by End Use, 2018 to 2033
Table 48: Spain Industry Analysis and Outlook Volume (Units) Forecast by End Use, 2018 to 2033
Table 49: Rest of Industry Analysis and Outlook Value (US$ Million) Forecast by Product Type, 2018 to 2033
Table 50: Rest of Industry Analysis and Outlook Volume (Units) Forecast by Product Type, 2018 to 2033
Table 51: Rest of Industry Analysis and Outlook Value (US$ Million) Forecast by Material Type, 2018 to 2033
Table 52: Rest of Industry Analysis and Outlook Volume (Units) Forecast by Material Type, 2018 to 2033
Table 53: Rest of Industry Analysis and Outlook Value (US$ Million) Forecast by End Use, 2018 to 2033
Table 54: Rest of Industry Analysis and Outlook Volume (Units) Forecast by End Use, 2018 to 2033
Figure 1: Industry Analysis and Outlook Value (US$ Million) by Product Type, 2023 to 2033
Figure 2: Industry Analysis and Outlook Value (US$ Million) by Material Type, 2023 to 2033
Figure 3: Industry Analysis and Outlook Value (US$ Million) by End Use, 2023 to 2033
Figure 4: Industry Analysis and Outlook Value (US$ Million) by Country, 2023 to 2033
Figure 5: Industry Analysis and Outlook Value (US$ Million) Analysis by Country, 2018 to 2033
Figure 6: Industry Analysis and Outlook Volume (Units) Analysis by Country, 2018 to 2033
Figure 7: Industry Analysis and Outlook Value Share (%) and BPS Analysis by Country, 2023 to 2033
Figure 8: Industry Analysis and Outlook Y-o-Y Growth (%) Projections by Country, 2023 to 2033
Figure 9: Industry Analysis and Outlook Value (US$ Million) Analysis by Product Type, 2018 to 2033
Figure 10: Industry Analysis and Outlook Volume (Units) Analysis by Product Type, 2018 to 2033
Figure 11: Industry Analysis and Outlook Value Share (%) and BPS Analysis by Product Type, 2023 to 2033
Figure 12: Industry Analysis and Outlook Y-o-Y Growth (%) Projections by Product Type, 2023 to 2033
Figure 13: Industry Analysis and Outlook Value (US$ Million) Analysis by Material Type, 2018 to 2033
Figure 14: Industry Analysis and Outlook Volume (Units) Analysis by Material Type, 2018 to 2033
Figure 15: Industry Analysis and Outlook Value Share (%) and BPS Analysis by Material Type, 2023 to 2033
Figure 16: Industry Analysis and Outlook Y-o-Y Growth (%) Projections by Material Type, 2023 to 2033
Figure 17: Industry Analysis and Outlook Value (US$ Million) Analysis by End Use, 2018 to 2033
Figure 18: Industry Analysis and Outlook Volume (Units) Analysis by End Use, 2018 to 2033
Figure 19: Industry Analysis and Outlook Value Share (%) and BPS Analysis by End Use, 2023 to 2033
Figure 20: Industry Analysis and Outlook Y-o-Y Growth (%) Projections by End Use, 2023 to 2033
Figure 21: Industry Analysis and Outlook Attractiveness by Product Type, 2023 to 2033
Figure 22: Industry Analysis and Outlook Attractiveness by Material Type, 2023 to 2033
Figure 23: Industry Analysis and Outlook Attractiveness by End Use, 2023 to 2033
Figure 24: Industry Analysis and Outlook Attractiveness by Region, 2023 to 2033
Figure 25: UK Industry Analysis and Outlook Value (US$ Million) by Product Type, 2023 to 2033
Figure 26: UK Industry Analysis and Outlook Value (US$ Million) by Material Type, 2023 to 2033
Figure 27: UK Industry Analysis and Outlook Value (US$ Million) by End Use, 2023 to 2033
Figure 28: UK Industry Analysis and Outlook Value (US$ Million) By Region, 2023 to 2033
Figure 29: UK Industry Analysis and Outlook Value (US$ Million) Analysis By Region, 2018 to 2033
Figure 30: UK Industry Analysis and Outlook Volume (Units) Analysis By Region, 2018 to 2033
Figure 31: UK Industry Analysis and Outlook Value Share (%) and BPS Analysis By Region, 2023 to 2033
Figure 32: UK Industry Analysis and Outlook Y-o-Y Growth (%) Projections By Region, 2023 to 2033
Figure 33: UK Industry Analysis and Outlook Value (US$ Million) Analysis by Product Type, 2018 to 2033
Figure 34: UK Industry Analysis and Outlook Volume (Units) Analysis by Product Type, 2018 to 2033
Figure 35: UK Industry Analysis and Outlook Value Share (%) and BPS Analysis by Product Type, 2023 to 2033
Figure 36: UK Industry Analysis and Outlook Y-o-Y Growth (%) Projections by Product Type, 2023 to 2033
Figure 37: UK Industry Analysis and Outlook Value (US$ Million) Analysis by Material Type, 2018 to 2033
Figure 38: UK Industry Analysis and Outlook Volume (Units) Analysis by Material Type, 2018 to 2033
Figure 39: UK Industry Analysis and Outlook Value Share (%) and BPS Analysis by Material Type, 2023 to 2033
Figure 40: UK Industry Analysis and Outlook Y-o-Y Growth (%) Projections by Material Type, 2023 to 2033
Figure 41: UK Industry Analysis and Outlook Value (US$ Million) Analysis by End Use, 2018 to 2033
Figure 42: UK Industry Analysis and Outlook Volume (Units) Analysis by End Use, 2018 to 2033
Figure 43: UK Industry Analysis and Outlook Value Share (%) and BPS Analysis by End Use, 2023 to 2033
Figure 44: UK Industry Analysis and Outlook Y-o-Y Growth (%) Projections by End Use, 2023 to 2033
Figure 45: UK Industry Analysis and Outlook Attractiveness by Product Type, 2023 to 2033
Figure 46: UK Industry Analysis and Outlook Attractiveness by Material Type, 2023 to 2033
Figure 47: UK Industry Analysis and Outlook Attractiveness by End Use, 2023 to 2033
Figure 48: UK Industry Analysis and Outlook Attractiveness By Region, 2023 to 2033
Figure 49: Germany Industry Analysis and Outlook Value (US$ Million) by Product Type, 2023 to 2033
Figure 50: Germany Industry Analysis and Outlook Value (US$ Million) by Material Type, 2023 to 2033
Figure 51: Germany Industry Analysis and Outlook Value (US$ Million) by End Use, 2023 to 2033
Figure 52: Germany Industry Analysis and Outlook Value (US$ Million) By Region, 2023 to 2033
Figure 53: Germany Industry Analysis and Outlook Value (US$ Million) Analysis By Region, 2018 to 2033
Figure 54: Germany Industry Analysis and Outlook Volume (Units) Analysis By Region, 2018 to 2033
Figure 55: Germany Industry Analysis and Outlook Value Share (%) and BPS Analysis By Region, 2023 to 2033
Figure 56: Germany Industry Analysis and Outlook Y-o-Y Growth (%) Projections By Region, 2023 to 2033
Figure 57: Germany Industry Analysis and Outlook Value (US$ Million) Analysis by Product Type, 2018 to 2033
Figure 58: Germany Industry Analysis and Outlook Volume (Units) Analysis by Product Type, 2018 to 2033
Figure 59: Germany Industry Analysis and Outlook Value Share (%) and BPS Analysis by Product Type, 2023 to 2033
Figure 60: Germany Industry Analysis and Outlook Y-o-Y Growth (%) Projections by Product Type, 2023 to 2033
Figure 61: Germany Industry Analysis and Outlook Value (US$ Million) Analysis by Material Type, 2018 to 2033
Figure 62: Germany Industry Analysis and Outlook Volume (Units) Analysis by Material Type, 2018 to 2033
Figure 63: Germany Industry Analysis and Outlook Value Share (%) and BPS Analysis by Material Type, 2023 to 2033
Figure 64: Germany Industry Analysis and Outlook Y-o-Y Growth (%) Projections by Material Type, 2023 to 2033
Figure 65: Germany Industry Analysis and Outlook Value (US$ Million) Analysis by End Use, 2018 to 2033
Figure 66: Germany Industry Analysis and Outlook Volume (Units) Analysis by End Use, 2018 to 2033
Figure 67: Germany Industry Analysis and Outlook Value Share (%) and BPS Analysis by End Use, 2023 to 2033
Figure 68: Germany Industry Analysis and Outlook Y-o-Y Growth (%) Projections by End Use, 2023 to 2033
Figure 69: Germany Industry Analysis and Outlook Attractiveness by Product Type, 2023 to 2033
Figure 70: Germany Industry Analysis and Outlook Attractiveness by Material Type, 2023 to 2033
Figure 71: Germany Industry Analysis and Outlook Attractiveness by End Use, 2023 to 2033
Figure 72: Germany Industry Analysis and Outlook Attractiveness By Region, 2023 to 2033
Figure 73: Italy Industry Analysis and Outlook Value (US$ Million) by Product Type, 2023 to 2033
Figure 74: Italy Industry Analysis and Outlook Value (US$ Million) by Material Type, 2023 to 2033
Figure 75: Italy Industry Analysis and Outlook Value (US$ Million) by End Use, 2023 to 2033
Figure 76: Italy Industry Analysis and Outlook Value (US$ Million) By Region, 2023 to 2033
Figure 77: Italy Industry Analysis and Outlook Value (US$ Million) Analysis By Region, 2018 to 2033
Figure 78: Italy Industry Analysis and Outlook Volume (Units) Analysis By Region, 2018 to 2033
Figure 79: Italy Industry Analysis and Outlook Value Share (%) and BPS Analysis By Region, 2023 to 2033
Figure 80: Italy Industry Analysis and Outlook Y-o-Y Growth (%) Projections By Region, 2023 to 2033
Figure 81: Italy Industry Analysis and Outlook Value (US$ Million) Analysis by Product Type, 2018 to 2033
Figure 82: Italy Industry Analysis and Outlook Volume (Units) Analysis by Product Type, 2018 to 2033
Figure 83: Italy Industry Analysis and Outlook Value Share (%) and BPS Analysis by Product Type, 2023 to 2033
Figure 84: Italy Industry Analysis and Outlook Y-o-Y Growth (%) Projections by Product Type, 2023 to 2033
Figure 85: Italy Industry Analysis and Outlook Value (US$ Million) Analysis by Material Type, 2018 to 2033
Figure 86: Italy Industry Analysis and Outlook Volume (Units) Analysis by Material Type, 2018 to 2033
Figure 87: Italy Industry Analysis and Outlook Value Share (%) and BPS Analysis by Material Type, 2023 to 2033
Figure 88: Italy Industry Analysis and Outlook Y-o-Y Growth (%) Projections by Material Type, 2023 to 2033
Figure 89: Italy Industry Analysis and Outlook Value (US$ Million) Analysis by End Use, 2018 to 2033
Figure 90: Italy Industry Analysis and Outlook Volume (Units) Analysis by End Use, 2018 to 2033
Figure 91: Italy Industry Analysis and Outlook Value Share (%) and BPS Analysis by End Use, 2023 to 2033
Figure 92: Italy Industry Analysis and Outlook Y-o-Y Growth (%) Projections by End Use, 2023 to 2033
Figure 93: Italy Industry Analysis and Outlook Attractiveness by Product Type, 2023 to 2033
Figure 94: Italy Industry Analysis and Outlook Attractiveness by Material Type, 2023 to 2033
Figure 95: Italy Industry Analysis and Outlook Attractiveness by End Use, 2023 to 2033
Figure 96: Italy Industry Analysis and Outlook Attractiveness By Region, 2023 to 2033
Figure 97: France Industry Analysis and Outlook Value (US$ Million) by Product Type, 2023 to 2033
Figure 98: France Industry Analysis and Outlook Value (US$ Million) by Material Type, 2023 to 2033
Figure 99: France Industry Analysis and Outlook Value (US$ Million) by End Use, 2023 to 2033
Figure 100: France Industry Analysis and Outlook Value (US$ Million) By Region, 2023 to 2033
Figure 101: France Industry Analysis and Outlook Value (US$ Million) Analysis By Region, 2018 to 2033
Figure 102: France Industry Analysis and Outlook Volume (Units) Analysis By Region, 2018 to 2033
Figure 103: France Industry Analysis and Outlook Value Share (%) and BPS Analysis By Region, 2023 to 2033
Figure 104: France Industry Analysis and Outlook Y-o-Y Growth (%) Projections By Region, 2023 to 2033
Figure 105: France Industry Analysis and Outlook Value (US$ Million) Analysis by Product Type, 2018 to 2033
Figure 106: France Industry Analysis and Outlook Volume (Units) Analysis by Product Type, 2018 to 2033
Figure 107: France Industry Analysis and Outlook Value Share (%) and BPS Analysis by Product Type, 2023 to 2033
Figure 108: France Industry Analysis and Outlook Y-o-Y Growth (%) Projections by Product Type, 2023 to 2033
Figure 109: France Industry Analysis and Outlook Value (US$ Million) Analysis by Material Type, 2018 to 2033
Figure 110: France Industry Analysis and Outlook Volume (Units) Analysis by Material Type, 2018 to 2033
Figure 111: France Industry Analysis and Outlook Value Share (%) and BPS Analysis by Material Type, 2023 to 2033
Figure 112: France Industry Analysis and Outlook Y-o-Y Growth (%) Projections by Material Type, 2023 to 2033
Figure 113: France Industry Analysis and Outlook Value (US$ Million) Analysis by End Use, 2018 to 2033
Figure 114: France Industry Analysis and Outlook Volume (Units) Analysis by End Use, 2018 to 2033
Figure 115: France Industry Analysis and Outlook Value Share (%) and BPS Analysis by End Use, 2023 to 2033
Figure 116: France Industry Analysis and Outlook Y-o-Y Growth (%) Projections by End Use, 2023 to 2033
Figure 117: France Industry Analysis and Outlook Attractiveness by Product Type, 2023 to 2033
Figure 118: France Industry Analysis and Outlook Attractiveness by Material Type, 2023 to 2033
Figure 119: France Industry Analysis and Outlook Attractiveness by End Use, 2023 to 2033
Figure 120: France Industry Analysis and Outlook Attractiveness By Region, 2023 to 2033
Figure 121: Spain Industry Analysis and Outlook Value (US$ Million) by Product Type, 2023 to 2033
Figure 122: Spain Industry Analysis and Outlook Value (US$ Million) by Material Type, 2023 to 2033
Figure 123: Spain Industry Analysis and Outlook Value (US$ Million) by End Use, 2023 to 2033
Figure 124: Spain Industry Analysis and Outlook Value (US$ Million) By Region, 2023 to 2033
Figure 125: Spain Industry Analysis and Outlook Value (US$ Million) Analysis By Region, 2018 to 2033
Figure 126: Spain Industry Analysis and Outlook Volume (Units) Analysis By Region, 2018 to 2033
Figure 127: Spain Industry Analysis and Outlook Value Share (%) and BPS Analysis By Region, 2023 to 2033
Figure 128: Spain Industry Analysis and Outlook Y-o-Y Growth (%) Projections By Region, 2023 to 2033
Figure 129: Spain Industry Analysis and Outlook Value (US$ Million) Analysis by Product Type, 2018 to 2033
Figure 130: Spain Industry Analysis and Outlook Volume (Units) Analysis by Product Type, 2018 to 2033
Figure 131: Spain Industry Analysis and Outlook Value Share (%) and BPS Analysis by Product Type, 2023 to 2033
Figure 132: Spain Industry Analysis and Outlook Y-o-Y Growth (%) Projections by Product Type, 2023 to 2033
Figure 133: Spain Industry Analysis and Outlook Value (US$ Million) Analysis by Material Type, 2018 to 2033
Figure 134: Spain Industry Analysis and Outlook Volume (Units) Analysis by Material Type, 2018 to 2033
Figure 135: Spain Industry Analysis and Outlook Value Share (%) and BPS Analysis by Material Type, 2023 to 2033
Figure 136: Spain Industry Analysis and Outlook Y-o-Y Growth (%) Projections by Material Type, 2023 to 2033
Figure 137: Spain Industry Analysis and Outlook Value (US$ Million) Analysis by End Use, 2018 to 2033
Figure 138: Spain Industry Analysis and Outlook Volume (Units) Analysis by End Use, 2018 to 2033
Figure 139: Spain Industry Analysis and Outlook Value Share (%) and BPS Analysis by End Use, 2023 to 2033
Figure 140: Spain Industry Analysis and Outlook Y-o-Y Growth (%) Projections by End Use, 2023 to 2033
Figure 141: Spain Industry Analysis and Outlook Attractiveness by Product Type, 2023 to 2033
Figure 142: Spain Industry Analysis and Outlook Attractiveness by Material Type, 2023 to 2033
Figure 143: Spain Industry Analysis and Outlook Attractiveness by End Use, 2023 to 2033
Figure 144: Spain Industry Analysis and Outlook Attractiveness By Region, 2023 to 2033
Figure 145: Rest of Industry Analysis and Outlook Value (US$ Million) by Product Type, 2023 to 2033
Figure 146: Rest of Industry Analysis and Outlook Value (US$ Million) by Material Type, 2023 to 2033
Figure 147: Rest of Industry Analysis and Outlook Value (US$ Million) by End Use, 2023 to 2033
Figure 148: Rest of Industry Analysis and Outlook Value (US$ Million) Analysis by Product Type, 2018 to 2033
Figure 149: Rest of Industry Analysis and Outlook Volume (Units) Analysis by Product Type, 2018 to 2033
Figure 150: Rest of Industry Analysis and Outlook Value Share (%) and BPS Analysis by Product Type, 2023 to 2033
Figure 151: Rest of Industry Analysis and Outlook Y-o-Y Growth (%) Projections by Product Type, 2023 to 2033
Figure 152: Rest of Industry Analysis and Outlook Value (US$ Million) Analysis by Material Type, 2018 to 2033
Figure 153: Rest of Industry Analysis and Outlook Volume (Units) Analysis by Material Type, 2018 to 2033
Figure 154: Rest of Industry Analysis and Outlook Value Share (%) and BPS Analysis by Material Type, 2023 to 2033
Figure 155: Rest of Industry Analysis and Outlook Y-o-Y Growth (%) Projections by Material Type, 2023 to 2033
Figure 156: Rest of Industry Analysis and Outlook Value (US$ Million) Analysis by End Use, 2018 to 2033
Figure 157: Rest of Industry Analysis and Outlook Volume (Units) Analysis by End Use, 2018 to 2033
Figure 158: Rest of Industry Analysis and Outlook Value Share (%) and BPS Analysis by End Use, 2023 to 2033
Figure 159: Rest of Industry Analysis and Outlook Y-o-Y Growth (%) Projections by End Use, 2023 to 2033
Figure 160: Rest of Industry Analysis and Outlook Attractiveness by Product Type, 2023 to 2033
Figure 161: Rest of Industry Analysis and Outlook Attractiveness by Material Type, 2023 to 2033
Figure 162: Rest of Industry Analysis and Outlook Attractiveness by End Use, 2023 to 2033
The current valuation of BFS technology stands at USD 819.8 million in 2023.
The expected CAGR until 2033 stands at a remarkable 9.5%.
Anticipated demand for BFS technology in Western Europe is projected to reach USD 2,026.9 million by 2033.
BFS technology suppliers in Western Europe can expand by focusing on innovative packaging solutions and embracing sustainability.
Preference for eco-friendly packaging, the rise of eCommerce, single-dose packaging popularity, and aseptic packaging demand.
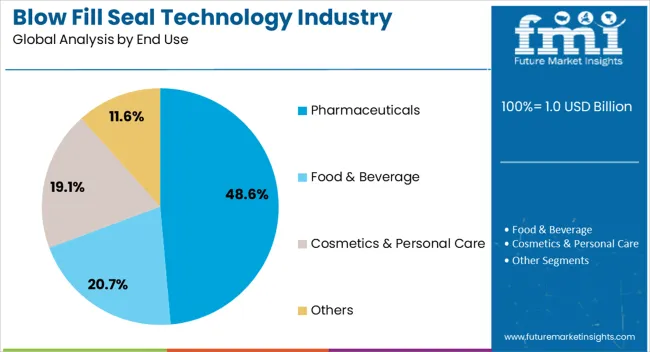
The predominant end use of BFS technology is in pharmaceuticals.
Explore Similar Insights
Thank you!
You will receive an email from our Business Development Manager. Please be sure to check your SPAM/JUNK folder too.