This site uses cookies, including third-party cookies, that help us to provide and improve our services.

Privacy Policy
- Global Locations -
Headquarters
Future Market Insights, Inc.
Christiana Corporate, 200 Continental Drive, Suite 401, Newark, Delaware - 19713, United States
T: +1-845-579-5705
MEA
Market Access DMCC

1602-6 Jumeirah Bay X2 Tower, Plot No: JLT-PH2-X2A,

Jumeirah Lakes Towers, Dubai,

United Arab Emirates

Americas
Future Market Insights
616 Corporate Way, Suite 2-9018,
Valley Cottage, NY 10989,
United States
T: +1-347-918-3531
Europe
Future Market Insights
3rd Floor, 207 Regent Street,
London W1B 3HH
United Kingdom
T: + 44 (0) 20 8123 9659
D: +44 (0) 20 3287 4268
APAC
Future Market Insights
Office No. 401-A, 4th Floor,
VANTAGE 9, S.No. 36/1/1,
Baner, Pune 411045 India

Blow-fill-seal Equipment Market

Market Insights on Blow-fill-seal Equipment covering sales outlook, demand forecast & up-to-date key trends

Blow-Fill-Seal Equipment Market By Production Capacity (Up to 5,000 containers/hr., 5,000 - 10,000 containers/hr., Above 10,000 containers/hr.), Product Type (Bottles, Ampoules, vials, Prefilled Syringes & Injectable), End-Use Industry (Pharmaceuticals, Food & Beverage, Cosmetics & Personal Care) & Region - Forecast 2022 - 2028

Blow-Fill-Seal Equipment Market Outlook- 2022-2028

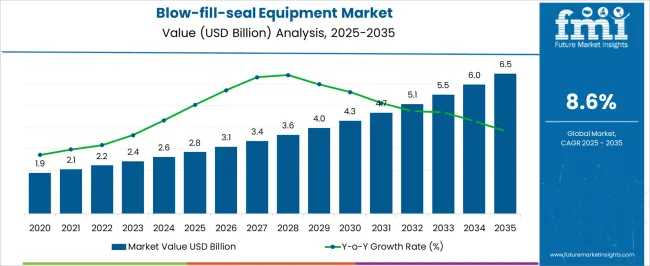
[250 Pages Report] The global blow-fill-seal equipment market is projected to expand at a CAGR of 5.9% by the end of the forecast period (2022-2028). Growth in the market is underpinned by rapid development and advancement in packaging industries, coupled with rising application in diverse end-use sectors.

Attribute

Details

Blow-fill-seal Equipment Market Size Value in 2022

US$ 5.6 Bn

Blow-fill-seal Equipment Market Size Value in 2028

US$ 7.7 Bn

Blow-fill-seal Equipment Market Historical CAGR (2013-2021)

4.4%

Collective Value Share: Top 5 Companies (2021A)

9%

Blow-fill-seal Equipment Market CAGR (2022-2028)

5.9%

Additionally, the overall sales of blow-fill-seal (BFS) equipment are expected to surpass US$ 7.7 Bn by the end of 2028. As BFS equipment is used for forming and packaging of containers, demand for them is increasing in food & beverage and pharmaceutical industry.

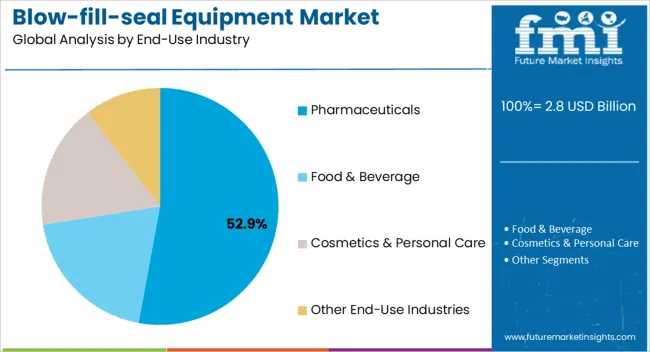
In terms of end-use industry, demand for BFS equipment is expected to be highest in the pharmaceutical industry. With increasing need for aseptic packaging for chemical and drugs, the pharmaceutical industry will hold over 90% of overall sales in the market.

Customize this Report

Let us know your requirement to get
100% FREE customization

How The Market Progressed Till June 2022?

Particulars

Details

H1 2021

6.6%

H1 2022 Projected

6.5%

H1 2022 Expected

6.7%

BPS Change - H1, 2022 (O) – H1, 2022 (P)

(+) 20 ↑

BPS Change – H1, 2022 (O) – H1, 2021

(+) 10 ↑

Future Market Insights predict a comparison and review analysis of the dynamics of the blow-fill-seal equipment market, which is principally subjected to an array of industry factors along with a few definite influences regarding the rising possibility of microbial contamination of the products that could restrain the growth of the blow-fill-seal equipment. Some new advances that have taken place in the market include the use of BFS technology with injectables and in biologics including monoclonal antibodies and vaccines.

The market for blow-fill-seal equipment is expected to surge by 10 basis share points (BPS) in H1-2022 (O) against comparison with H1-2021, according to an FMI analysis. However, when comparing the H1-2022 projected and H1-2022 outlook period, a rise in BPS change by 20 BPS has been noticed. The key reason for this change in growth rate is due to high-speed operation and aseptic packaging without human interpretation.

Despite these prospects, the improved sealing and leak prevention provided by blow-fill-seal equipment is expected to drive the market growth.

2013-2021 Blow-Fill-Seal Equipment Market Outlook In Comparison To 2022-2028 Growth Forecast

As per Future Market Insights (FMI), the global blow-fill-seal equipment market is projected to witness robust growth, with sales increasing by 1.4x between 2022 and 2028. With increasing demand for aseptic packaging in pharmaceutical industry, sales of BFS equipment are expected to surge.

Rapid development in the packaging industry across the globe has triggered the use of bow-fill-seal equipment and technology. Unique ability of BFS equipment to pack formulated drugs in clean and sterilized environment is projected to aid the demand in the market.

On account of this, end users are extensively using blow-fill-seal equipment and technology to increase the product safety, especially in food & beverage and pharmaceutical industry. FMI opines, increasing consumption of soft drinks and milk products will create a conducive environment for the BFS equipment market.

Blow-fill-seal Equipment Market Download Report Brochure

Following the outbreak of COVID-19, the demand for safe and contamination free packaging increased exponentially, accelerating the demand for BFS equipment. Other than liquid filled containers, BFS equipment is also used for packaging of ointments, gels, vaccines, and other drugs.

Based on these aforementioned factors, the global blow-fill-seal equipment market is projected to expand at 5.9% CAGR, surpassing US$ 7.7 Bn by the end of 2028.

Will Surging Demand For Unit Dose Packaging Propel Blow-Fill-Seal Equipment Sales?

Expansion of pharmaceutical industry, coupled with need for safe and aseptic packaging will improve the demand in the market. With technological advancements in the pharmaceutical packaging, end users are vying for innovation and product efficiency.

Unit dose-packaging, such as syringes, are pre-filled, creating lucrative growth opportunities for BFS equipment manufacturers. Demand for innovative and safe packaging, especially following the outbreak of pandemic, have increased the demand for BFS equipment.

Country-Wise Analysis

Why is Demand for Blow-fill-seal Equipment Increasing in China?

“Expansion of Pharmaceutical Industry to Boost Blow-fill-seal-Equipment Sales”

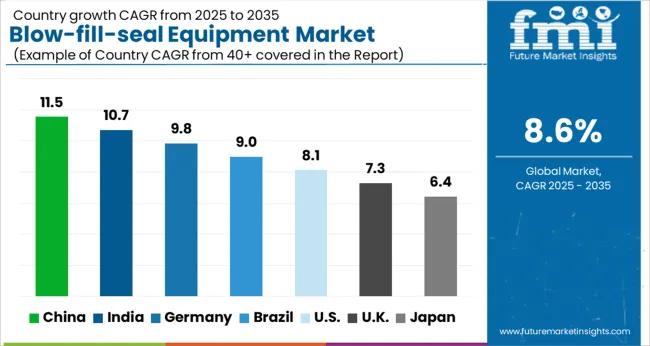
China is considered to be one of the largest pharmaceutical industry across the globe. Favourable government policies and increasing demand for safe and innovative packaging is expected to make China the most lucrative market in East Asia.
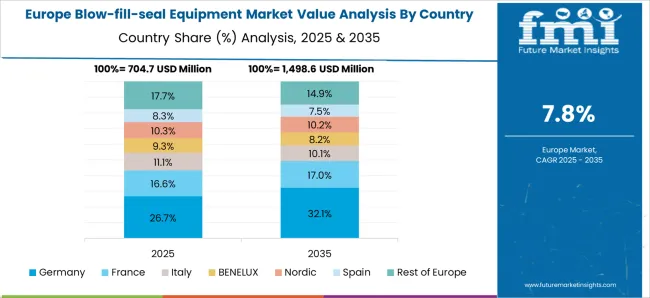
According to the U.S. Food and Drug Administration (FDA), China maintains around 13% of all regulated drugs and active pharmaceutical ingredients facilities across the globe. With increasing development and adoption of liquid drugs, need for safe and aseptic packaging is expected to accelerate.

Hence, key players are eyeing the China market to increase their revenues on the backdrop of increasing pharmaceutical drugs production.

How will the Blow-Fill-Seal Equipment Market Demand Fare in India?

“Blow fill seal Machine Manufacturers to Gain Their Revenue from Packaging Industry”

As per FMI, India is expected to be the most lucrative pocket in global blow-fill-seal equipment market. Growth in the country is attributable to the growing development of packaging industry.

Following the outbreak of COVID-19, consumers became increasingly conscious regarding the packaging of the food and drug products. Consequently, growing production of pharmaceutical drugs and increasing transportation of vaccines have provided impetus to the demand in the market.

Additionally, increasing consumption soft drinks and milk products across the country is also propelling the growth in the market. However, high cost and complex operating standards might impede the sales in India.

With favorable government initiatives and adoption of innovative pharmaceutical packaging, demand for BFS equipment is expected to gain traction over the forecast period.

How Big is the Opportunity for Blow-fill-seal equipment Market in the U.S.?

“Application of Blow fill seal Machine in Pharmaceutical Industry to Augment the Sales”

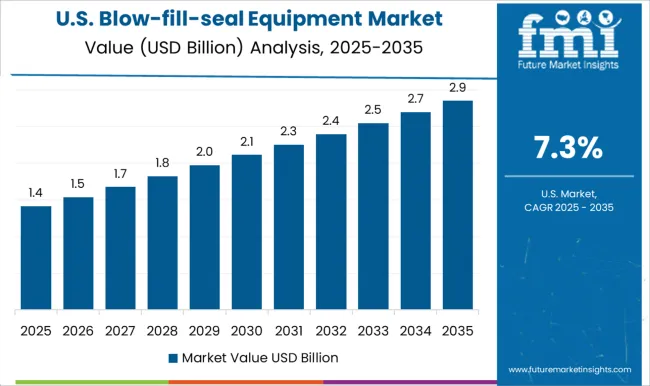
As per Future Market Insights, the U.S. blow-fill-seal equipment market is expected to hold largest share across North America. Demand for blow-fill-seal equipment is high across the pharmaceutical sector, increasing the sales across North America.

Strong presence of leading companies across the country will boost the sales of blow-fill-seal equipment. Also, leading healthcare companies are extensively adopting BFS equipment and technology to cater to the demand for single dose packaging.

Growing demand for aseptic and advanced packaging for liquid drugs and to improve product efficiency, need for BFS equipment is increasing.  Hence, key players established in the U.S. market are focusing on expansion of their product portfolio to create remunerative revenues.

For instance, Weiler Engineering, Inc. announced the launch of its next generation ASEP-TECH Blow/Fill/Seal (B/F/S) machine in pharmaceutical sector. This compact laboratory-sized machine, which measures approximately 100-in. H x 70-in. W x 80-in. D, caters to recent demand for low-output production of pharmaceutical products using advanced aseptic technology.

Ismail Sutaria
Ismail Sutaria
Principal Consultant
LinkedIn
Talk to Analyst

Find your sweet spots for generating winning opportunities in this market.

Talk to Analyst

Category-Wise Insights

Why are Prefilled Syringes & Injectable Most Preferred for Blow-Fill-Seal Equipment?

“Prefilled Syringes & Injectable Blow fill seal Machines to Dominate the Market”

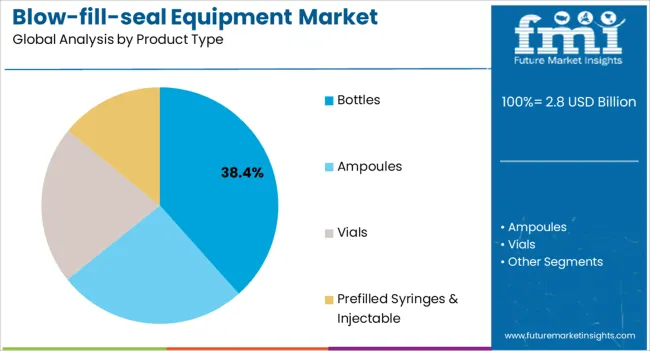
In terms of product type, the prefilled syringes & injectable segment is expected to dominate the global market. Increasing production of unit dose and need for aseptic packaging is facilitating the growth in the segment.

Rising demand for aseptic drug delivery and surging mutation of COVID-19 virus has bolstered the need for prefilled syringes and injectable. In order to enhance the drug shelf life and increase the efficiency, healthcare companies are adopting BFS technology, propelling the sales of blow fill seal equipment.

How will Demand for Blow-fill-seal Equipment Spur across Pharmaceutical Sector?

“Over 90% of Blow fill seal Equipment Sales to be Contributed by Pharmaceutical Sector”

As per Future Market Insights, the pharmaceutical segment is projected to contribute over 90% of sales in the global blow-fill-seal equipment market. Unique ability of BFS equipment to pack formulated drugs in clean environment, without any human interface is projected to increase the demand.

BFS technology ensures that the product is not used more than once. Hence, healthcare companies to curb the impact of communicable diseases are promoting the use of BFS technology and equipment.

Demand for BFS equipment surged with the onset of the novel COVID-19. Countries such as India and China extensively ordered the BFS equipment in order to curb the diseases. Given the risk of contamination and spread of disease, end-users are ensuring the drugs to be used once through this packaging format.

Additionally, universal acceptance of BFS equipment, especially the healthcare authorities such as FDA is boosting the demand for blow fill seal equipment in pharmaceutical industry.

Competitive Landscape

Leading players operating in global blow-fill-seal equipment market are investing extensively in research and development activities for developing new products to gain competitive edge. They are also collaborating with leading healthcare & pharmaceutical and food & beverage companies to create lucrative revenues.

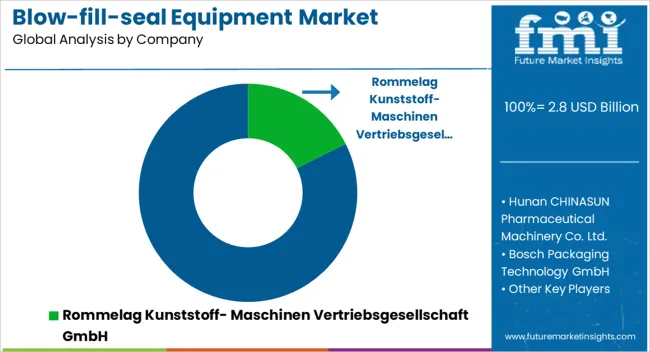
As per FMI, the BFS equipment market is consolidated with Rommelag, dominating the global market, holding nearly 90% of the market share. In 2021, top 5 companies held over 9% of global market share

For instance,

  • In December 2021, Woodstock Sterile Solutions, a leading blow-fill-seal (BFS) contract development and manufacturing organization, announced a patent for a cold BFS packaging and system process in the U.S. This will help in minimizing the temperature impact on thermally sensitive molecules, such as biologics, throughout the BFS manufacturing process
MarketNage
Become a MarketNgage Insider

A unified Market Research Subscription Platform, built for today's disparate research needs.

Scope Of Report

Attribute

Details

Forecast Period

2022-2028

Historical Data Available for

2013-2021

Market Analysis

US$ Bn for Value

Key Regions Covered

North America, Latin America, Western Europe, Eastern Europe, Asia Pacific excluding Japan, Japan, and MEA

Key Countries Covered

United States, Canada, Brazil, Mexico, Germany, UK, France, Italy, Spain, Nordic, Russia, Poland, China, India, Thailand, Indonesia, Australia and New Zealand, Japan, GCC countries, North Africa, South Africa, others.

Key Market Segments Covered

Production Capacity, Product Type, End-Use Industry, and Region

Key Companies Profiled

Pricing

Available upon Request

Blow-Fill-Seal Equipment Market By Category

Production Capacity:

  • Up to 5,000 containers/hr.
  • 5,000-10,000 containers/hr.
  • Above 10,000 containers/hr.

Product Type:

  • Bottles
  • Ampoules
  • Vials
  • Prefilled Syringes & Injectable

End-Use Industry:

  • Pharmaceuticals
  • Food & Beverage
  • Cosmetics & Personal Care
  • Others

Region:

  • North America
  • Latin America
  • Western Europe
  • Eastern Europe
  • Asia Pacific excluding Japan (APEJ)
  • Middle East & Africa
  • Japan

Frequently Asked Questions

The global blow-fill-seal equipment market is expected to reach a valuation around US$ 5.2 Bn in 2021.

Increasing application in pharmaceutical and food & beverage industry and need for aseptic packaging in emerging economies will fuel the sales in the market.

As per Future Market Insights, India, Germany, the U.S., the U.K., India and China are the top countries driving the demand for blow-fill-seal equipment.

As per FMI, sales of blow-fill-seal equipment’ solution grew at 4.4% CAGR between 2013 and 2021.

North America blow fill seal equipment market will account for over 26% of overall sales in the market.

Table of Content

1. Executive Summary

    1.1. Market Overview

    1.2. Market Analysis

    1.3. FMI Analysis and Recommendations

    1.4. Wheel of Opportunity

2. Market Introduction

    2.1. Market Definition

    2.2. Market Taxonomy

3. Market Background

    3.1. Parent Market

    3.2. Porter’s Analysis

    3.3. Macro-Economic Factors

    3.4. Forecast Factors – Relevance & Impact

    3.5. Value Chain

    3.6. Market Dynamics

        3.6.1. Drivers

        3.6.2. Restraints

        3.6.3. Opportunity

        3.6.4. Trends

4. Market Forecast

    4.1. Market Volume Projections

    4.2. Market Value Projections

    4.3. Y-o-Y Projections

    4.4. Absolute $ Opportunity Analysis

5. Global Blow-fill-seal Equipment Market Analysis By Production Capacity

    5.1. Introduction

        5.1.1. Market Value Share Analysis By Production Capacity

    5.2. Historical Market Value (US$ Mn) and Volume (Units) Analysis 2013-2021 By Production Capacity

        5.2.1. Upto 5,000 containers/hr

        5.2.2. 5,000-10,000 containers/hr

        5.2.3. Above 10,000 containers/hr

    5.3. Market Value (US$ Mn) and Volume (Units) Forecast 2022-2028 By Production Capacity

        5.3.1. Upto 5,000 containers/hr

        5.3.2. 5,000-10,000 containers/hr

        5.3.3. Above 10,000 containers/hr

    5.4. Market Attractiveness Analysis By Production Capacity

6. Global Blow-fill-seal Equipment Market Analysis By Product Type

    6.1. Introduction

        6.1.1. Market Value Share Analysis By Product Type

    6.2. Historical Market Value (US$ Mn) and Volume (Units) Analysis 2013-2021 By Product Type

        6.2.1. Bottles

        6.2.2. Ampoules

        6.2.3. Vials

        6.2.4. Prefilled Syringes & Injectable

    6.3. Market Value (US$ Mn) and Volume (Units) Forecast 2022-2028 By Product Type

        6.3.1. Bottles

        6.3.2. Ampoules

        6.3.3. Vials

        6.3.4. Prefilled Syringes & Injectable

    6.4. Market Attractiveness Analysis By Product Type

7. Global Blow-fill-seal Equipment Market Analysis By End Use

    7.1. Introduction

        7.1.1. Market Value Share Analysis By End Use

    7.2. Historical Market Value (US$ Mn) and Volume (Units) Analysis 2013-2021 By End Use

        7.2.1. Pharmaceuticals

        7.2.2. Food & Beverages

        7.2.3. Cosmetics and Personal Care

        7.2.4. Others

    7.3. Market Value (US$ Mn) and Volume (Units) Forecast 2022-2028 By End Use

        7.3.1. Pharmaceuticals

        7.3.2. Food & Beverages

        7.3.3. Cosmetics and Personal Care

        7.3.4. Others

    7.4. Market Attractiveness Analysis By End Use

8. Global Blow-fill-seal Equipment Market Analysis By Region

    8.1. Introduction

        8.1.1. Market Value Share Analysis By Region

    8.2. Historical Market Value (US$ Mn) and Volume (Units) Analysis 2013-2021 By Region

        8.2.1. North America

        8.2.2. Latin America

        8.2.3. Western Europe

        8.2.4. Eastern Europe

        8.2.5. Asia Pacific Excluding Japan

        8.2.6. Middle East and Africa

        8.2.7. Japan

    8.3. Market Value (US$ Mn) and Volume (Units) Forecast 2022-2028 By Region

        8.3.1. North America

        8.3.2. Latin America

        8.3.3. Western Europe

        8.3.4. Eastern Europe

        8.3.5. Asia Pacific Excluding Japan

        8.3.6. Middle East and Africa

        8.3.7. Japan

9. North America Blow-fill-seal Equipment Market Analysis

    9.1. Introduction

    9.2. Regional Pricing Analysis

    9.3. Historical Market Value (US$ Mn) and Volume (Units) Analysis 2013-2021 By Country

        9.3.1. U.S.

        9.3.2. Canada

    9.4. Market Value (US$ Mn) and Volume (Units) Forecast 2022-2028 By Country

        9.4.1. U.S.

        9.4.2. Canada

    9.5. Historical Market Value (US$ Mn) and Volume (Units) Analysis 2013-2021 By Production Capacity

        9.5.1. Upto 5,000 containers/hr

        9.5.2. 5,000-10,000 containers/hr

        9.5.3. Above 10,000 containers/hr

    9.6. Market Value (US$ Mn) and Volume (Units) Forecast 2022-2028 By Production Capacity

        9.6.1. Upto 5,000 containers/hr

        9.6.2. 5,000-10,000 containers/hr

        9.6.3. Above 10,000 containers/hr

    9.7. Historical Market Value (US$ Mn) and Volume (Units) Analysis 2013-2021 By Product Type

        9.7.1. Bottles

        9.7.2. Ampoules

        9.7.3. Vials

        9.7.4. Prefilled Syringes & Injectable

    9.8. Market Value (US$ Mn) and Volume (Units) Forecast 2022-2028 By Product Type

        9.8.1. Bottles

        9.8.2. Ampoules

        9.8.3. Vials

        9.8.4. Prefilled Syringes & Injectable

    9.9. Historical Market Value (US$ Mn) and Volume (Units) Analysis 2013-2021 By End Use

        9.9.1. Pharmaceuticals

        9.9.2. Food & Beverages

        9.9.3. Cosmetics and Personal Care

        9.9.4. Others

    9.10. Market Value (US$ Mn) and Volume (Units) Forecast 2022-2028 By End Use

        9.10.1. Pharmaceuticals

        9.10.2. Food & Beverages

        9.10.3. Cosmetics and Personal Care

        9.10.4. Others

10. Latin America Blow-fill-seal Equipment Market Analysis

    10.1. Introduction

    10.2. Regional Pricing Analysis

    10.3. Historical Market Value (US$ Mn) and Volume (Units) Analysis 2013-2021 By Country

        10.3.1. Brazil

        10.3.2. Mexico

        10.3.3. Rest of Latin America

    10.4. Market Value (US$ Mn) and Volume (Units) Forecast 2022-2028 By Country

        10.4.1. Brazil

        10.4.2. Mexico

        10.4.3. Rest of Latin America

    10.5. Historical Market Value (US$ Mn) and Volume (Units) Analysis 2013-2021 By Production Capacity

        10.5.1. Upto 5,000 containers/hr

        10.5.2. 5,000-10,000 containers/hr

        10.5.3. Above 10,000 containers/hr

    10.6. Market Value (US$ Mn) and Volume (Units) Forecast 2022-2028 By Production Capacity

        10.6.1. Upto 5,000 containers/hr

        10.6.2. 5,000-10,000 containers/hr

        10.6.3. Above 10,000 containers/hr

    10.7. Historical Market Value (US$ Mn) and Volume (Units) Analysis 2013-2021 By Product Type

        10.7.1. Bottles

        10.7.2. Ampoules

        10.7.3. Vials

        10.7.4. Prefilled Syringes & Injectable

    10.8. Market Value (US$ Mn) and Volume (Units) Forecast 2022-2028 By Product Type

        10.8.1. Bottles

        10.8.2. Ampoules

        10.8.3. Vials

        10.8.4. Prefilled Syringes & Injectable

    10.9. Historical Market Value (US$ Mn) and Volume (Units) Analysis 2013-2021 By End Use

        10.9.1. Pharmaceuticals

        10.9.2. Food & Beverages

        10.9.3. Cosmetics and Personal Care

        10.9.4. Others

    10.10. Market Value (US$ Mn) and Volume (Units) Forecast 2022-2028 By End Use

        10.10.1. Pharmaceuticals

        10.10.2. Food & Beverages

        10.10.3. Cosmetics and Personal Care

        10.10.4. Others

11. Western Europe Blow-fill-seal Equipment Market Analysis

    11.1. Introduction

    11.2. Regional Pricing Analysis

    11.3. Historical Market Value (US$ Mn) and Volume (Units) Analysis 2013-2021 By Country

        11.3.1. Germany

        11.3.2. Italy

        11.3.3. France

        11.3.4. Spain

        11.3.5. U.K.

        11.3.6. BENELUX

        11.3.7. Nordics

        11.3.8. Rest of Western Europe

    11.4. Market Value (US$ Mn) and Volume (Units) Forecast 2022-2028 By Country

        11.4.1. Germany

        11.4.2. Italy

        11.4.3. France

        11.4.4. Spain

        11.4.5. U.K.

        11.4.6. BENELUX

        11.4.7. Nordics

        11.4.8. Rest of Western Europe

    11.5. Historical Market Value (US$ Mn) and Volume (Units) Analysis 2013-2021 By Production Capacity

        11.5.1. Upto 5,000 containers/hr

        11.5.2. 5,000-10,000 containers/hr

        11.5.3. Above 10,000 containers/hr

    11.6. Market Value (US$ Mn) and Volume (Units) Forecast 2022-2028 By Production Capacity

        11.6.1. Upto 5,000 containers/hr

        11.6.2. 5,000-10,000 containers/hr

        11.6.3. Above 10,000 containers/hr

    11.7. Historical Market Value (US$ Mn) and Volume (Units) Analysis 2013-2021 By Product Type

        11.7.1. Bottles

        11.7.2. Ampoules

        11.7.3. Vials

        11.7.4. Prefilled Syringes & Injectable

    11.8. Market Value (US$ Mn) and Volume (Units) Forecast 2022-2028 By Product Type

        11.8.1. Bottles

        11.8.2. Ampoules

        11.8.3. Vials

        11.8.4. Prefilled Syringes & Injectable

    11.9. Historical Market Value (US$ Mn) and Volume (Units) Analysis 2013-2021 By End Use

        11.9.1. Pharmaceuticals

        11.9.2. Food & Beverages

        11.9.3. Cosmetics and Personal Care

        11.9.4. Others

    11.10. Market Value (US$ Mn) and Volume (Units) Forecast 2022-2028 By End Use

        11.10.1. Pharmaceuticals

        11.10.2. Food & Beverages

        11.10.3. Cosmetics and Personal Care

        11.10.4. Others

12. Eastern Europe Blow-fill-seal Equipment Market Analysis

    12.1. Introduction

    12.2. Regional Pricing Analysis

    12.3. Historical Market Value (US$ Mn) and Volume (Units) Analysis 2013-2021 By Country

        12.3.1. Russia

        12.3.2. Poland

        12.3.3. Rest of Eastern Europe

    12.4. Market Value (US$ Mn) and Volume (Units) Forecast 2022-2028 By Country

        12.4.1. Russia

        12.4.2. Poland

        12.4.3. Rest of Eastern Europe

    12.5. Historical Market Value (US$ Mn) and Volume (Units) Analysis 2013-2021 By Production Capacity

        12.5.1. Upto 5,000 containers/hr

        12.5.2. 5,000-10,000 containers/hr

        12.5.3. Above 10,000 containers/hr

    12.6. Market Value (US$ Mn) and Volume (Units) Forecast 2022-2028 By Production Capacity

        12.6.1. Upto 5,000 containers/hr

        12.6.2. 5,000-10,000 containers/hr

        12.6.3. Above 10,000 containers/hr

    12.7. Historical Market Value (US$ Mn) and Volume (Units) Analysis 2013-2021 By Product Type

        12.7.1. Bottles

        12.7.2. Ampoules

        12.7.3. Vials

        12.7.4. Prefilled Syringes & Injectable

    12.8. Market Value (US$ Mn) and Volume (Units) Forecast 2022-2028 By Product Type

        12.8.1. Bottles

        12.8.2. Ampoules

        12.8.3. Vials

        12.8.4. Prefilled Syringes & Injectable

    12.9. Historical Market Value (US$ Mn) and Volume (Units) Analysis 2013-2021 By End Use

        12.9.1. Pharmaceuticals

        12.9.2. Food & Beverages

        12.9.3. Cosmetics and Personal Care

        12.9.4. Others

    12.10. Market Value (US$ Mn) and Volume (Units) Forecast 2022-2028 By End Use

        12.10.1. Pharmaceuticals

        12.10.2. Food & Beverages

        12.10.3. Cosmetics and Personal Care

        12.10.4. Others

13. APEJ Blow-fill-seal Equipment Market Analysis

    13.1. Introduction

    13.2. Regional Pricing Analysis

    13.3. Historical Market Value (US$ Mn) and Volume (Units) Analysis 2013-2021 By Country

        13.3.1. China

        13.3.2. India

        13.3.3. ASEAN

        13.3.4. South Korea

        13.3.5. Australia and New Zealand

        13.3.6. Rest of APEJ

    13.4. Market Value (US$ Mn) and Volume (Units) Forecast 2022-2028 By Country

        13.4.1. China

        13.4.2. India

        13.4.3. ASEAN

        13.4.4. South Korea

        13.4.5. Australia and New Zealand

        13.4.6. Rest of APEJ

    13.5. Historical Market Value (US$ Mn) and Volume (Units) Analysis 2013-2021 By Production Capacity

        13.5.1. Upto 5,000 containers/hr

        13.5.2. 5,000-10,000 containers/hr

        13.5.3. Above 10,000 containers/hr

    13.6. Market Value (US$ Mn) and Volume (Units) Forecast 2022-2028 By Production Capacity

        13.6.1. Upto 5,000 containers/hr

        13.6.2. 5,000-10,000 containers/hr

        13.6.3. Above 10,000 containers/hr

    13.7. Historical Market Value (US$ Mn) and Volume (Units) Analysis 2013-2021 By Product Type

        13.7.1. Bottles

        13.7.2. Ampoules

        13.7.3. Vials

        13.7.4. Prefilled Syringes & Injectable

    13.8. Market Value (US$ Mn) and Volume (Units) Forecast 2022-2028 By Product Type

        13.8.1. Bottles

        13.8.2. Ampoules

        13.8.3. Vials

        13.8.4. Prefilled Syringes & Injectable

    13.9. Historical Market Value (US$ Mn) and Volume (Units) Analysis 2013-2021 By End Use

        13.9.1. Pharmaceuticals

        13.9.2. Food & Beverages

        13.9.3. Cosmetics and Personal Care

        13.9.4. Others

    13.10. Market Value (US$ Mn) and Volume (Units) Forecast 2022-2028 By End Use

        13.10.1. Pharmaceuticals

        13.10.2. Food & Beverages

        13.10.3. Cosmetics and Personal Care

        13.10.4. Others

14. Middle East and Africa Blow-fill-seal Equipment Market Analysis

    14.1. Introduction

    14.2. Regional Pricing Analysis

    14.3. Historical Market Value (US$ Mn) and Volume (Units) Analysis 2013-2021 By Country

        14.3.1. Northern Africa

        14.3.2. GCC Countries

        14.3.3. South Africa

        14.3.4. Turkey

        14.3.5. Rest of Middle East and Africa

    14.4. Market Value (US$ Mn) and Volume (Units) Forecast 2022-2028 By Country

        14.4.1. Northern Africa

        14.4.2. GCC Countries

        14.4.3. South Africa

        14.4.4. Turkey

        14.4.5. Rest of Middle East and Africa

    14.5. Historical Market Value (US$ Mn) and Volume (Units) Analysis 2013-2021 By Production Capacity

        14.5.1. Upto 5,000 containers/hr

        14.5.2. 5,000-10,000 containers/hr

        14.5.3. Above 10,000 containers/hr

    14.6. Market Value (US$ Mn) and Volume (Units) Forecast 2022-2028 By Production Capacity

        14.6.1. Upto 5,000 containers/hr

        14.6.2. 5,000-10,000 containers/hr

        14.6.3. Above 10,000 containers/hr

    14.7. Historical Market Value (US$ Mn) and Volume (Units) Analysis 2013-2021 By Product Type

        14.7.1. Bottles

        14.7.2. Ampoules

        14.7.3. Vials

        14.7.4. Prefilled Syringes & Injectable

    14.8. Market Value (US$ Mn) and Volume (Units) Forecast 2022-2028 By Product Type

        14.8.1. Bottles

        14.8.2. Ampoules

        14.8.3. Vials

        14.8.4. Prefilled Syringes & Injectable

    14.9. Historical Market Value (US$ Mn) and Volume (Units) Analysis 2013-2021 By End Use

        14.9.1. Pharmaceuticals

        14.9.2. Food & Beverages

        14.9.3. Cosmetics and Personal Care

        14.9.4. Others

    14.10. Market Value (US$ Mn) and Volume (Units) Forecast 2022-2028 By End Use

        14.10.1. Pharmaceuticals

        14.10.2. Food & Beverages

        14.10.3. Cosmetics and Personal Care

        14.10.4. Others

15. Japan Blow-fill-seal Equipment Market Analysis

    15.1. Introduction

    15.2. Regional Pricing Analysis

    15.3. Historical Market Value (US$ Mn) and Volume (Units) Analysis 2013-2021 By Production Capacity

        15.3.1. Upto 5,000 containers/hr

        15.3.2. 5,000-10,000 containers/hr

        15.3.3. Above 10,000 containers/hr

    15.4. Market Value (US$ Mn) and Volume (Units) Forecast 2022-2028 By Production Capacity

        15.4.1. Upto 5,000 containers/hr

        15.4.2. 5,000-10,000 containers/hr

        15.4.3. Above 10,000 containers/hr

    15.5. Historical Market Value (US$ Mn) and Volume (Units) Analysis 2013-2021 By Product Type

        15.5.1. Bottles

        15.5.2. Ampoules

        15.5.3. Vials

        15.5.4. Prefilled Syringes & Injectable

    15.6. Market Value (US$ Mn) and Volume (Units) Forecast 2022-2028 By Product Type

        15.6.1. Bottles

        15.6.2. Ampoules

        15.6.3. Vials

        15.6.4. Prefilled Syringes & Injectable

    15.7. Historical Market Value (US$ Mn) and Volume (Units) Analysis 2013-2021 By End Use

        15.7.1. Pharmaceuticals

        15.7.2. Food & Beverages

        15.7.3. Cosmetics and Personal Care

        15.7.4. Others

    15.8. Market Value (US$ Mn) and Volume (Units) Forecast 2022-2028 By End Use

        15.8.1. Pharmaceuticals

        15.8.2. Food & Beverages

        15.8.3. Cosmetics and Personal Care

        15.8.4. Others

16. Market Structure Analysis   

17. Competition Analysis

    17.1. Competition Dashboard

        17.1.1. Rommelag Kunststoff-Maschinen Vertriebsgesellschaft GmbH

        17.1.2. Hunan CHINASUN Pharmaceutical Machinery CO. Ltd.

        17.1.3. Bosch Packaging Technology GmbH

        17.1.4. Weiler Engineering, Inc.

        17.1.5. Brevetti Angela S.R.L.

        17.1.6. Marchesini Group S.p.A

        17.1.7. Serac Inc.

        17.1.8. GEA Group

        17.1.9. SIPA S.p.A.

        17.1.10. Sidel S.A.

18. Assumptions and Acronyms   

19. Research Methodology
Customize this Report

Let us know your requirement to get
100% FREE customization

List of Tables

Table 01: Global Blow-fill-seal Equipment Market Value (US$ Mn) and Volume (units) Forecast, by Capacity, 2013 – 2028

Table 02: Global Blow-fill-seal Equipment Market Value (US$ Mn) and Volume (units) Forecast, by Product Type, 2013 – 2028

Table 03: Global Blow-fill-seal Equipment Market Value (US$ Mn) and Volume (units) Forecast, by End-user Industry, 2013 – 2028

Table 04: Global Blow-fill-seal Equipment Market Value (US$ Mn) and Volume (units) Forecast, by Region, 2013 – 2028

Table 05: North America Blow-fill-seal Equipment Market Value (US$ Mn) and Volume (units) Forecast, by Country, 2013 – 2028

Table 06: North America Blow-fill-seal Equipment Market Value (US$ Mn) and Volume (units) Forecast, by Production Capacity, 2013 – 2028

Table 07: North America Blow-fill-seal Equipment Market Value (US$ Mn) and Volume (units) Forecast, by Product Type, 2013 – 2028

Table 08: North America Blow-fill-seal Equipment Market Value (US$ Mn) and Volume (units) Forecast, by End-user Industry, 2013 – 2028

Table 09: Latin America Blow-fill-seal Equipment Market Value (US$ Mn) and Volume (units) Forecast, by Country, 2013 – 2028

Table 10: Latin America Blow-fill-seal Equipment Market Value (US$ Mn) and Volume (units) Forecast, by Production Capacity, 2013 – 2028

Table 11: Latin America Blow-fill-seal Equipment Market Value (US$ Mn) and Volume (units) Forecast, by Product Type, 2013 – 2028

Table 12: Latin America Blow-fill-seal Equipment Market Value (US$ Mn) and Volume (units) Forecast, by End-user Industry, 2013 – 2028

Table 13: Western Europe Blow-fill-seal Equipment Market Value (US$ Mn) and Volume (units) Forecast, by Country, 2013 – 2028

Table 14: Western Europe Blow-fill-seal Equipment Market Value (US$ Mn) and Volume (units) Forecast, by Country, 2013 – 2028

Table 15: Western Europe Blow-fill-seal Equipment Market Value (US$ Mn) and Volume (units) Forecast, by Production Capacity, 2013 – 2028

Table 16: Western Europe Blow-fill-seal Equipment Market Value (US$ Mn) and Volume (units) Forecast, by Product Type, 2013 – 2028

Table 17: Western Europe Blow-fill-seal Equipment Market Value (US$ Mn) and Volume (units) Forecast, by End-user Industry, 2013 – 2028

Table 18: Eastern Europe Blow-fill-seal Equipment Market Value (US$ Mn) and Volume (units) Forecast, by Country, 2013 – 2028

Table 19: Eastern Europe Blow-fill-seal Equipment Market Value (US$ Mn) and Volume (units) Forecast, by Production Capacity, 2013 – 2028

Table 20: Eastern Europe Blow-fill-seal Equipment Market Value (US$ Mn) and Volume (units) Forecast, by Product Type, 2013 – 2028

Table 21: Eastern Europe Blow-fill-seal Equipment Market Value (US$ Mn) and Volume (units) Forecast, by End-user Industry, 2013 – 2028

Table 22: APEJ Blow-fill-seal Equipment Market Value (US$ Mn) and Volume (units) Forecast, by Country, 2013 – 2028

Table 23: APEJ Blow-fill-seal Equipment Market Value (US$ Mn) and Volume (units) Forecast, by Production Capacity, 2013 – 2028

Table 24: APEJ Blow-fill-seal Equipment Market Value (US$ Mn) and Volume (units) Forecast, by Product Type, 2013 – 2028

Table 25: APEJ Blow-fill-seal Equipment Market Value (US$ Mn) and Volume (units) Forecast, by End-user Industry, 2013 – 2028

Table 26: MEA Blow-fill-seal Equipment Market Value (US$ Mn) and Volume (units) Forecast, by Country, 2013 – 2028

Table 27: MEA Blow-fill-seal Equipment Market Value (US$ Mn) and Volume (units) Forecast, by Production Capacity, 2013 – 2028

Table 28: MEA Blow-fill-seal Equipment Market Value (US$ Mn) and Volume (units) Forecast, by Product Type, 2013 – 2028

Table 29: MEA Blow-fill-seal Equipment Market Value (US$ Mn) and Volume (units) Forecast, by End-user Industry, 2013 – 2028

Table 30: Japan Blow-fill-seal Equipment Market Value (US$ Mn) and Volume (units) Forecast, by Production Capacity, 2013 – 2028

Table 31: Japan Blow-fill-seal Equipment Market Value (US$ Mn) and Volume (units) Forecast, by Product Type, 2013 – 2028

Table 32: Japan Blow-fill-seal Equipment Market Value (US$ Mn) and Volume (units) Forecast, by End-user Industry, 2013 – 2028
Ismail Sutaria
Principal Consultant
LinkedIn
Talk to Analyst

Find your sweet spots for generating winning opportunities in this market.

Talk to Analyst

List of Charts

Figure 01: Global Blow-fill-seal Equipment Market Share Analysis, by Capacity, 2022(E) & 2028(F)

Figure 02: Global Blow-fill-seal Equipment Market Attractiveness Index, by Capacity, 2022(E) – 2028(F)

Figure 03: Global Blow-fill-seal Equipment Market Share Analysis, by Product Type, 2022(E) & 2028(F)

Figure 04: Global Blow-fill-seal Equipment Market Attractiveness Index, by Product type, 2022(E) – 2028(F)

Figure 05: Global Blow-fill-seal Equipment Market Share Analysis, by End-user Industry, 2022(E) & 2028(F)

Figure 06: Global Blow-fill-seal Equipment Market Attractiveness Index, by End-user Industry, 2022(E) – 2028(F)

Figure 07: Global Blow-fill-seal Equipment Market Share Analysis, by Region, 2022(E) & 2028(F)

Figure 08: Global Blow-fill-seal Equipment Market Attractiveness Index, by Region, 2022(E) – 2028(F)

Figure 09: North America Blow-fill-seal Equipment Market Share, by Capacity Type (2022)

Figure 10: North America Blow-fill-seal Equipment Market Share, by Product Type (2022)

Figure 11: North America Blow-fill-seal Equipment Market Share, by End-user Industry (2022)

Figure 12: North America Blow-fill-seal Equipment Share, by Country (2022)

Figure 13: North America Blow-fill-seal Equipment Market Value (US$ Mn) and Volume (units) analysis 2013 - 2021

Figure 14: North America Blow-fill-seal Equipment Market Value (US$ Mn) and Volume (units) Forecast, 2022 - 2028

Figure 15: North America Blow-fill-seal Equipment Market Share Analysis, by Country, 2022(E) & 2028(F)

Figure 16: North America Blow-fill-seal Equipment Market Attractiveness Index, by Country, 2022(E) – 2028(F)

Figure 17: North America Blow-fill-seal Equipment Market Share Analysis, by Production Capacity, 2022(E) & 2028(F)

Figure 18: North America Blow-fill-seal Equipment Market Attractiveness Index, by Production Capacity, 2022(E) – 2028(F)

Figure 19: North America Blow-fill-seal Equipment Market Share Analysis, by Product Type, 2022(E) & 2028(F)

Figure 20: North America Blow-fill-seal Equipment Market Attractiveness Index, by Product type, 2022(E) – 2028(F)

Figure 21: North America Blow-fill-seal Equipment Market Share Analysis, by End-user Industry, 2022(E) & 2028(F)

Figure 22: North America Blow-fill-seal Equipment Market Attractiveness Index, by End-user Industry, 2022(E) – 2028(F)

Figure 23: Latin America Blow-fill-seal Equipment Market Share, by Capacity Type (2022)

Figure 24: Latin America Blow-fill-seal Equipment Market Share, by Product Type (2022)

Figure 25: Latin America Blow-fill-seal Equipment Market Share, by End-user Industry (2022)

Figure 26: Latin America Blow-fill-seal Equipment Share, by Country (2022)

Figure 27: Latin America Blow-fill-seal Equipment Market Value (US$ Mn) and Volume (units) analysis 2013 - 2021

Figure 28: Latin America Blow-fill-seal Equipment Market Value (US$ Mn) and Volume (units) Forecast, 2022 - 2028

Figure 29: Latin America Blow-fill-seal Equipment Market Share Analysis, by Country, 2022(E) & 2028(F)

Figure 30: Latin America Blow-fill-seal Equipment Market Attractiveness Index, by Country, 2022(E) – 2028(F)

Figure 31: Latin America Blow-fill-seal Equipment Market Share Analysis, by Production Capacity, 2022(E) & 2028(F)

Figure 32: Latin America Blow-fill-seal Equipment Market Attractiveness Index, by Production Capacity, 2022(E) – 2028(F)

Figure 33: Latin America Blow-fill-seal Equipment Market Share Analysis, by Product Type, 2022(E) & 2028(F)

Figure 34: Latin America Blow-fill-seal Equipment Market Attractiveness Index, by Product type, 2022(E) – 2028(F)

Figure 35: Latin America Blow-fill-seal Equipment Market Share Analysis, by End-user Industry, 2022(E) & 2028(F)

Figure 36: Latin America Blow-fill-seal Equipment Market Attractiveness Index, by End-user Industry, 2022(E) – 2028(F)

Figure 37: Western Europe Blow-fill-seal Equipment Market Share, by Production Capacity (2022)

Figure 38: Western Europe Blow-fill-seal Equipment Market Share, by Product Type (2022)

Figure 39: Western Europe Blow-fill-seal Equipment Market Share, by End-user Industry (2022)

Figure 40: Western Europe Blow-fill-seal Equipment Share, by Country (2022)

Figure 41: Western Europe Blow-fill-seal Equipment Market Value (US$ Mn) and Volume (units) analysis 2013 - 2021

Figure 42: Western Europe Blow-fill-seal Equipment Market Value (US$ Mn) and Volume (units) Forecast, 2022 - 2028

Figure 43: Western Europe Blow-fill-seal Equipment Market Share Analysis, by Country, 2022(E) & 2028(F)

Figure 44: Western Europe Blow-fill-seal Equipment Market Attractiveness Index, by Country, 2022(E) – 2028(F)

Figure 45: Western Europe Blow-fill-seal Equipment Market Share Analysis, by Production Capacity, 2022(E) & 2028(F)

Figure 46: Western Europe Blow-fill-seal Equipment Market Attractiveness Index, by Production Capacity, 2022(E) – 2028(F)

Figure 47: Western Europe Blow-fill-seal Equipment Market Share Analysis, by Product Type, 2022(E) & 2028(F)

Figure 48: Western Europe Blow-fill-seal Equipment Market Attractiveness Index, by Product type, 2022(E) – 2028(F)

Figure 49: Western Europe Blow-fill-seal Equipment Market Share Analysis, by End-user Industry, 2022(E) & 2028(F)

Figure 50: Western Europe Blow-fill-seal Equipment Market Attractiveness Index, by End-user Industry, 2022(E) – 2028(F)

Figure 51: Eastern Europe Blow-fill-seal Equipment Market Share, by Production Capacity (2022)

Figure 52: Eastern Europe Blow-fill-seal Equipment Market Share, by Product Type (2022)

Figure 53: Eastern Europe Blow-fill-seal Equipment Market Share, by End-user Industry (2022)

Figure 54: Eastern Europe Blow-fill-seal Equipment Share, by Country (2022)

Figure 55: Eastern Europe Blow-fill-seal Equipment Market Value (US$ Mn) and Volume (units) analysis 2013 - 2021

Figure 56: Eastern Europe Blow-fill-seal Equipment Market Value (US$ Mn) and Volume (units) Forecast, 2022 – 2028

Figure 57: Eastern Europe Blow-fill-seal Equipment Market Share Analysis, by Country, 2022(E) & 2028(F)

Figure 58: Eastern Europe Blow-fill-seal Equipment Market Attractiveness Index, by Country, 2022(E) – 2028(F)

Figure 59: Eastern Europe Blow-fill-seal Equipment Market Share Analysis, by Production Capacity, 2022(E) & 2028(F)

Figure 60: Eastern Europe Blow-fill-seal Equipment Market Attractiveness Index, by Production Capacity, 2022(E) – 2028(F)

Figure 61: Eastern Europe Blow-fill-seal Equipment Market Share Analysis, by Product Type, 2022(E) & 2028(F)

Figure 62: Eastern Europe Blow-fill-seal Equipment Market Attractiveness Index, by Product type, 2022(E) – 2028(F)

Figure 63: Eastern Europe Blow-fill-seal Equipment Market Share Analysis, by End-user Industry, 2022(E) & 2028(F)

Figure 64: Eastern Europe Blow-fill-seal Equipment Market Attractiveness Index, by End-user Industry, 2022(E) – 2028(F)

Figure 65: APEJ Blow-fill-seal Equipment Market Share, by Production Capacity (2022)

Figure 66: APEJ Blow-fill-seal Equipment Market Share, by Product Type (2022)

Figure 67: APEJ Blow-fill-seal Equipment Market Share, by End-user Industry (2022)

Figure 68: APEJ Blow-fill-seal Equipment Share, by Country (2022)

Figure 69: APEJ Blow-fill-seal Equipment Market Value (US$ Mn) and Volume (units) analysis 2013 - 2021

Figure 70: APEJ Blow-fill-seal Equipment Market Value (US$ Mn) and Volume (units) Forecast, 2022 - 2028

Figure 71: APEJ Blow-fill-seal Equipment Market Share Analysis, by Country, 2022(E) & 2028(F)

Figure 72: APEJ Blow-fill-seal Equipment Market Attractiveness Index, by Country, 2022(E) – 2028(F)

Figure 73: APEJ Blow-fill-seal Equipment Market Share Analysis, by Production Capacity, 2022(E) & 2028(F)

Figure 74: APEJ Blow-fill-seal Equipment Market Attractiveness Index, by Production Capacity, 2022(E) – 2028(F)

Figure 75: APEJ Blow-fill-seal Equipment Market Share Analysis, by Product Type, 2022(E) & 2028(F)

Figure 76: APEJ Blow-fill-seal Equipment Market Attractiveness Index, by Product type, 2022(E) – 2028(F)

Figure 77: APEJ Blow-fill-seal Equipment Market Share Analysis, by End-user Industry, 2022(E) & 2028(F)

Figure 78: APEJ Blow-fill-seal Equipment Market Attractiveness Index, by End-user Industry, 2022(E) – 2028(F)

Figure 79: MEA Blow-fill-seal Equipment Market Share, by Production Capacity (2022)

Figure 80: MEA Blow-fill-seal Equipment Market Share, by Product Type (2022)

Figure 81: MEA Blow-fill-seal Equipment Market Share, by End-user Industry (2022)

Figure 82: MEA Blow-fill-seal Equipment Share, by Country (2022)

Figure 83: MEA Blow-fill-seal Equipment Market Value (US$ Mn) and Volume (units) analysis 2013 - 2021

Figure 84: MEA Blow-fill-seal Equipment Market Value (US$ Mn) and Volume (units) Forecast, 2022 - 2028

Figure 85: MEA Blow-fill-seal Equipment Market Share Analysis, by Country, 2022(E) & 2028(F)

Figure 86: MEA Blow-fill-seal Equipment Market Attractiveness Index, by Country, 2022(E) – 2028(F)

Figure 87: MEA Blow-fill-seal Equipment Market Share Analysis, by Production Capacity, 2022(E) & 2028(F)

Figure 88: MEA Blow-fill-seal Equipment Market Attractiveness Index, by Production Capacity, 2022(E) – 2028(F)

Figure 89: MEA Blow-fill-seal Equipment Market Share Analysis, by Product Type, 2022(E) & 2028(F)

Figure 90: MEA Blow-fill-seal Equipment Market Attractiveness Index, by Product type, 2022(E) – 2028(F)

Figure 91: MEA Blow-fill-seal Equipment Market Share Analysis, by End-user Industry, 2022(E) & 2028(F)

Figure 92: MEA Blow-fill-seal Equipment Market Attractiveness Index, by End-user Industry, 2022(E) – 2028(F)

Figure 93: Japan Blow-fill-seal Equipment Market Share, by Production Capacity (2022)

Figure 94: Japan Blow-fill-seal Equipment Market Share, by Product Type (2022)

Figure 95: Japan Blow-fill-seal Equipment Market Share, by End-user Industry (2022)

Figure 96: Japan Blow-fill-seal Equipment Market Value (US$ Mn) and Volume (units) analysis 2013 - 2021

Figure 97: Japan Blow-fill-seal Equipment Market Value (US$ Mn) and Volume (units) Forecast, 2022 - 2028

Figure 98: Japan Blow-fill-seal Equipment Market Share Analysis, by Production Capacity, 2022(E) & 2028(F)

Figure 99: Japan Blow-fill-seal Equipment Market Attractiveness Index, by Production Capacity, 2022(E) – 2028(F)

Figure 100: Japan Blow-fill-seal Equipment Market Share Analysis, by Product Type, 2022(E) & 2028(F)

Figure 101: Japan Blow-fill-seal Equipment Market Attractiveness Index, by Product type, 2022(E) – 2028(F)

Figure 102: Japan Blow-fill-seal Equipment Market Share Analysis, by End-user Industry, 2022(E) & 2028(F)

Figure 103: Japan Blow-fill-seal Equipment Market Attractiveness Index, by End-user Industry, 2022(E) – 2028(F)

Need specific information?

Request Customization

Explore Packaging Insights

View Reports

Recommendations

Packaging

Anti-counterfeit Packaging Market

Published : April 2022

Packaging

Mailers Market

Published : April 2022

Packaging

Push-in Plug Vials Market

Published : August 2019

Packaging

Stainless Steel Foil Market

Published : March 2019

Google translate

Blow-fill-seal Equipment Market